
 3 hours ago
24
3 hours ago
24
After recently breaching the $65,000 mark, Bitcoin’s (BTC) price may have hit a brick wall. While this recent price increase indicates strong bullish momentum, historical patterns suggest that BTC could pull back before the rally continues.
This on-chain analysis highlights the indicators affirming this forecast and what investors should expect in the near term.
On-Chain Metrics Reveals It’s Time to Take a Break
Bitcoin’s price rise to $65,497 is contrary to the expectations investors had at the beginning of September when most predicted it would be a bearish month. However, according to the price Daily Active Addresses (DAA) divergence, BTC could drop before making any attempt to retest $70,000.
The price DAA checks whether user engagement increases with a coin’s value. When the price increases alongside active addresses, it is a buy signal, and the cryptocurrency’s value can increase.
At press time, Bitcoin’s price DAA had plummeted to -54.89%. This decline indicates that market participants have reduced their interaction with the coin. As such, the recent uptrend might be weak, as this is a sell signal.
Read more: How To Get Paid in Bitcoin (BTC): Everything You Need To Know
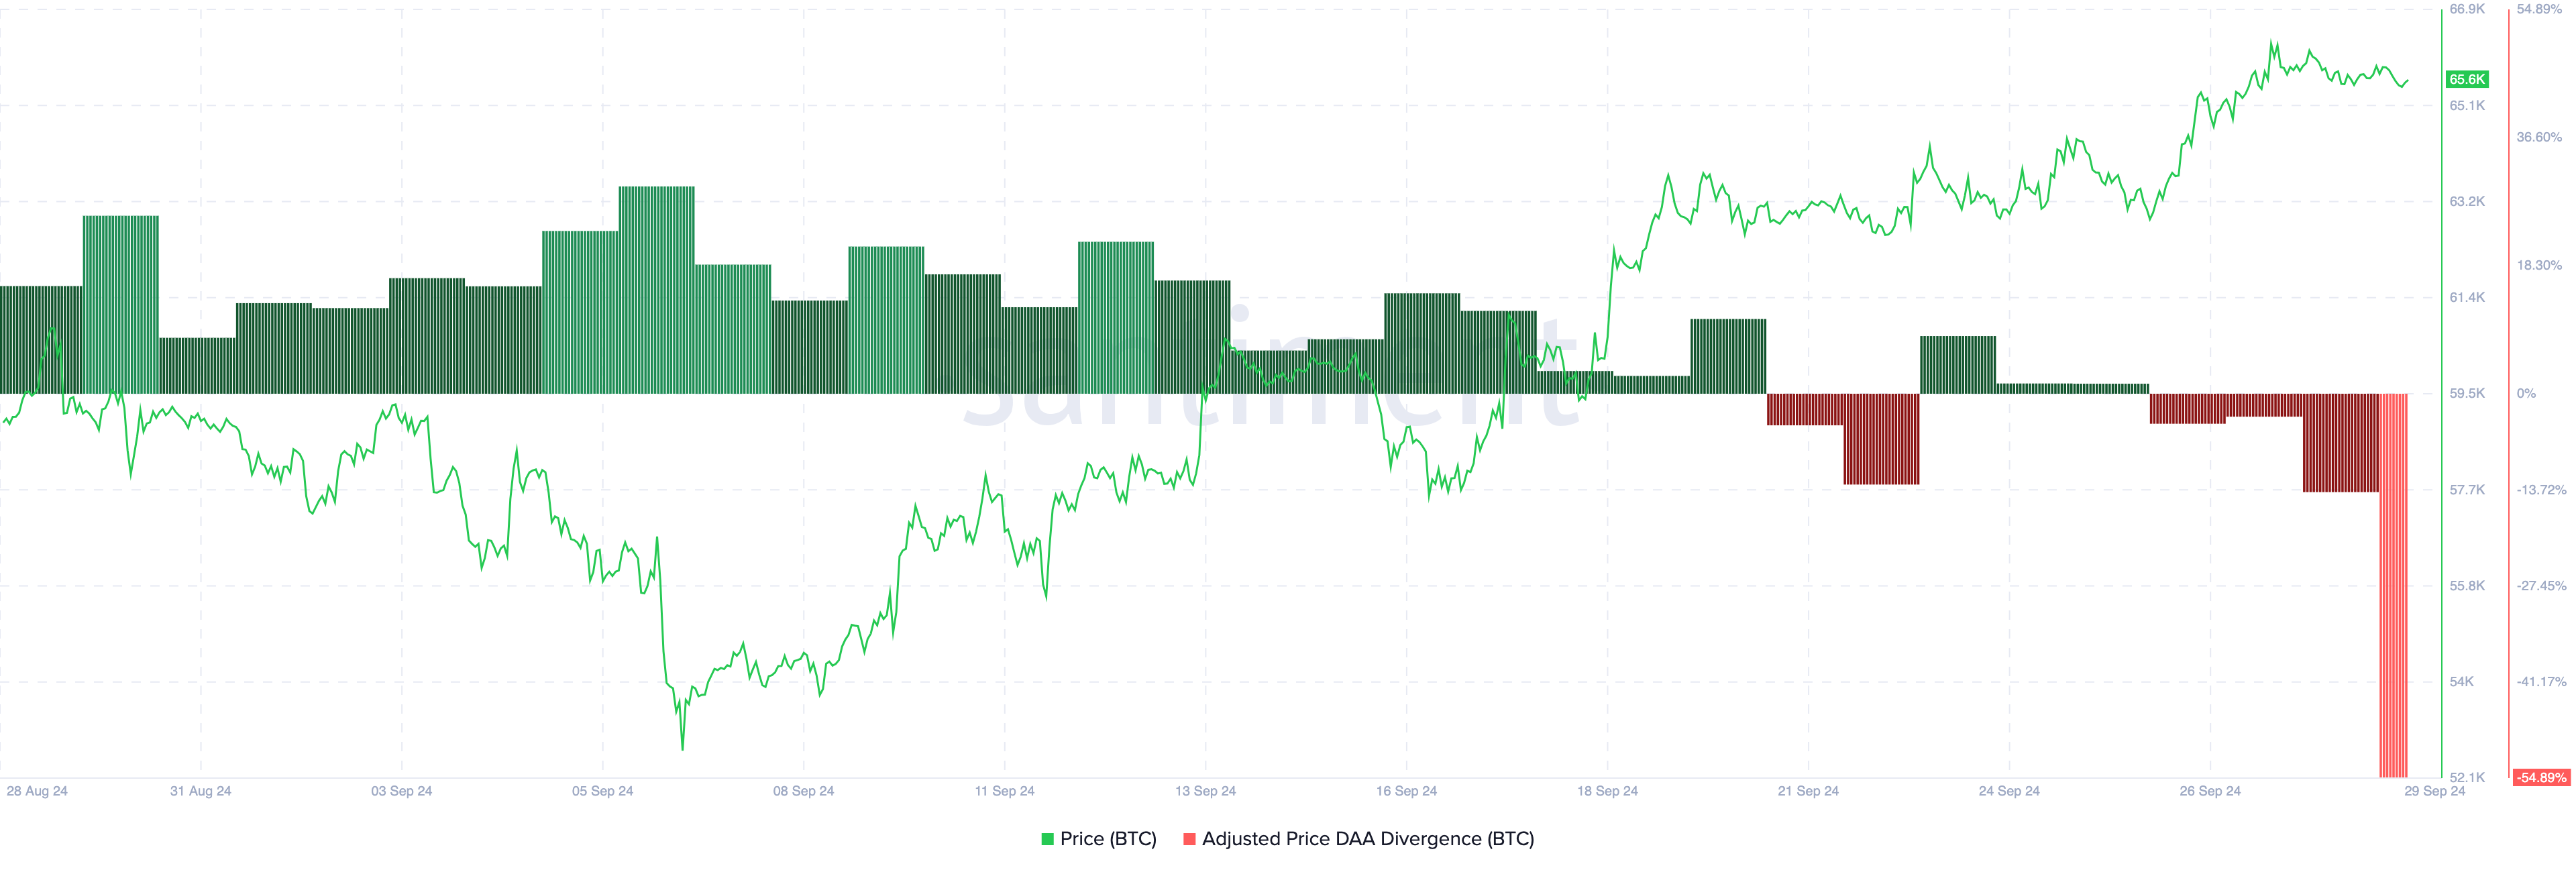 Bitcoin Price DAA Divergence Divergence. Source: Santiment
Furthermore, the coin’s performance has impacted holders’ profitability. On September 16, 79.92% of Bitcoin holders were in the money. However, based on the Historical In/Out of Money (HIOM), which compares addresses making money at different price ranges, 91.97% are now in the money.
Historically, when the ratio hit such levels, some holders take profits, leading Bitcoin’s price to decrease. For instance, a similar thing happened in July when the holders in profits were about 93%.
A few days later, it declined to 78%. Another scenario took place on August 25 when the percentage was 88.35%, and the decline in Bitcoin price later led to 76.23%. Therefore, if history rhymes with the current condition, BTC could be set for a short-term drawdown.
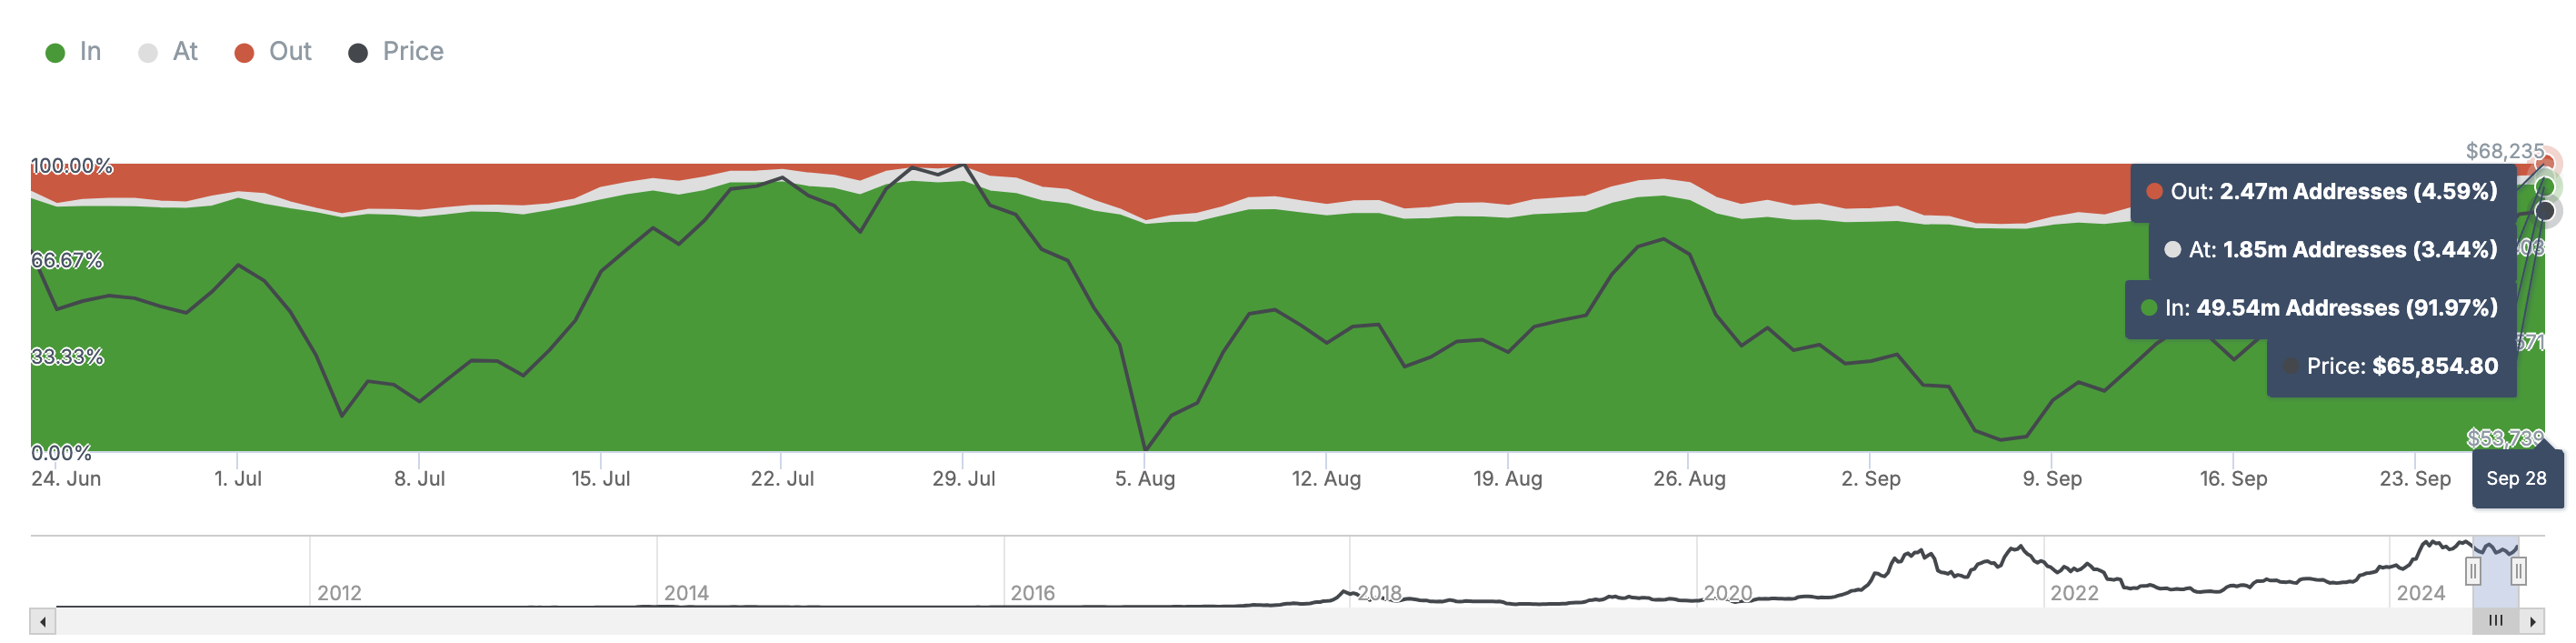 Bitcoin Historical In/Out of Money. Source: IntoTheBlock
BTC Price Prediction: $60,000 Coming
While the price is expected to produce a positive return, the daily chart shows that Bitcoin’s attempt to reach $69,000 has encountered an obstruction. This indicates that bears are trying to overthrow bullish dominance.
If the price drops below $65,000, the $65,838 region will be a major resistance zone. However, buyers will likely try to defend BTC from going below support at $63,093. The chart below shows that this potential defense could fail.
Read more: 7 Best Crypto Exchanges in the USA for Bitcoin (BTC) Trading
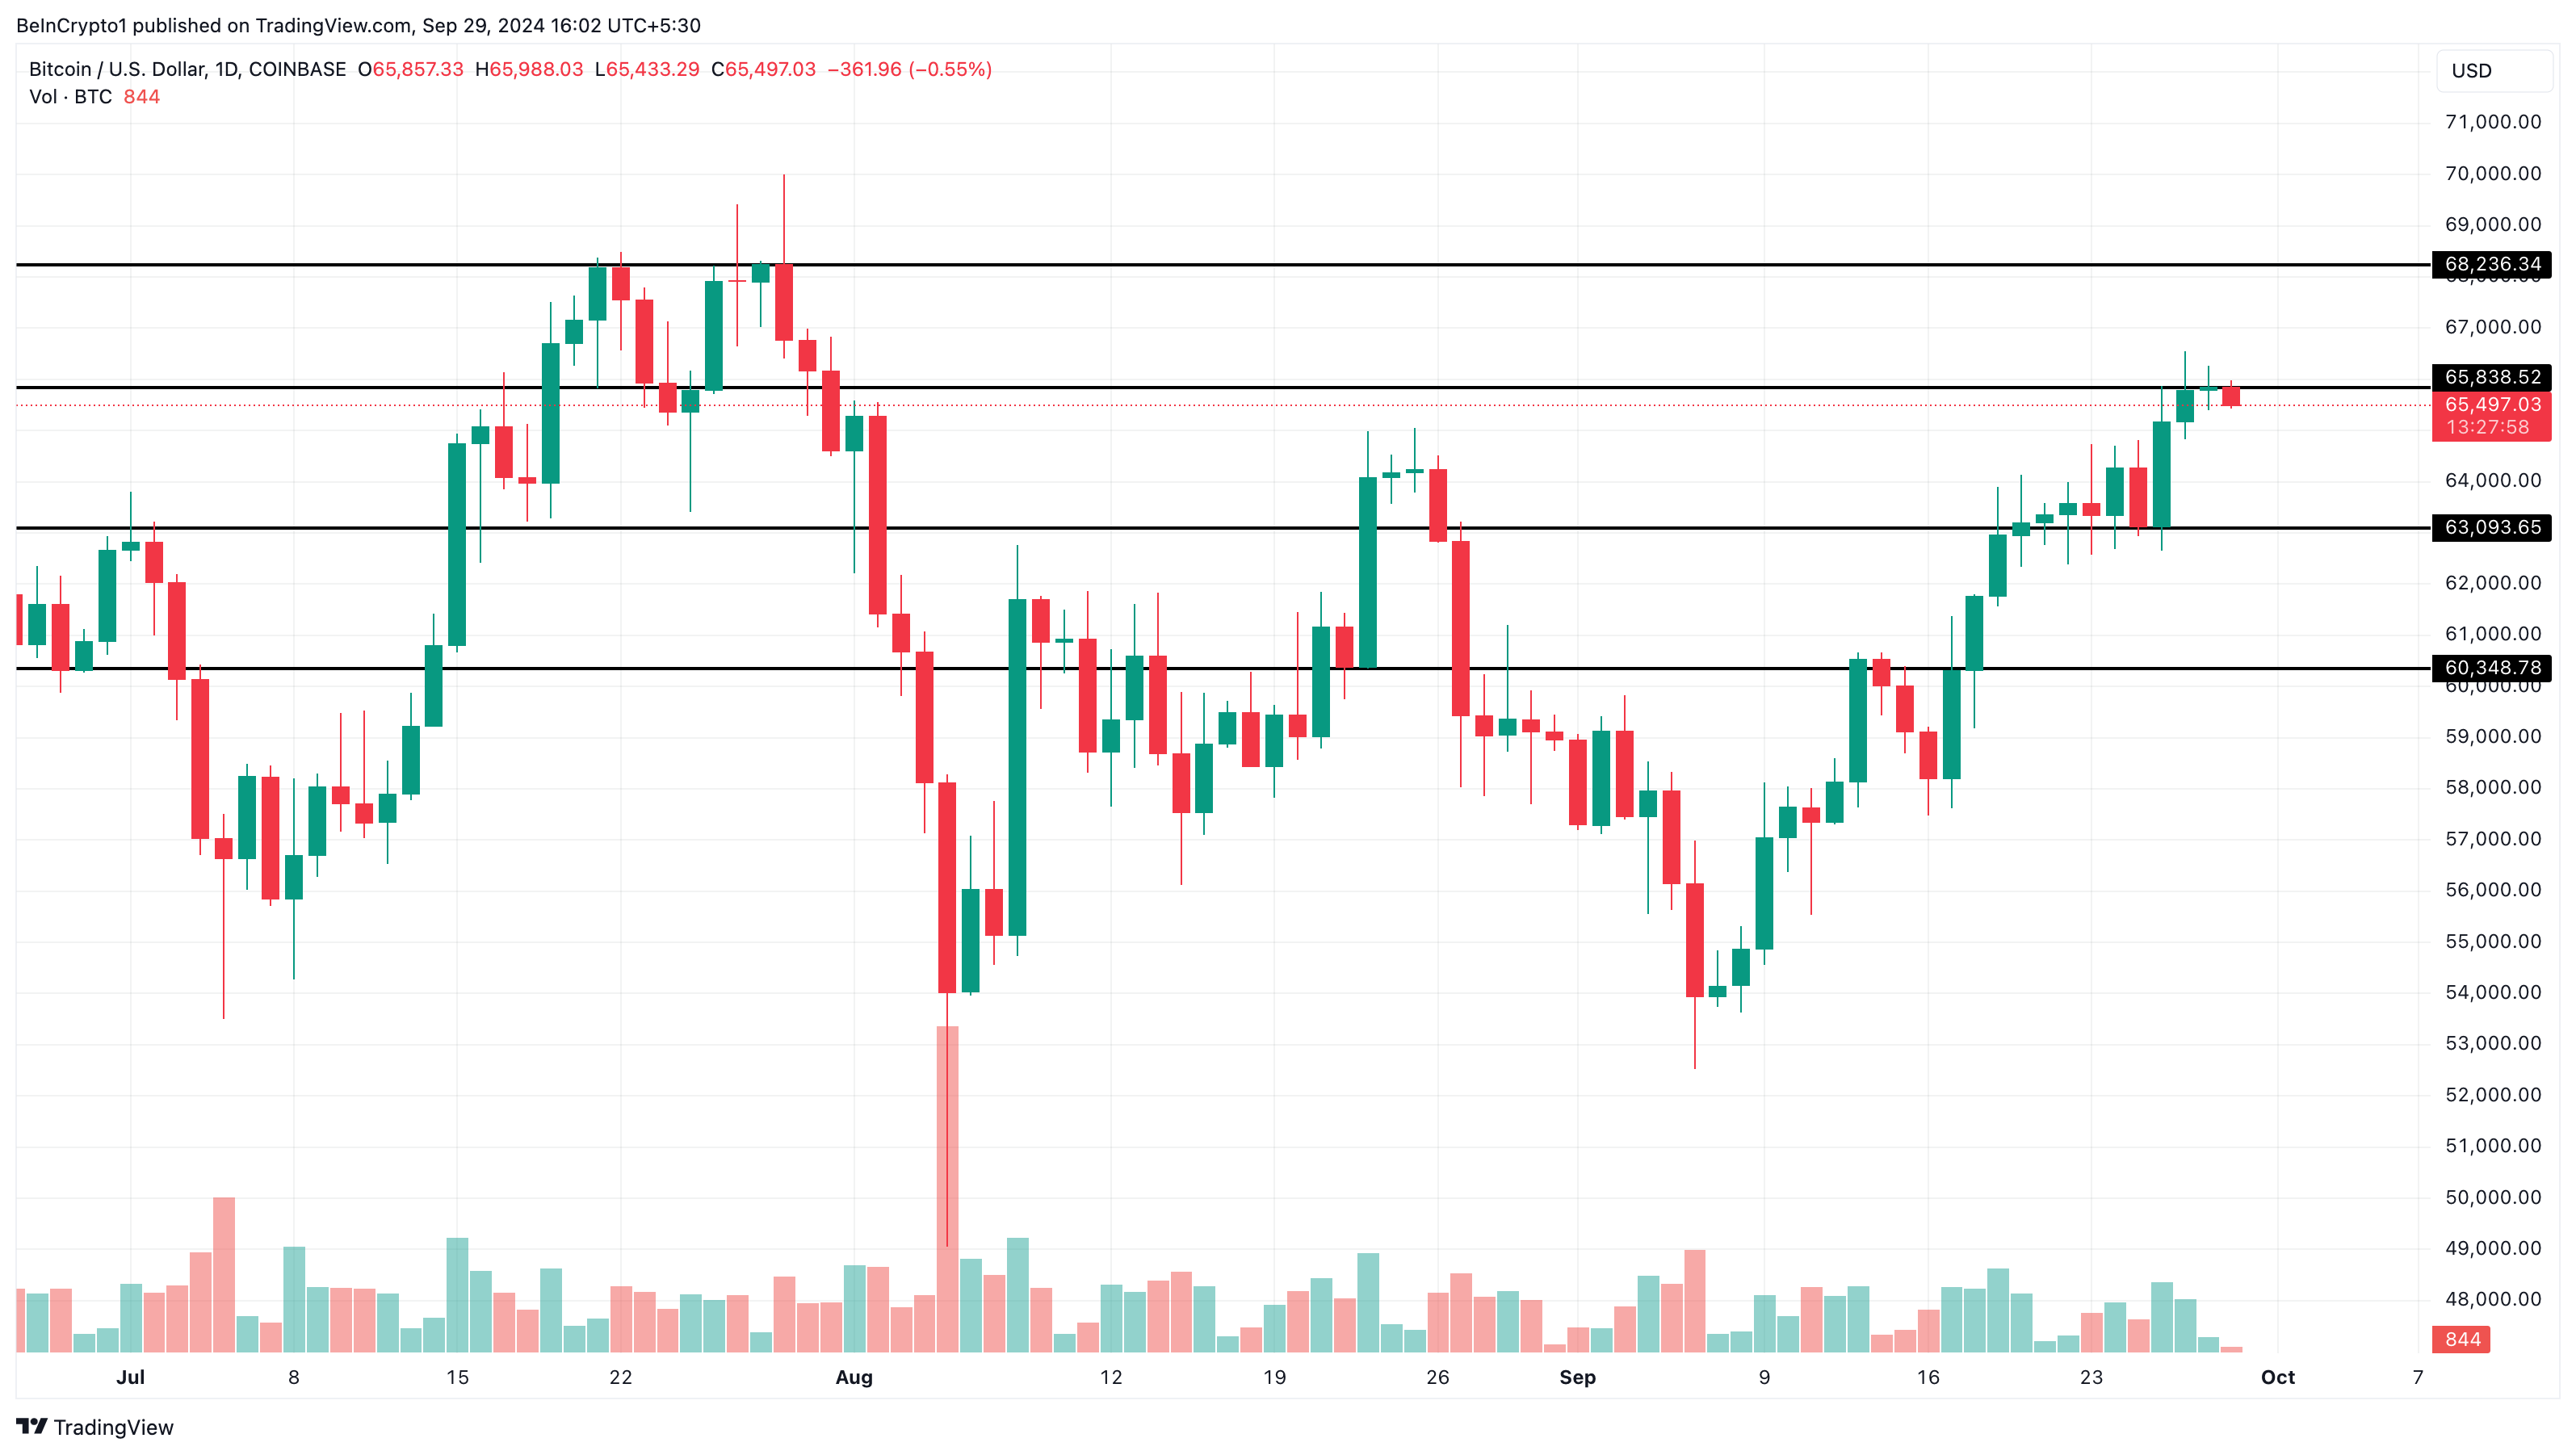 Bitcoin Daily Price Analysis. Source: TradingView
 As such, Bitcoin’s price could decrease to $60,348 within a few days. On the other hand, a close above $65,838 will tilt the trend in bulls’ favor. In that scenario, Bitcoin might jump to $68,236.
The post Bitcoin (BTC) Price Likely to Experience Brief Correction After Hitting $65,000 appeared first on BeInCrypto.


 English (US) ·