
 4 weeks ago
51
4 weeks ago
51

Bloom Energy stock closed at $206.73 on July 16 — a sharp intraday reversal slicing through multiple support levels. The daily chart confirms a corrective phase, with price trading well below its key moving averages. A landmark $1.7 billion funding commitment now confronts this bearish technical structure.
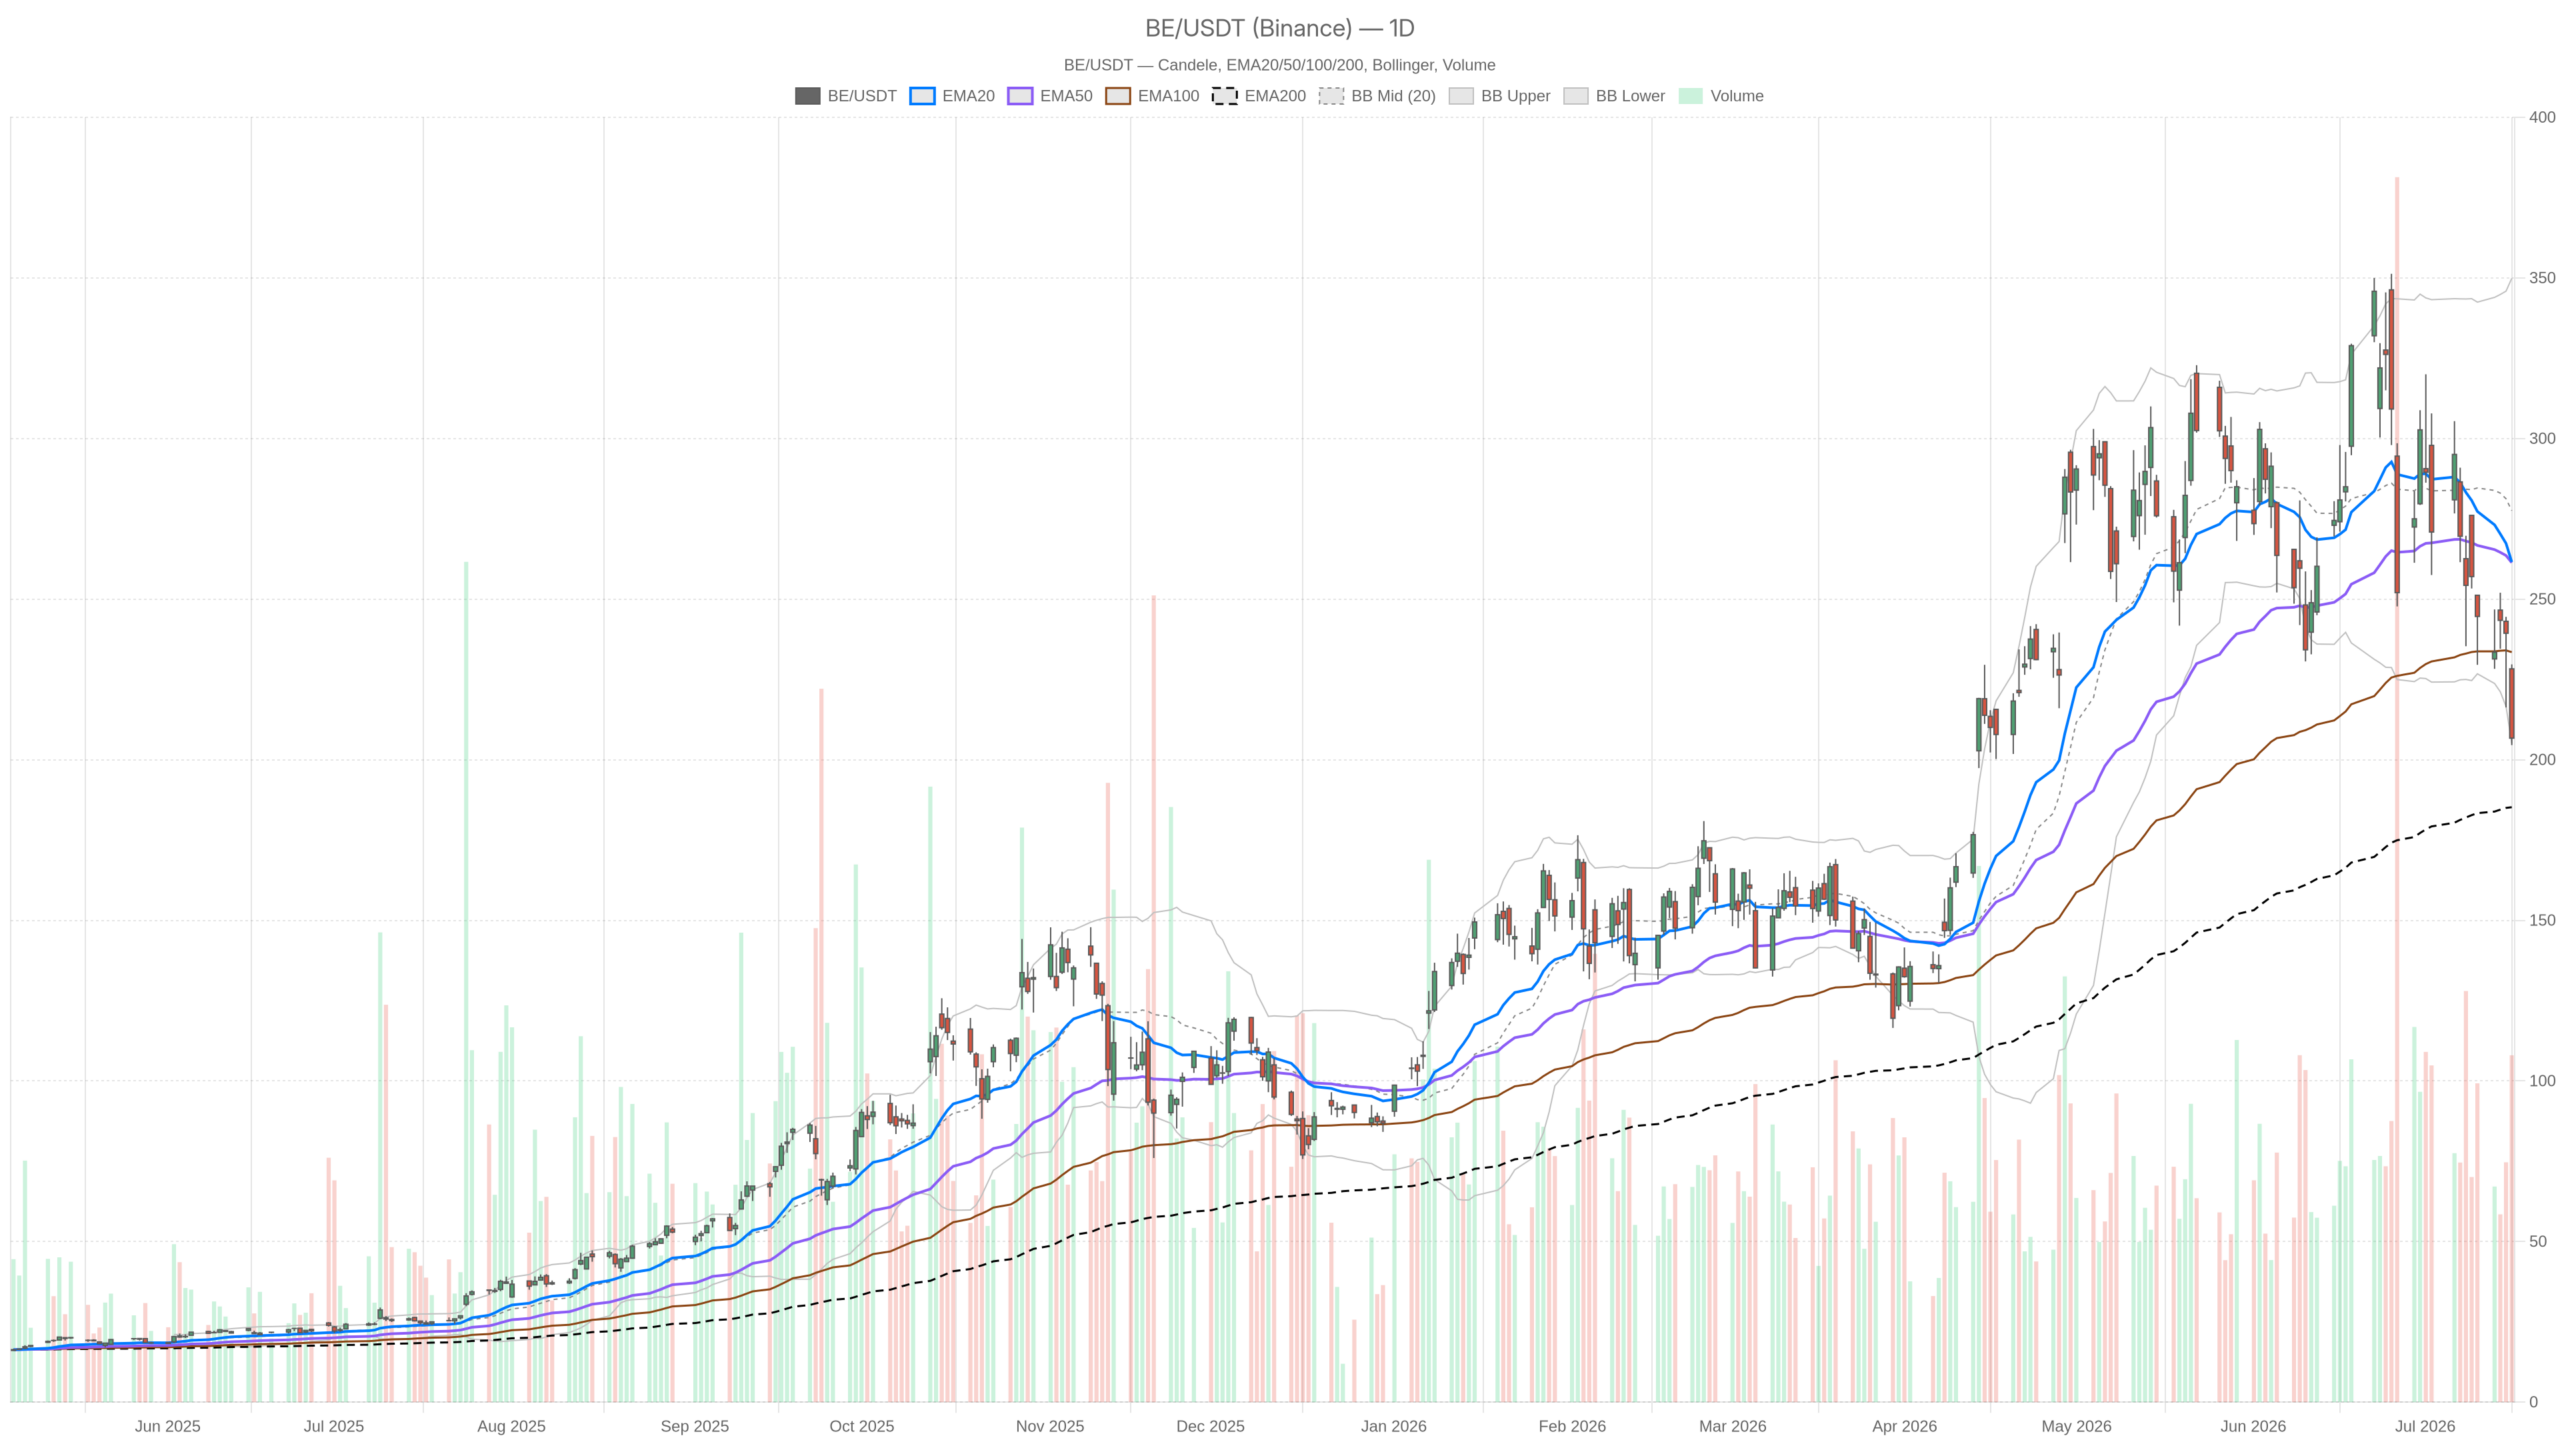 BE — daily chart with candlesticks, EMA20/EMA50 and volume.
Key takeaways
- BE closed at $206.73 on July 16, far below both the 20-day EMA at $261.57 and the 50-day EMA at $261.34.
- A $1.7 billion commitment from Oaktree Capital and IDF supports Bloom’s fuel cell technology for AI infrastructure buildout.
- Daily RSI at 36.61 and a widening negative MACD histogram confirm accelerating downward momentum.
- Price sits near the lower Bollinger Band at $205.19; a break below $205 could open the door toward $197.63.
- Despite the positive catalyst, the stock reversed sharply lower — strong selling pressure overwhelmed the news.
Bloom Energy Stock Daily Bias: Firmly Bearish
The daily bias on Bloom Energy stock is clearly negative. Price closed far below both major moving averages, confirming a sustained breakdown rather than a minor pullback.
BE closed at $206.73, well beneath both the 20-day EMA at $261.57 and the 50-day EMA at $261.34. Those two averages sitting virtually on top of each other signals that the intermediate trend has turned decisively lower. The gap exceeds $54, reinforcing that the selling pressure is not a minor pullback.
Meanwhile, the RSI at 36.61 is approaching oversold territory without yet confirming a reversal. Momentum is weak and deteriorating, but there is no flush low that might attract contrarian buyers. The MACD configuration is more concerning. The MACD line sits at -13.48, the signal at -5.43, and the histogram at -8.05. That widening negative histogram confirms accelerating downward momentum.
Bollinger Band Proximity and Volatility Context
The Bollinger Band setup adds further context. The mid-band is at $277.54 and the lower band at $205.19. Price closed at $206.73, essentially sitting on the lower band. This proximity can sometimes precede a short-term bounce. However, it also reflects how compressed the stock has become near a multi-week low. That does not in itself constitute a buy signal.
Notably, the daily ATR of $33.12 is exceptionally wide. On July 16 alone, the trading range spanned roughly $25. This is a volatile name, and that volatility is not symmetric — the intraday reversal was sharply to the downside. Pivot analysis places support at $197.63 and resistance at $222.76, with the pivot point at $213.66. The close below the daily pivot is another bearish marker.
Hourly Timeframe Confirms the Breakdown
The 1-hour chart reinforces rather than softens the bearish daily outlook. Every major moving average stacks well above price in a textbook bearish cascade.
BE was trading around $206.50 at the close of the 15:30 candle. The 1H EMA20 sat at $224.18, the EMA50 at $239.54, and the EMA200 at $268.76. That cascading downward structure — where each EMA sits below the next longer-term one — confirms bearish alignment. The regime on the hourly is explicitly flagged as bearish.
Hourly RSI at 32.87 is even more compressed than on the daily, nudging deeper into oversold territory. The MACD on this timeframe shows a line of -9.44 against a signal of -7.44, with the histogram at -2.00. The negative histogram is less extreme than on the daily. This could hint at a short-term deceleration in selling. That alone, however, is not enough to shift the bias.
The 1H Bollinger lower band sits at $201.64. Price is hugging the lower region of that band, confirming a market under sustained selling pressure. Hourly pivot support is at $204.75. A break below that level would likely open the door toward the $201–$202 zone.
15-Minute Chart: A Faint Signal in Bearish Territory
The 15-minute chart offers at most a tactical pause signal, not a directional shift. Price remains well below all three EMAs with the regime firmly bearish.
Price at $206.50 remains well below all three EMAs. The 20-period sits at $211.26, the 50-period at $219.72, and the 200-period at $241.92. RSI at 34.16 reflects persistent weakness. There is one marginal observation worth noting, however. The 15-minute MACD histogram turned slightly positive at +0.44, with the MACD line at -4.73 crossing above the signal at -5.17.
That micro-crossover can signal a very brief tactical pause in selling. In the context of the broader daily and hourly bearish structure, however, this is not a reversal signal. It is at best a short-term stabilization cue. It may be useful for traders looking to time an entry on any mean-reversion attempt. It does not shift the overarching outlook.
The $1.7 Billion Catalyst Meets Technical Resistance
The $1.7 billion Oaktree and IDF commitment is fundamentally significant. Yet Bloom Energy stock reversed sharply on the news — a bearish signal that selling pressure overwhelms even material catalysts.
The funding from Industrial Development Funding and Oaktree Capital supports Bloom Energy’s fuel cell technology for Nebius’ AI cloud infrastructure buildout. The deal focuses on behind-the-meter, clean, and resilient power solutions for AI workloads. This is exactly the kind of positioning that has driven the broader alternative energy and AI infrastructure trade. BE has been highlighted alongside peers as positioned to benefit from AI-driven data center power demand.
Not all market commentary is aligned, however. A recent Seeking Alpha analysis characterized Bloom Energy stock as “priced for perfection.” It cited a weak enforceable backlog, JV-driven revenue dynamics, and dilution risks. The prior session on July 15 also saw BE close at $239.38 — a -1.65% decline even as broader markets posted gains. That divergence is a warning sign that the selling is stock-specific, not macro-driven.
The market’s reaction to the announcement was therefore instructive. Despite a headline that might have sparked a significant rally, BE reversed sharply lower. Opening near $228, the stock failed to hold any meaningful bid and closed near session lows. That kind of response to positive news is itself a bearish signal. It suggests either the news was partially priced in or broader selling pressure is strong enough to overwhelm even a material catalyst.
Bullish and Bearish Scenarios for Bloom Energy Stock
The bearish scenario is currently the path of least resistance for Bloom Energy stock. However, a credible bullish case exists if specific support levels hold.
The Bullish Case
Still, a bullish case requires specific conditions. The $1.7 billion Oaktree and IDF commitment is a credible long-term fundamental anchor. If BE can stabilize above the $205 lower Bollinger Band level and the $204.75 hourly pivot support, a short-term bounce toward the daily pivot point at $213.66 is plausible. A move back above that level and eventually toward the $222.76 resistance zone would require broader market support. Sustained buying interest linked to the AI infrastructure narrative would also be necessary. The EMA200 on the daily at $185.22 represents deeper structural support, though reaching it would imply significantly more downside first.
The Bearish Case
In contrast, the bearish scenario remains the path of least resistance. A daily close below $205 — and particularly below the daily S1 pivot at $197.63 — would confirm the breakdown and likely accelerate selling. The ATR of $33 on the daily means a move to the $170s would not be structurally unusual given the current volatility regime. Both the hourly and 15-minute regimes are explicitly bearish. Daily momentum indicators continue to deteriorate. The burden of proof sits firmly with the bulls.
Positioning Into Uncertainty
Bloom Energy stock navigates a difficult intersection: a compelling AI infrastructure story meets a deeply damaged technical structure. The $1.7 billion commitment from Oaktree and IDF provides a meaningful fundamental floor. Yet the market’s failure to rally on that news speaks volumes about current sentiment.
Overall, volatility remains extreme, with a daily ATR above $33. Any position in BE carries significant short-term risk in both directions. The technical bias is bearish until proven otherwise. Traders should watch the $204–$205 support zone closely. Longer-term investors must weigh the dilution and backlog concerns against the structural AI power demand tailwind that makes the story compelling in the first place.
FAQ
What is driving the bearish bias in Bloom Energy stock?
Bloom Energy stock closed at $206.73 on July 16, far below the 20-day EMA at $261.57 and the 50-day EMA at $261.34. The RSI at 36.61 reflects deteriorating momentum, while the widening negative MACD histogram confirms accelerating selling pressure. The gap between price and key moving averages exceeds $54, signaling a sustained breakdown rather than a minor pullback.
Can the $1.7 billion funding commitment reverse the downturn?
The $1.7 billion commitment from Oaktree Capital and IDF is a credible long-term fundamental anchor for Bloom Energy’s fuel cell technology. However, the stock’s sharp reversal on the day of the announcement — opening near $228 and closing at $206.73 — suggests selling pressure currently overwhelms even material catalysts. Stabilization above $205 would be the first prerequisite for any fundamental-driven recovery.
What are the key support levels to watch for BE?
The most immediate support zone sits between $204.75 (hourly pivot support) and $205.19 (daily lower Bollinger Band). Below that, the daily S1 pivot at $197.63 represents the next critical level. A close beneath $197.63 would confirm the breakdown and likely accelerate selling pressure.
What does the daily ATR indicate about Bloom Energy stock?
The daily ATR of $33.12 reflects exceptionally wide trading ranges. On July 16 alone, the range spanned roughly $25. This elevated volatility means that moves to the $170s in a continued selloff, or rapid reversals on positive catalysts, would both be structurally normal given current conditions.
Disclaimer: This article is for informational purposes only and does not constitute financial advice, an investment recommendation, or a solicitation to buy or sell any financial instrument or cryptocurrency. The analysis provided is not indicative of future results. Investing in crypto assets and financial markets carries a high risk of capital loss. Always do your own research (DYOR) and consult a qualified financial advisor before making any decision.
Article produced with the assistance of artificial intelligence and reviewed by the editorial team.








 English (US) ·