
 3 months ago
50
3 months ago
50
Hyperliquid (HYPE) price is trading at $38.27, down 2.31% on the day, as a completed double top pattern and a dense liquidation cluster at $35.03 raise the odds of an accelerated leg lower.
The token has failed to hold gains above $42.67, and the price is now consolidating. Two independent signals now define the near-term trend line.
HYPE Long Traders Should Be Worried
The HYPE liquidation heatmap shows a dense band of leveraged long positions clustered around $35.03. Cumulative long liquidation leverage at that level totals $27.36 million.
A move below $35.03 would trigger the forced closure of those positions in rapid succession. This would create mechanical selling pressure that could accelerate any decline well beyond the initial breakdown.
Want more token insights like this? Sign up for Editor Harsh Notariya’s Daily Crypto Newsletter here.
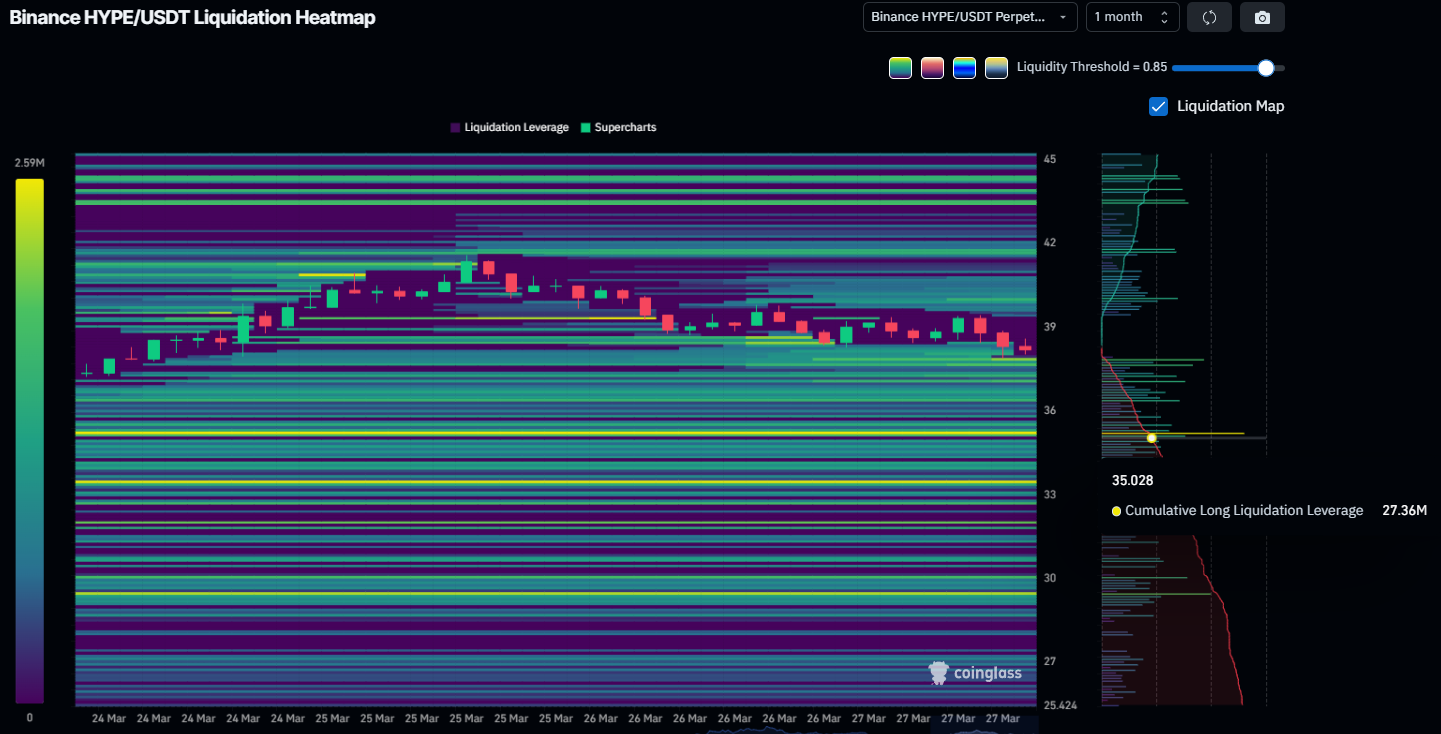 HYPE Liquidation Heatmap. Source: Coinglass
The heatmap shows relatively thin liquidation stacking between $38 and $35, suggesting the price could slice through that range with limited friction. The absence of significant long-side leverage above $39 further limits the likelihood of a demand-driven reversal before the $35.03 test arrives.
Selling Pressure Set Dominates HYPE
The Klinger Oscillator (KVO) is currently reading 8.09K on the daily chart, sitting just above the zero line with a clear downward trajectory. The signal line (green) has already turned lower, and the KVO (blue) is converging toward a bearish crossover.
The Klinger Oscillator measures the difference between two volume-weighted EMAs of price to gauge whether money is flowing into or out of an asset. When it rises above zero, buying pressure dominates; when it falls below zero, selling pressure takes control.
The indicator peaked near 25K in early March, coinciding with HYPE’s rally to $43.76. Since then, momentum has declined in three successive lower highs, a pattern of deteriorating buying pressure that mirrors the price action.
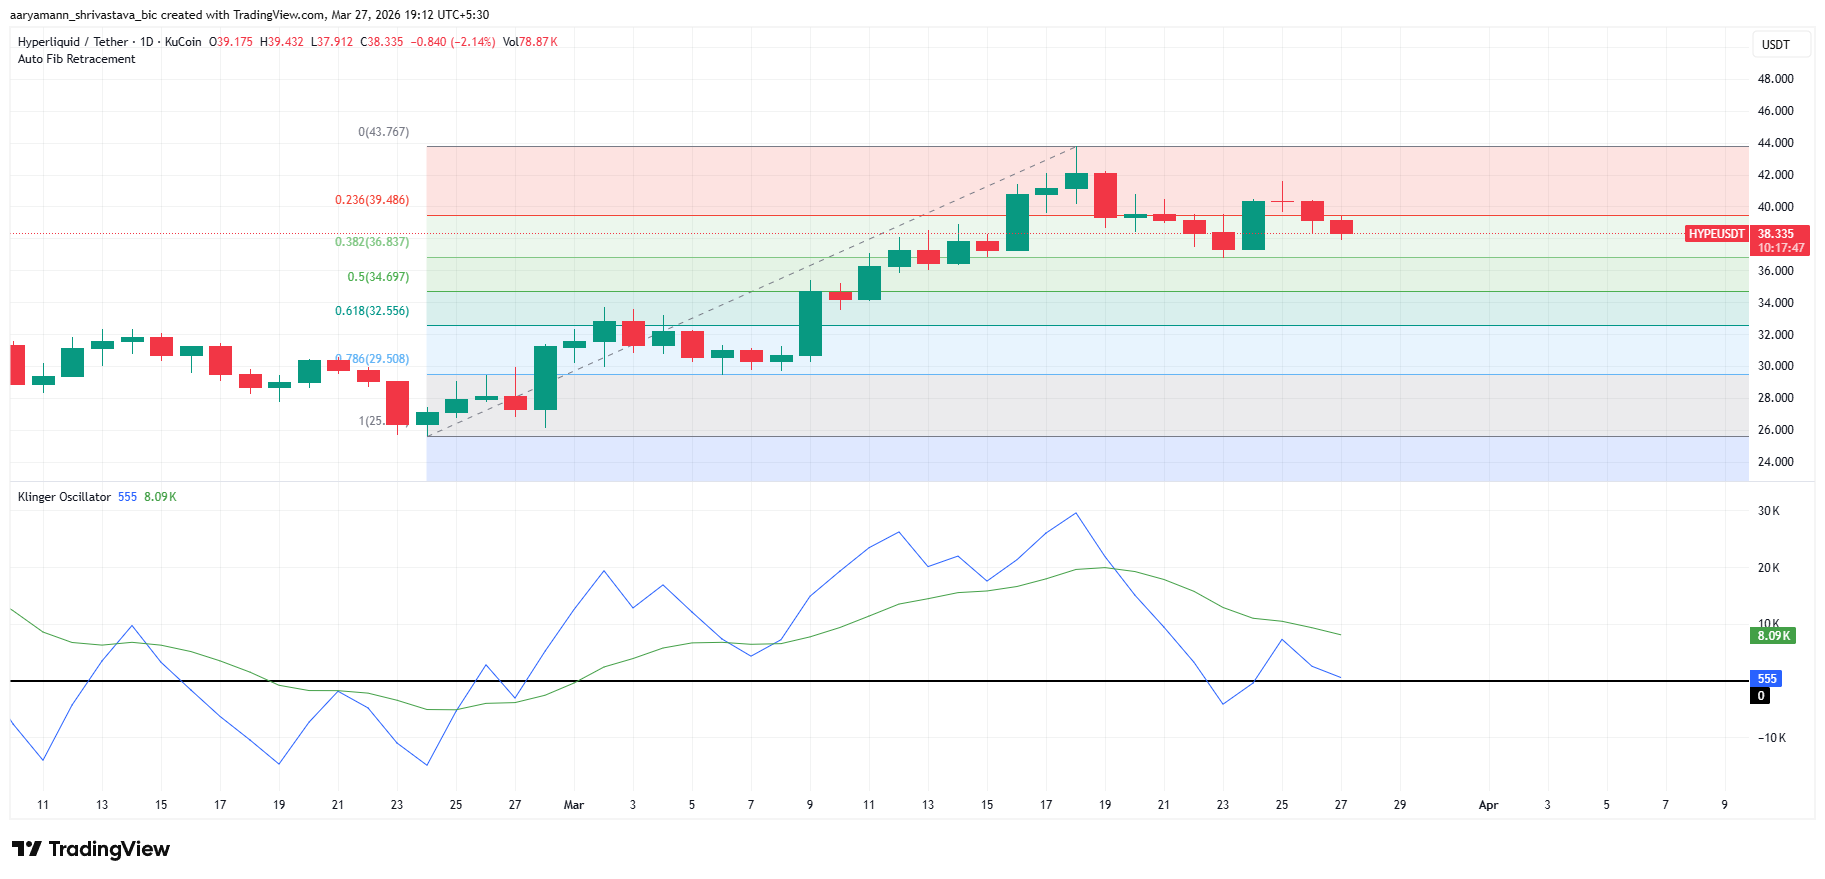 HYPE KVO. Source: TradingView
A confirmed cross below zero on the KVO would shift volume-weighted momentum from bullish to bearish. Historically, on the HYPE daily chart, both prior KVO zero-line breaks preceded drawdowns.
The 0.382 Fibonacci retracement level sits at $36.83, offering the first meaningful demand zone before price reaches the $35.03 liquidation cluster. Should the KVO break below zero while the price is below $36.83, the path to $32.33 — the 0.618 Fibonacci level — becomes the primary scenario.
HYPE Price Levels To Watch
The daily chart shows HYPE has completed a double top breakdown, now underway. Price is currently sitting at $38.27, hovering around the support at the same level.
The pattern’s full downside projection is calculated from the breakdown point at the $35.03 neckline. This points HYPE to $21.64 on a confirmed breakdown, matching the 37.49% decline annotated on the chart.
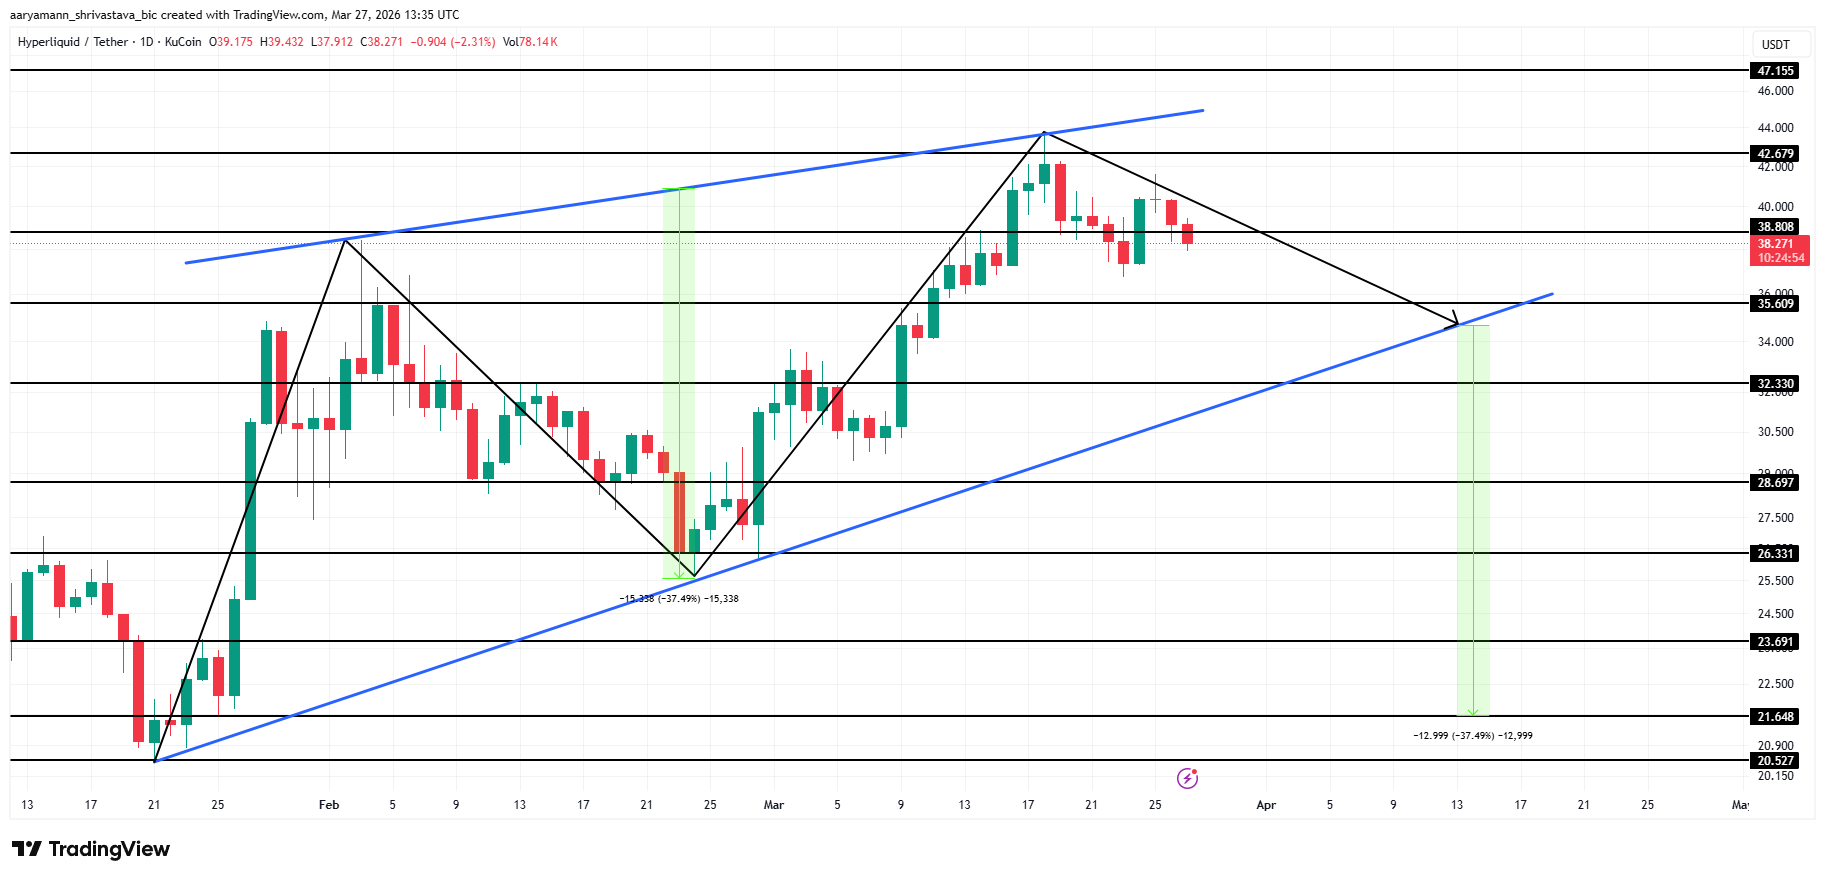 HYPE Price Analysis. Source: TradingView
Holding $35.03 is therefore non-negotiable for bulls. Only a daily close below it would confirm the double top and open the door to $32.33 first, then $28.69.
For the bearish thesis to be invalidated, HYPE would need to reclaim $38.80 and then push through $42.67 with conviction. A break above $42.67 would negate the double top structure entirely, shifting the bias back toward the $47.15 resistance.
The post 2 Reasons Why $35 Is a Critical Juncture for Hyperliquid (HYPE) Price appeared first on BeInCrypto.


 English (US) ·