Ethereum (ETH) derivatives traders have reacted to the altcoin’s failure to sustain the $3,500 level by increasing their short positions. This surge in bearish bets suggests that a majority of traders anticipate further price declines for ETH.
However, do other metrics align with this sentiment? This on-chain analysis explores whether these traders might be making the right call — or if the data hints at a potential rebound.
Ethereum Shorts Outpace Longs Amid Profit-Taking
As of this writing, the liquidation map reveals that Ethereum derivatives traders have opened short positions totaling $918 million since the cryptocurrency’s price drop yesterday.
In trading, going long or short represents a trader’s expectation of price movement. Opening a long position suggests the trader believes the price will rise. Going short, on the other hand, indicates that they expect a decline.
Currently, ETH long positions are valued at approximately $218 million, highlighting that shorts have significantly outpaced bullish exposure by $700 million. However, it is important to note that if Ethereum’s price rallies toward $3,700, most of these positions with high leverage might face liquidation.
 Ethereum Liquidation Map. Source: Coinglass
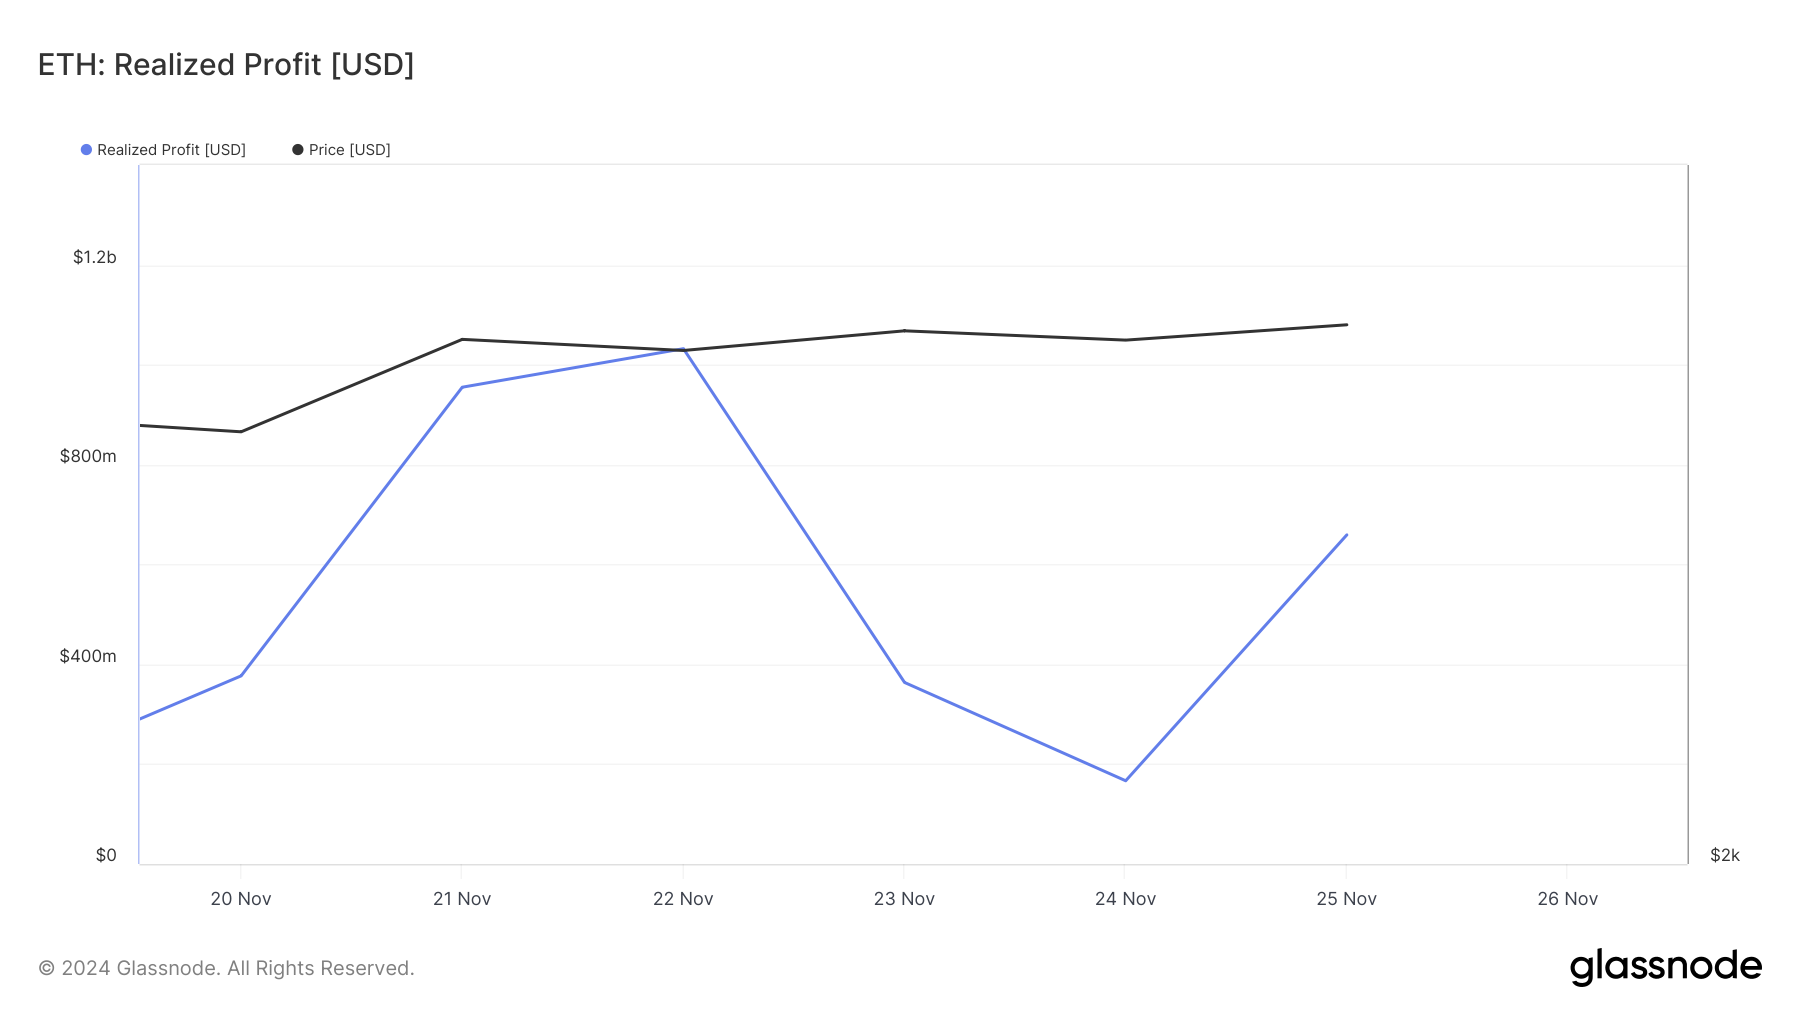
However, data from Glassnode suggests that these traders may not face liquidation unless a significant rebound occurs. This is primarily due to the rise in realized profits, which indicates that traders have locked in gains by selling or transferring assets at a higher price.
As of press time, Ethereum’s realized profits had surged to $659.22 million, suggesting that most shorts have capitalized on the price movement and may be less vulnerable to liquidation in the short term.
 Ethereum Realized Profits. Source: Glassnode
ETH Price Prediction: Bearish
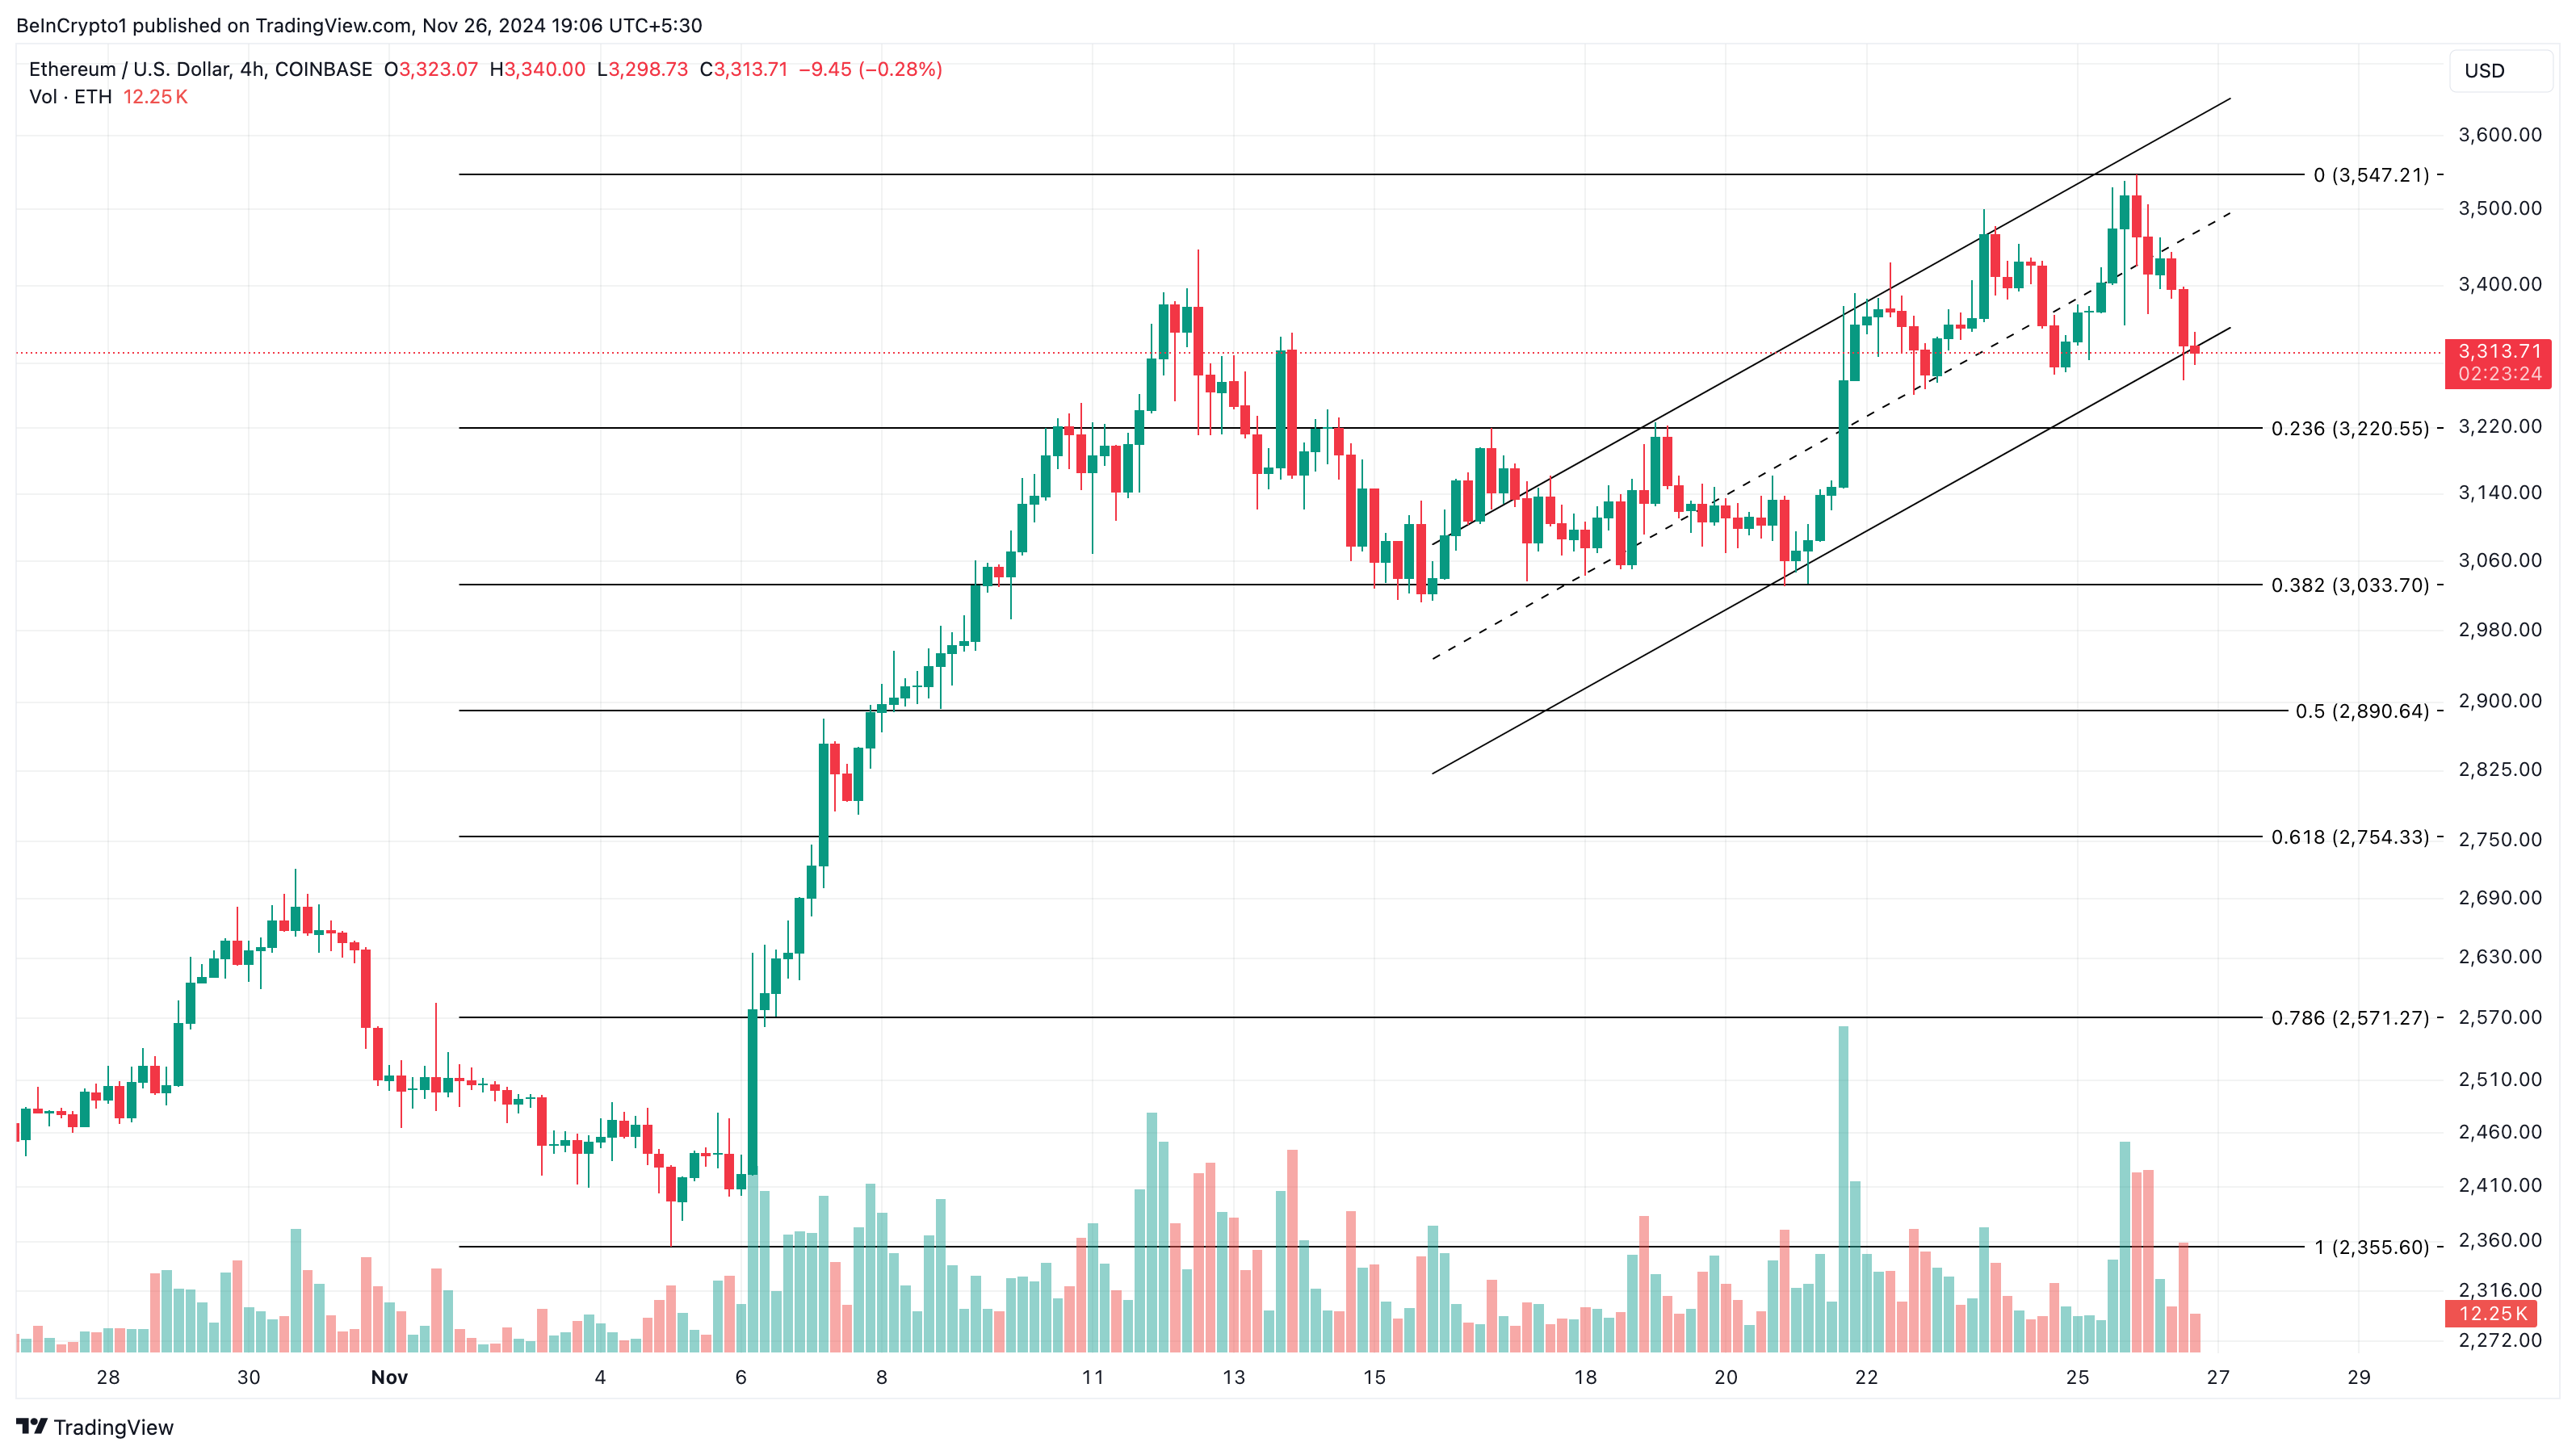
Since November 16, ETH’s price has been trading within an ascending channel. An ascending channel is a chart pattern formed by two upward trend lines, one drawn above the price (resistance) and the other below (support).
This pattern indicates that the price is moving higher within a defined range. The support line shows where the price tends to bounce higher, and the resistance line marks where the price faces selling pressure.
As seen below, ETH, at $3,314, has dropped below the support line. If selling pressure intensifies, the cryptocurrency’s value is likely to sink to $3,033.
 Ethereum 4-Hour Analysis. Source: TradingView
 However, Ethereum derivatives traders need to watch out. Should the altcoin fail to drop below $3,220, this might not happen. Instead, the value could rise to $3,547 and possibly climb to $4,000.
The post $900 Million in Ethereum Shorts Mark Traders’ Response to ETH Price Drop Below $3,500 appeared first on BeInCrypto.

 2 hours ago
5


 English (US) ·