
 1 month ago
42
1 month ago
42
AAPL stock closed at $315.32 on July 10, holding near all-time highs. The daily trend structure remains firmly bullish across all timeframes. However, hourly momentum shows early signs of fatigue. Short-term friction calls for measured positioning even as the broader uptrend stays intact.
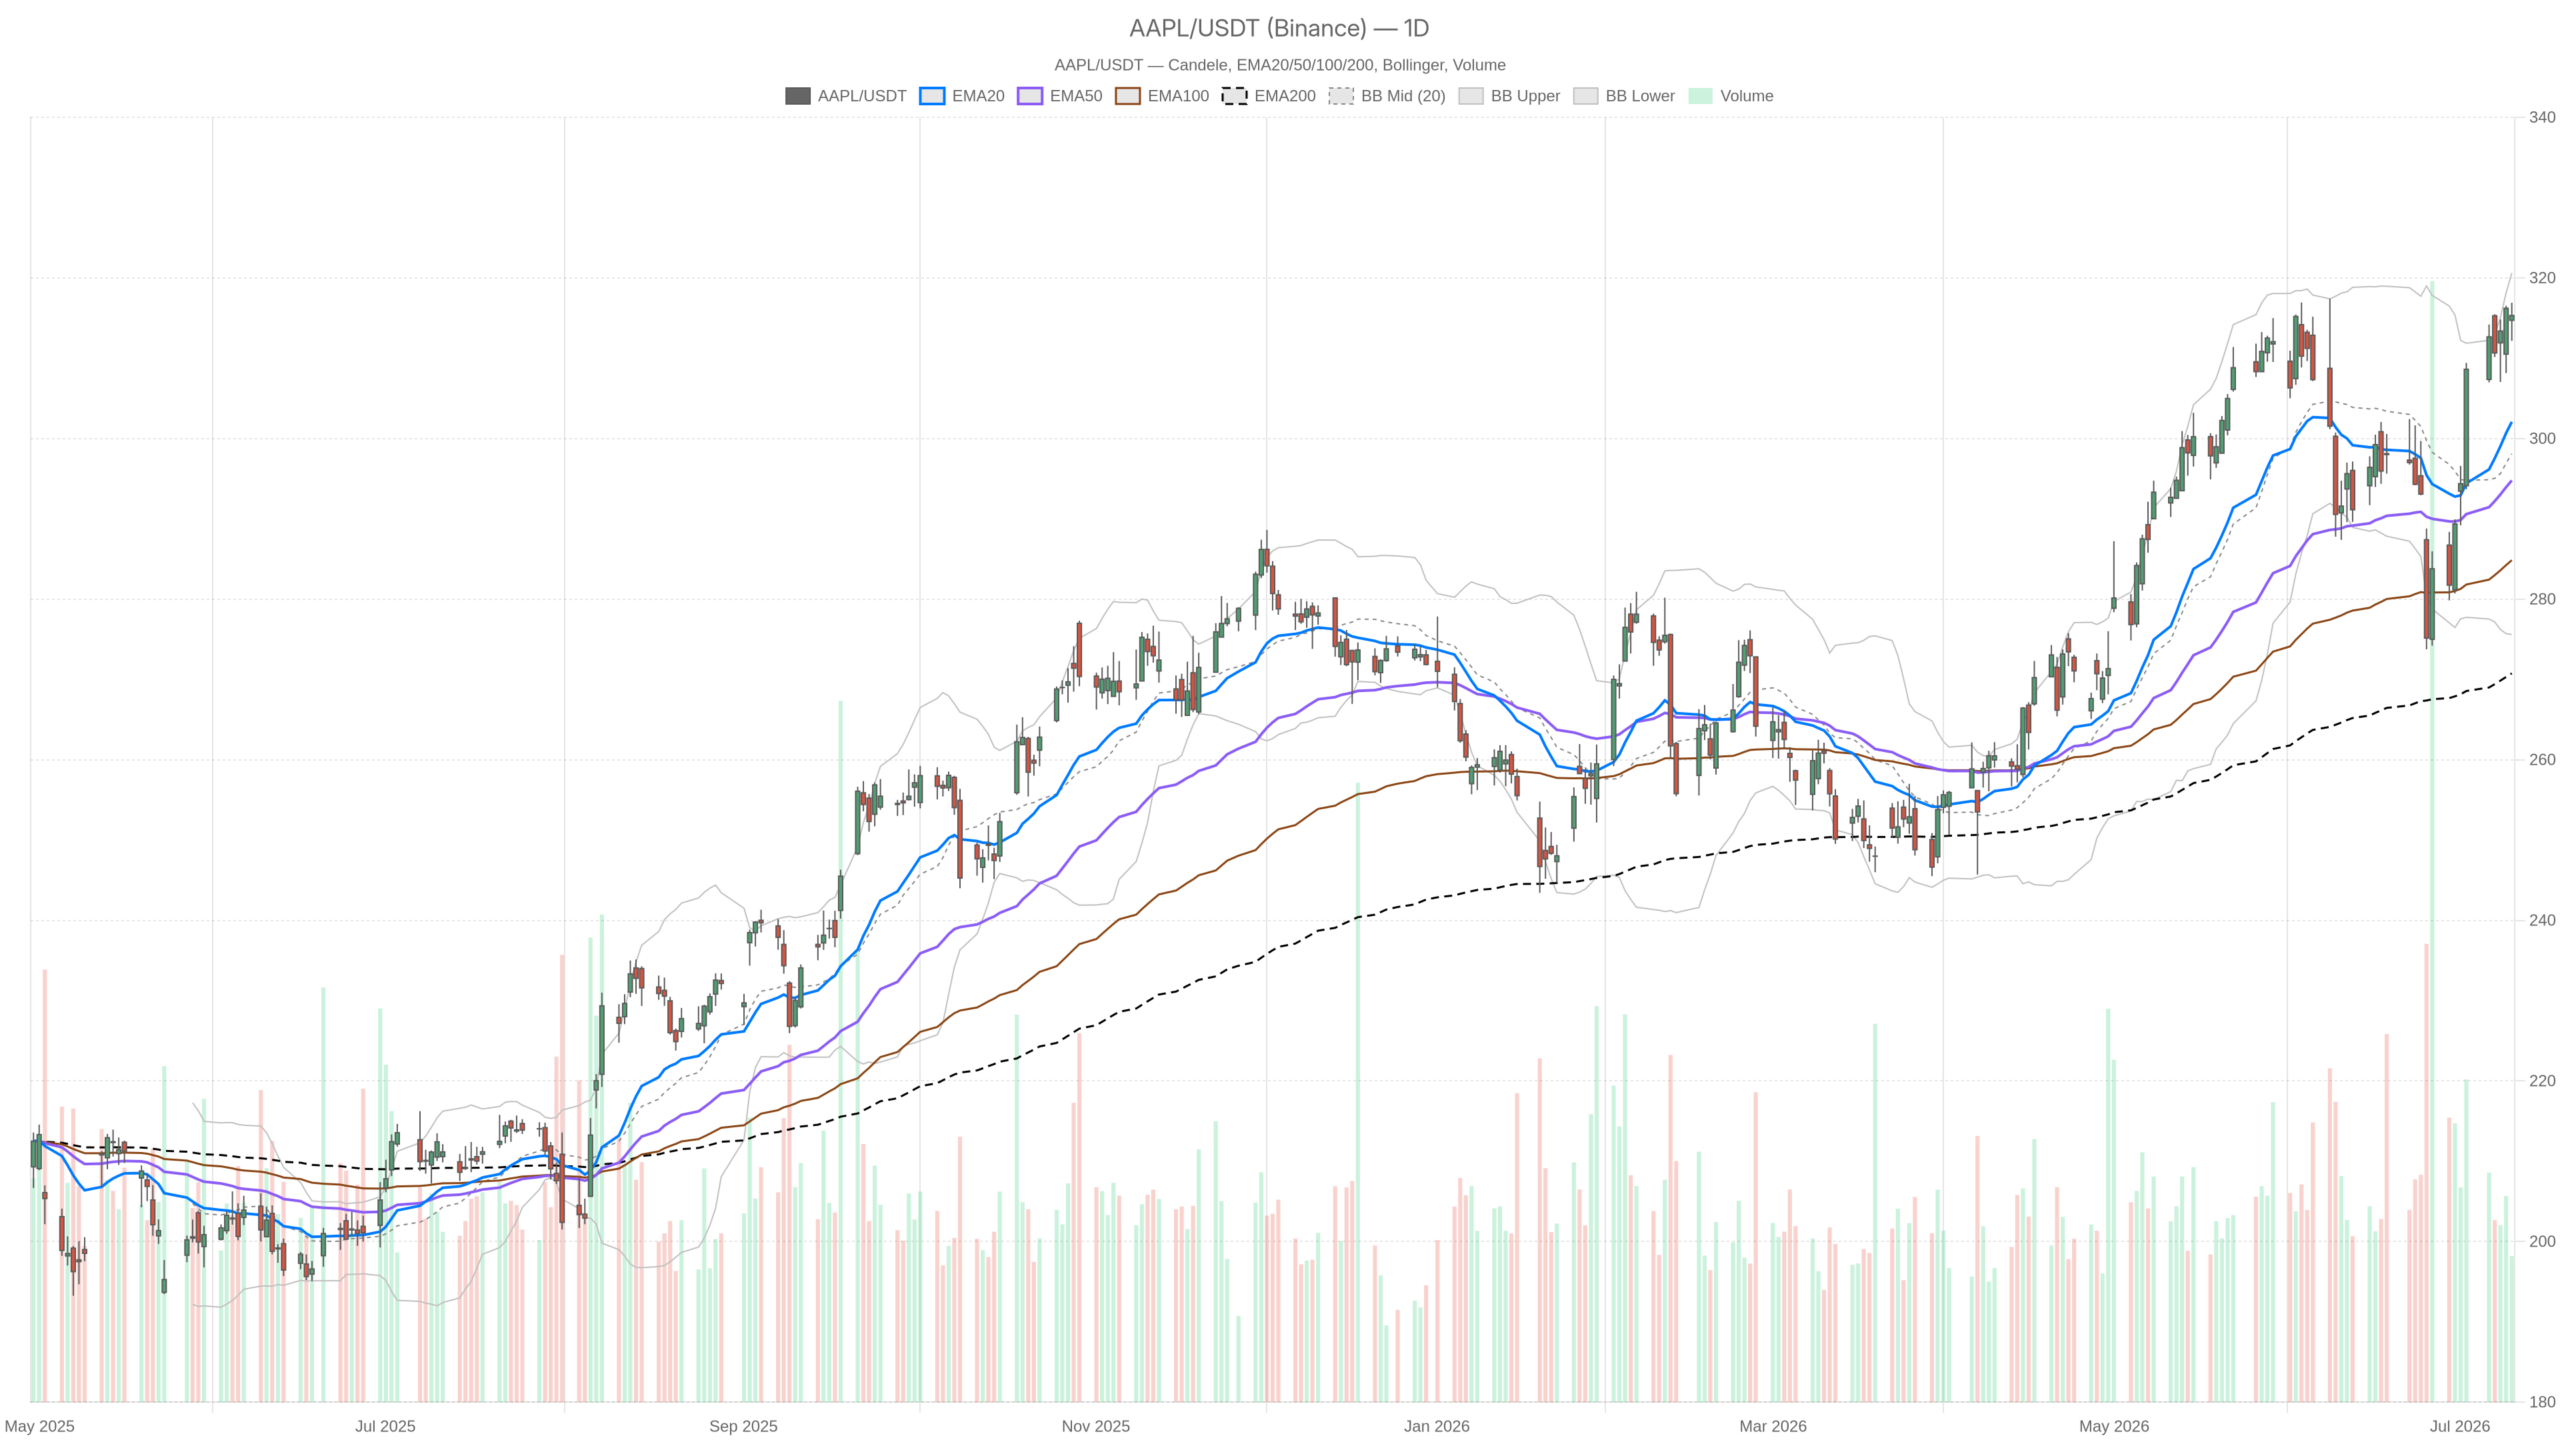 AAPL — daily chart with candlesticks, EMA20/EMA50 and volume.
Key takeaways
- AAPL closed at $315.32 on July 10, with daily EMAs stacked in a classic bullish alignment.
- Daily RSI at 62.93 leaves room for further upside before reaching overbought territory above 70.
- The hourly MACD has turned negative at -0.32, flagging near-term momentum fatigue.
- A daily ATR of $8.95 means a correction to the $306–$307 zone would stay within normal volatility parameters.
- Evercore ISI maintains a $365 price target on Apple stock.
Daily Timeframe: The Core Bullish Case for AAPL Stock
Apple’s daily chart confirms a well-structured uptrend with no signs of reversal. Price sits comfortably above all three key moving averages, and momentum continues to build.
Trend Structure and Moving Average Alignment
Notably, the daily chart anchors this analysis with compelling evidence. Price closed at $315.32, comfortably above the EMA20 at $302.08, the EMA50 at $294.78, and the EMA200 at $270.76. All three moving averages form a classic bullish stack. Short-term sits above medium-term, which sits above long-term. This alignment confirms Apple’s trend structure remains intact.
Momentum and Volatility Context
Daily RSI sits at 62.93. That is firmly bullish without triggering an overbought reading above 70. There is room for further upside before momentum becomes technically extended. Meanwhile, the MACD reinforces the constructive picture. The line at 4.61 is well above the signal at 1.89, and the histogram at 2.72 is positive and expanding. Momentum on the daily timeframe is not decelerating — it is building.
The daily Bollinger Bands offer additional context. With the midline at $298.10, the upper band at $320.61, and the lower band at $275.59, price trends toward the upper band without breaching it. That positioning reflects a strong but not overextended trend. The ATR14 at $8.95 indicates meaningful daily volatility — a key input for setting realistic stop distances.
Daily pivot levels place the pivot point at $314.80. R1 sits at $317.43, and S1 at $312.69. Price is currently sandwiched between the pivot and R1. This suggests consolidation after recent momentum rather than an active breakout. A clean break above $317.43 would be a meaningful technical signal.
Hourly Timeframe: Bullish Trend, But Momentum Is Slipping
The hourly trend remains structurally bullish for AAPL stock, but momentum is deteriorating. The MACD has crossed bearishly, hinting at near-term consolidation before any further upside.
MACD Divergence Warning
On the hourly chart, Apple maintains its bullish regime, but the details are more nuanced. Price at $315.33 sits above the H1 EMA20 at $313.77, the EMA50 at $308.75, and the EMA200 at $301.12. The trend structure remains well-ordered on this timeframe.
However, the hourly MACD introduces a clear warning. The MACD line at 1.72 has crossed below the signal line at 2.04. This produces a negative histogram reading of -0.32. It is a short-term bearish divergence in momentum. It does not overturn the daily thesis. Still, it indicates the upside push is losing steam in the near term.
Support, Resistance, and Band Positioning
The hourly RSI at 60.23 remains healthy — bullish but not extreme. It is consistent with a market that is consolidating gains rather than rolling over. At the same time, the hourly Bollinger Bands show price closing at $315.33, just inside the upper band at $316.97. That proximity to the upper band, combined with the MACD crossover, reinforces the case for digestion before another leg higher.
Hourly pivot levels show support at $314.44 and resistance at $316.57. The close at $315.33 sits mid-range between these levels. There is no decisive directional conviction here — price is essentially treading water.
15-Minute Chart: Intraday Stabilization
The 15-minute chart shows intraday stabilization taking hold for AAPL stock. Short-term selling pressure has eased, with price holding above near-term dynamic support.
At the 15-minute level, the picture shifts back toward a mild bullish tilt. RSI at 55.11 is neutral-to-positive. The MACD histogram registers a modest positive 0.18, with the line at 0.47 above the signal at 0.29. This suggests short-term selling pressure has eased. Intraday stabilization is taking hold.
Meanwhile, the 15m EMA20 at $314.92 and EMA50 at $314.23 both sit below price. They provide near-term dynamic support. For execution purposes, the $314.48 zone — the 15m S1 pivot — represents the first meaningful intraday support level to watch.
Fundamental Backdrop: Contradictory Signals Around Apple
Apple’s fundamental picture is divided between bullish institutional backing and skepticism over AI monetization. Both narratives carry weight in the current market environment.
The news flow around Apple is split. On the constructive side, AAPL shares are up 48.9% over the past year and 16.9% year-to-date, according to D.E. Shaw coverage on Yahoo Finance. Evercore ISI maintained its coverage on June 25 with a $365 price target. The firm is cited as one of the best stocks to buy in 2026 according to billionaire D.E. Shaw.
In contrast, at least one analyst view characterizes AAPL as a Sell at current levels. The argument: AI monetization remains weak, and rising iPhone costs could weigh on growth. The “AI toll booth” thesis — that Apple can extract meaningful revenue from its AI integration — is being directly questioned. Additionally, the ongoing Musk-Altman clash over Apple’s OpenAI lawsuit keeps legal uncertainty circling the name. These are not trivial headwinds, even if the market has largely shrugged them off.
Bullish Scenario: What Would Sustain the Uptrend
A sustained hold above $314.80 followed by a break through $317.43 would confirm upside resolution for AAPL stock. The $320.61 upper Bollinger Band would then become the next natural target.
The bullish case is well-supported by the daily structure. A move through $317.43 would signal that consolidation has resolved to the upside. In that scenario, the upper Bollinger Band at $320.61 is the next objective. A recovery in the hourly MACD histogram back into positive territory would provide the momentum confirmation currently missing. Furthermore, continued institutional interest — evidenced by D.E. Shaw’s positioning and Evercore’s $365 target — supplies a meaningful fundamental tailwind.
Bearish Scenario: What Would Undermine the Bull Thesis
A breakdown below $312.69 would be the first structural warning for Apple stock. Further MACD deterioration could accelerate correction risk toward the $306–$307 zone.
The bears have a few credible entry points. A drop below S1 at $312.69 on the daily chart would trigger the first structural alarm. More significantly, if the hourly MACD continues to deteriorate and RSI rolls below 50, the short-term correction risk increases. The AI monetization concerns, combined with legal overhang from the OpenAI lawsuit, could serve as fundamental catalysts for a pullback. Still, the daily ATR of $8.95 means a correction to the $306–$307 zone would be entirely within normal volatility parameters. It would not technically break the bull trend.
Positioning and Volatility Outlook
Apple stock’s core bias remains bullish with the daily timeframe in control. However, the hourly MACD divergence calls for patience rather than immediate aggression on the long side.
Overall, Apple remains in a well-defined uptrend. The daily timeframe is clearly dominant, and the core bias is bullish. That said, the hourly MACD divergence is a real friction point — one that calls for patience. At the same time, nothing in the data suggests the trend is reversing. The more likely scenario is a brief consolidation between $312 and $317 before the next directional move.
Volatility, as reflected by the daily ATR, remains elevated enough to punish poorly sized positions. Traders should factor that into their risk management rather than assuming smooth continuation. Meanwhile, the fundamental debate over AI monetization adds an additional layer of uncertainty. Purely technical analysis cannot resolve that question.
FAQ
Is Apple stock still in a bullish trend?
Yes. The daily chart shows price above the EMA20 at $302.08, the EMA50 at $294.78, and the EMA200 at $270.76. All three moving averages are stacked in a classic bullish alignment. Daily RSI at 62.93 supports the uptrend without being overextended.
What is the key near-term risk for AAPL stock?
The hourly MACD has turned negative at -0.32, signaling near-term momentum fatigue. A breakdown below the daily S1 at $312.69 would be the first structural warning sign for the bullish thesis.
What are analysts saying about Apple stock right now?
Evercore ISI maintains a $365 price target on AAPL. However, some analysts argue the stock is a Sell at current levels, citing weak AI monetization and rising iPhone costs as headwinds.
What support and resistance levels should traders watch?
Daily support sits at $312.69 (S1), with resistance at $317.43 (R1). The upper Bollinger Band at $320.61 is the next major upside target. On the downside, the $306–$307 zone near the EMA20 represents deeper support within normal volatility parameters.
Disclaimer: This article is for informational purposes only and does not constitute financial advice, an investment recommendation, or a solicitation to buy or sell any financial instrument or cryptocurrency. The analysis provided is not indicative of future results. Investing in crypto assets and financial markets carries a high risk of capital loss. Always do your own research (DYOR) and consult a qualified financial advisor before making any decision.
Article produced with the assistance of artificial intelligence and reviewed by the editorial team.







 English (US) ·