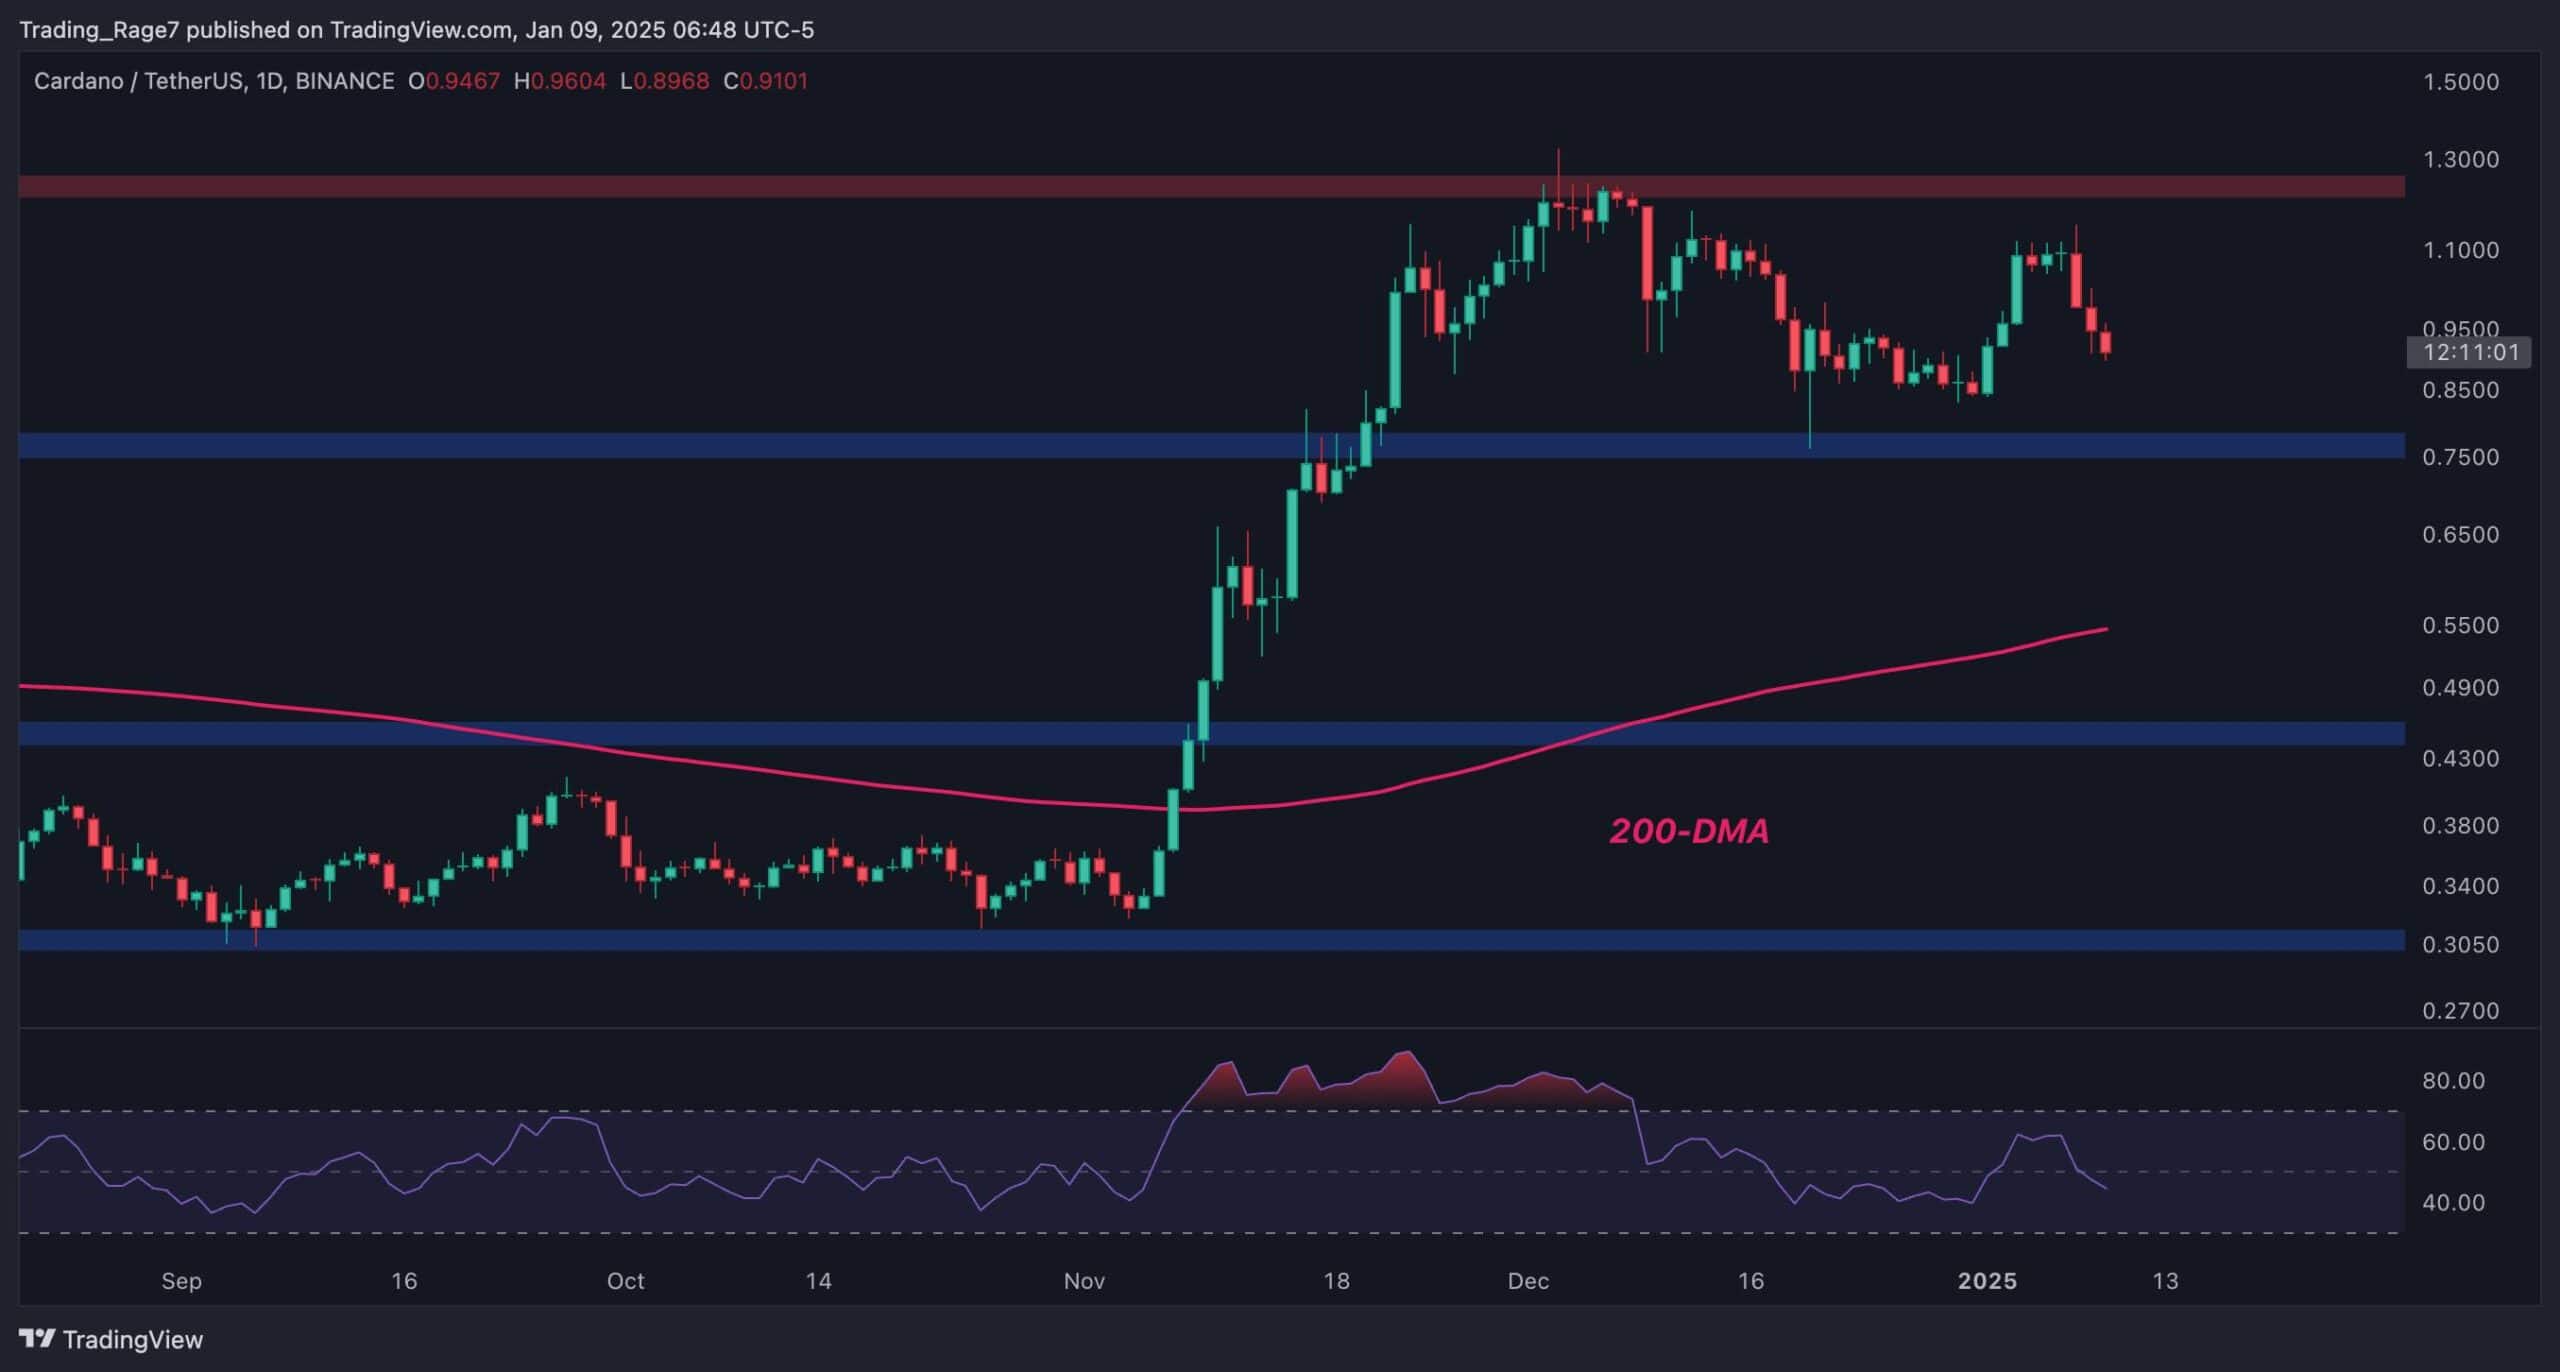
Cardano has been moving similarly to Bitcoin over the last few months and is currently consolidating around the $1 mark.
Yet, if BTC corrects in the coming weeks, ADA will likely perform even worse.
By Edris Derakhshi (TradingRage)
The USDT Paired Chart
On the USDT paired chart, the asset has been consolidating around the $1 mark after getting rejected by the $1.3 resistance level earlier.
At the moment, the price is once again dropping toward the $0.75 support level and could break it to the downside and target the 200-day moving average, which is located around the $0.55 mark.
The BTC Paired Chart
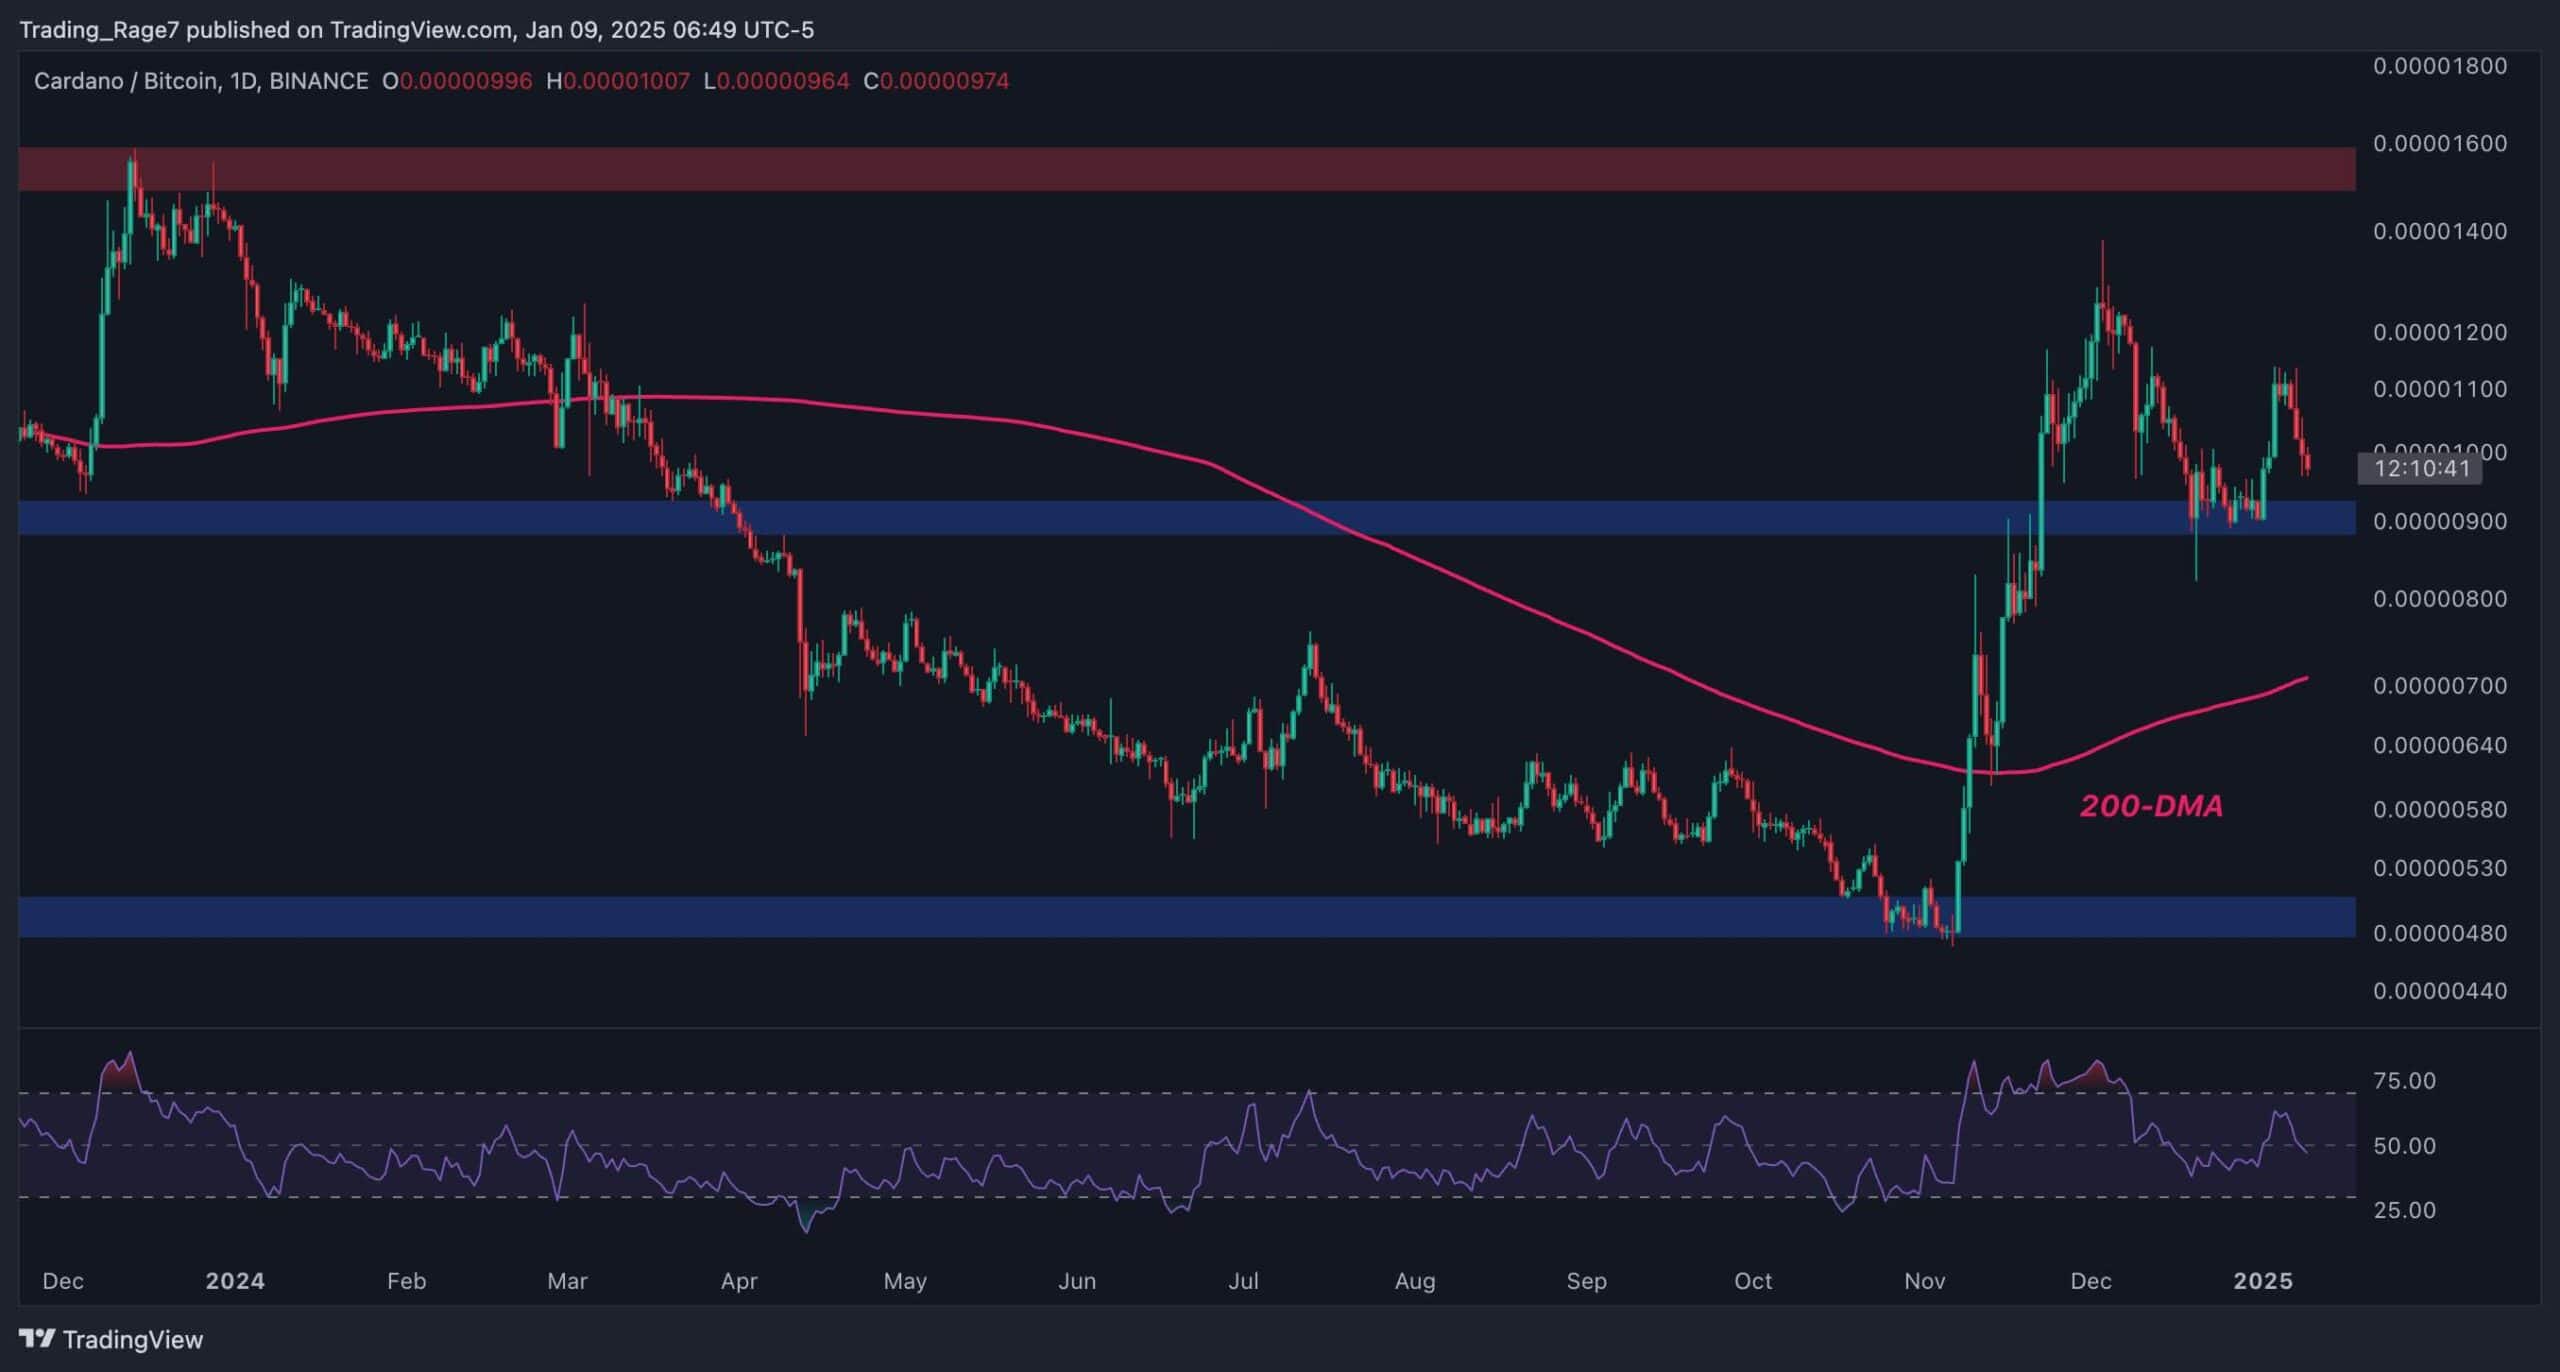
The ADA/BTC chart presents a similar picture, as the price has been consolidating for a couple of months. However, if the 900 SAT level breaks down to the downside, further decline toward the 200-day moving average, located around the 700 SAT mark, and even lower could be expected.
Therefore, if the overall trend of the crypto market and Bitcoin remains bearish in the short term, ADA is likely to enter a chopping downward phase.
The post ADA Risks Dumping to $0.55 After Losing $1 Support: Cardano Price Analysis appeared first on CryptoPotato.

 10 hours ago
10


 English (US) ·