
 3 hours ago
13
3 hours ago
13

AeroVironment, Inc. stock delivered the kind of session that demands attention. On 7 August, AVAV opened at $172.70 and closed at $186.73, printing an $18.76 range on 1.9 million shares. The move is real, but context matters more than the candle.
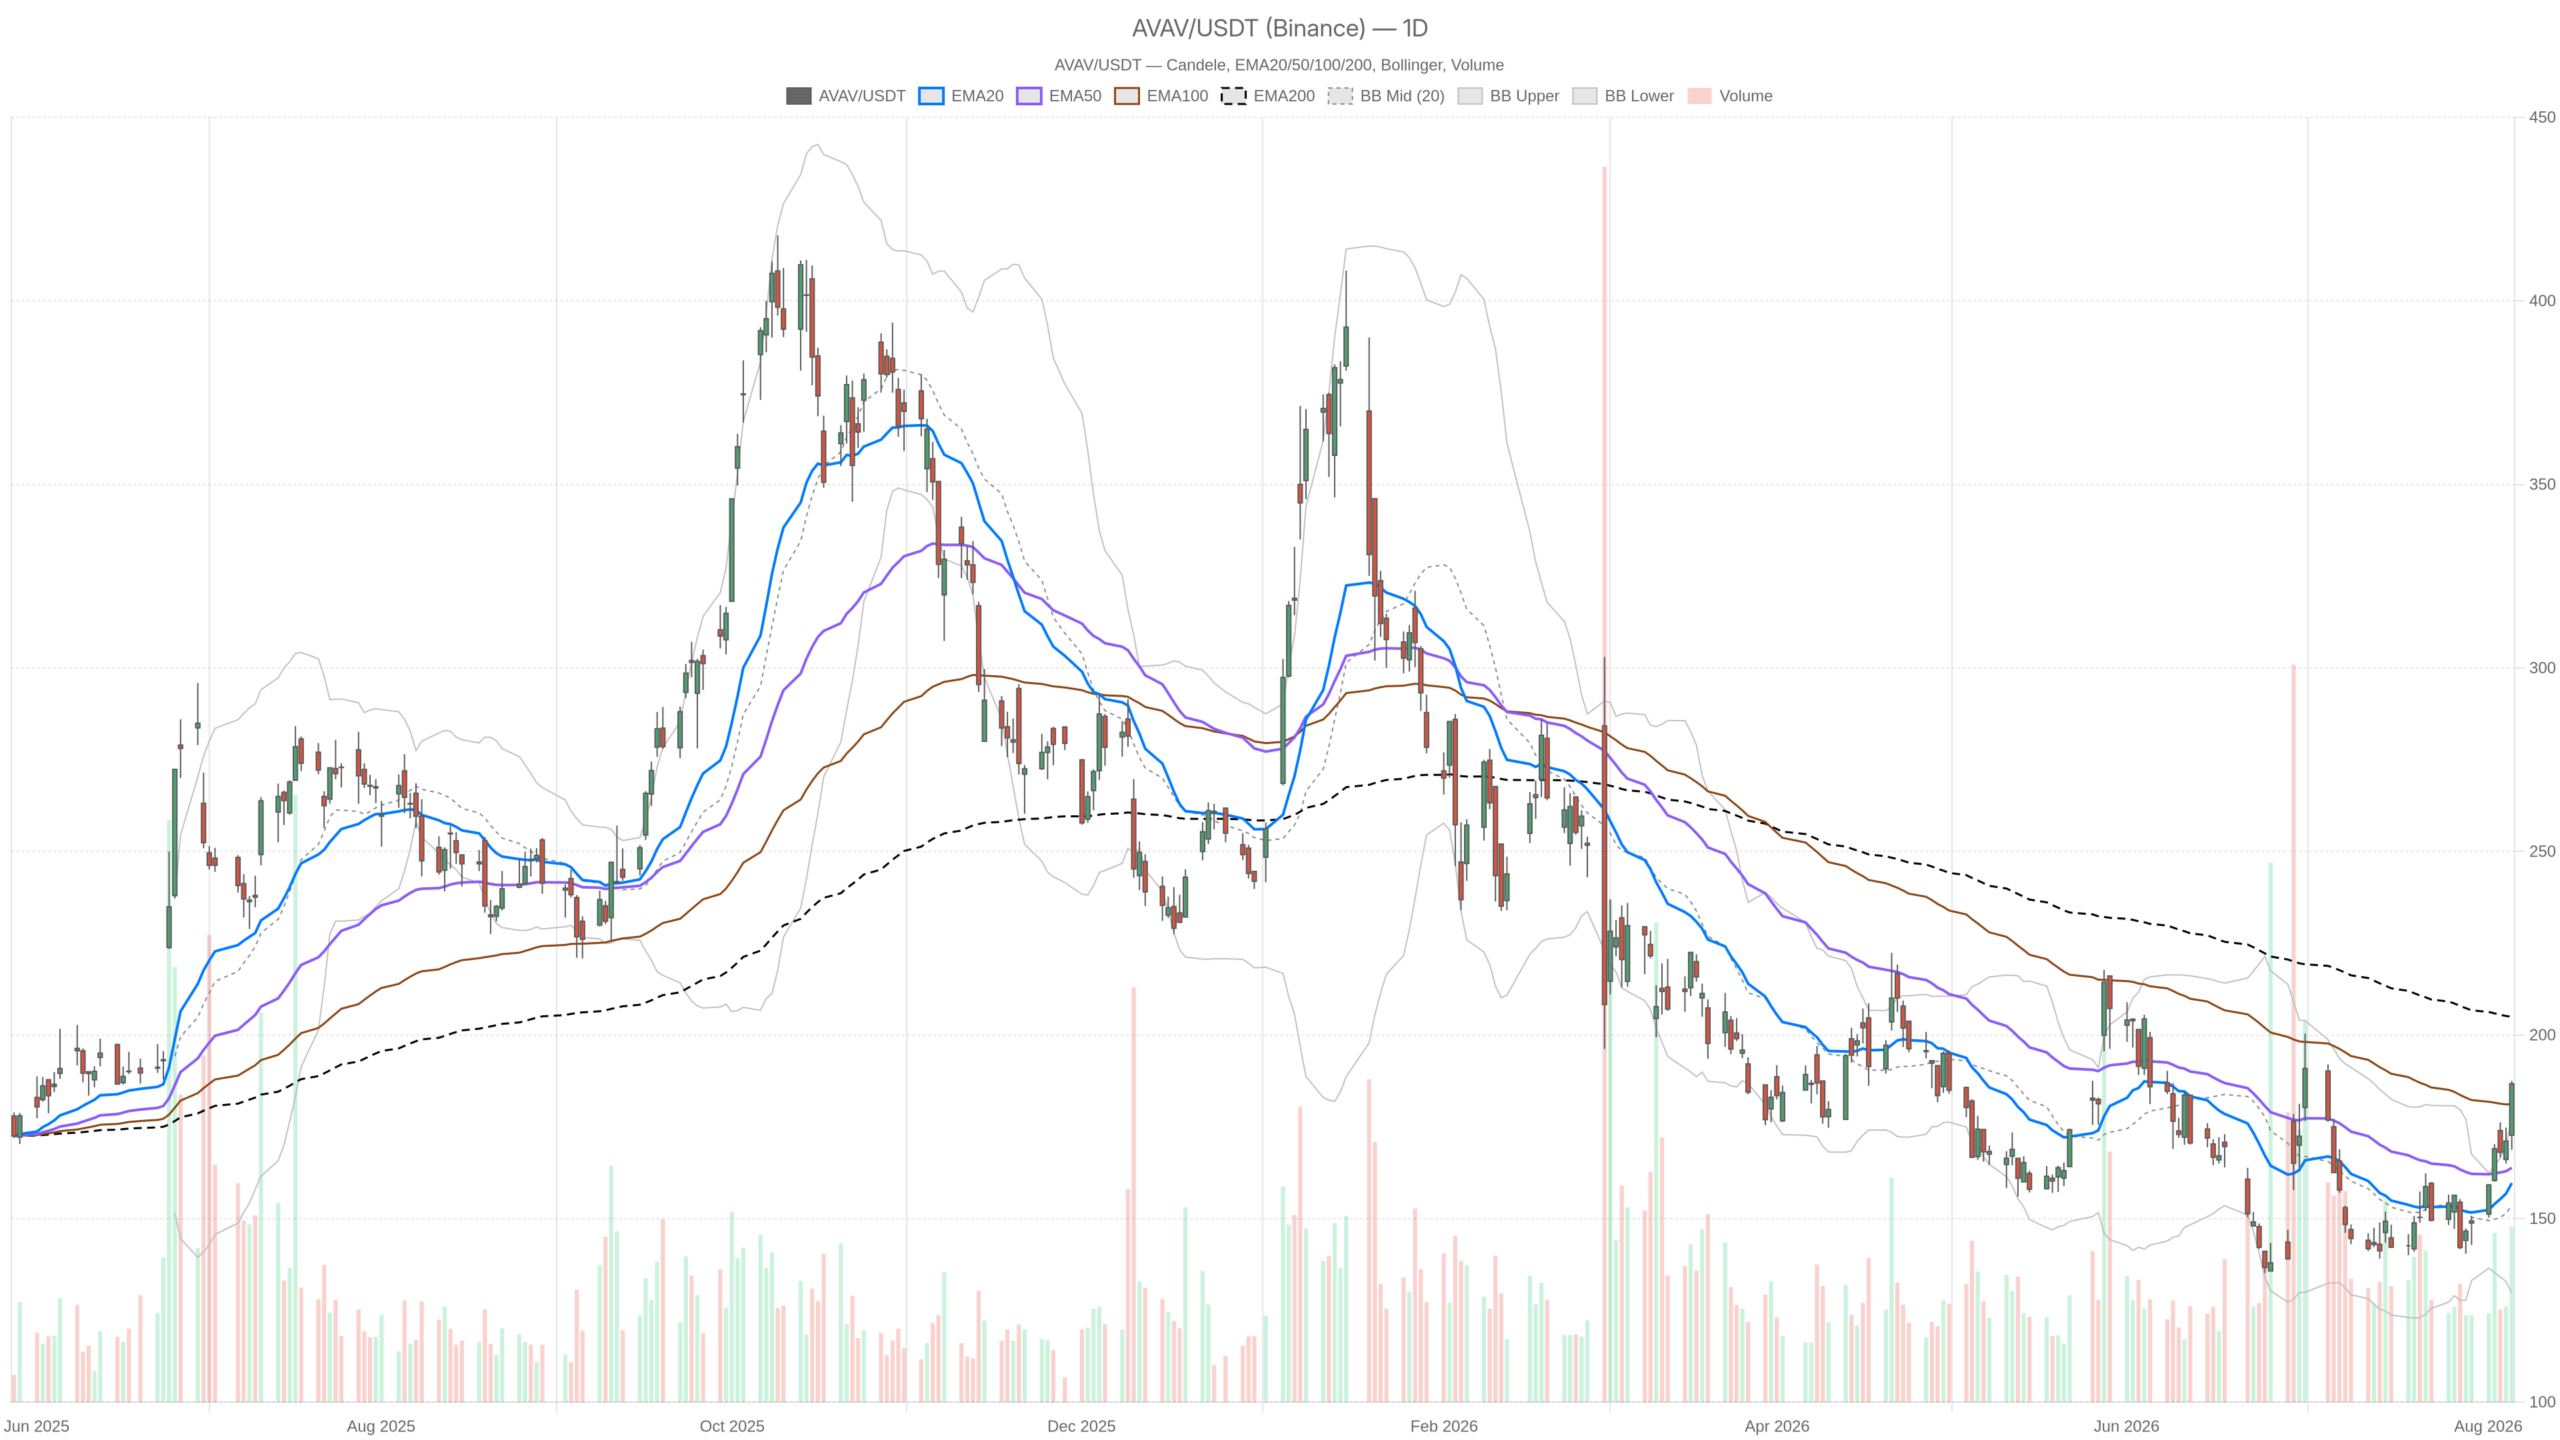 AVAV — daily chart with candlesticks, EMA20/EMA50 and volume.
Key takeaways
- AVAV closed at $186.73 on 7 August after an $18.76 intraday range on 1.9 million shares.
- The 200-day EMA at $205 remains far overhead, keeping the trend in recovery mode rather than confirmed reversal.
- Daily MACD has flipped aggressively with a histogram of 4.40, while RSI at 65.32 still has room before overbought conditions.
- Hourly RSI at 84.69 signals deep overbought territory, raising mean-reversion risk on shorter timeframes.
- Critical levels: bullish targets at $188.43 and $193.24; bearish invalidation below daily support at $174.48.
Why the daily chart keeps AeroVironment, Inc. stock in recovery mode
The daily chart keeps AeroVironment, Inc. stock in recovery mode because the 200-day EMA at $205 remains far above price and the system classifies the daily regime as neutral. Despite an aggressive momentum shift, this is a bounce inside a damaged trend, not a confirmed reversal.
Momentum indicators signal a genuine shift
Momentum has clearly flipped on the higher timeframe. Daily MACD shows the line at 3.44 against a signal still buried at -0.95, with a histogram of 4.40. That is an aggressive crossover, not a marginal one. Buyers have taken control of the medium-term momentum picture. The width of the histogram argues the shift is more than noise.
Daily RSI at 65.32 supports that read without screaming exhaustion. Technically, there is still room before the classic overbought zone. Meanwhile, the volatility picture is more demanding. The daily close at $186.73 sits above the upper Bollinger band at $177.33, with the mid-band at $153.54. Closing outside the band signals force, but it is also a statistical stretch. Moves like this usually demand consolidation or a pullback before the next leg.
Volatility and pivot levels define near-term risk
At the same time, daily ATR of $10.51 frames the risk. Roughly ten dollars of average daily movement means stops placed close to price will be triggered by ordinary noise. Therefore, position size, not conviction, becomes the deciding variable here.
Notably, the daily pivot map gives clean reference points. The pivot sits at $180.99, with resistance at $193.24 and support at $174.48. Price closed above the pivot, which keeps the near-term bias constructive. The $193.24 area is the first objective bulls need to attack. Meanwhile, $174.48 is the level that defines whether this breakout retains credibility.
The 1H chart confirms the push but flashes a warning
The 1H chart confirms the bullish push with a textbook EMA stack, but it also flashes a clear warning. Hourly RSI at 84.69 sits deep in overbought territory, making late entries carry poor risk-reward.
On the hourly timeframe the regime is openly bullish, and the EMA stack is textbook. The 20-period EMA at $174.37 sits above the 50 at $166.16, which sits above the 200 at $159.36. Price at $186.60 is above all three. That is trend alignment, and it confirms the daily momentum shift rather than contradicting it.
However, the hourly RSI at 84.69 is a genuine caution flag. That is deep overbought territory. It does not automatically mean reversal, especially in a strong impulse, but it does mean late entries carry poor risk-reward. Hourly MACD remains positive at 5.44 with a signal of 4.54. Still, the histogram of only 0.90 hints the acceleration is beginning to flatten.
Bollinger data on the 1H reinforces the same idea. The upper band sits at $184.33 and price is trading above it, with the mid-band at $173.51. Hourly ATR of $3.89 tells us how quickly a mean-reversion snap could travel. Hourly pivots are tight: pivot $185.67, resistance $188.43, support $183.85. Those levels are the immediate battleground.
15m execution context for AVAV
The 15-minute chart, where execution timing lives, still points higher. All three EMAs are stacked in order beneath price, and momentum remains intact, though narrowing.
The 15-minute chart is where timing lives, and it is still pointing higher. EMA20 at $180.01, EMA50 at $175.75 and EMA200 at $165.35 are stacked in order beneath price. RSI at 75.81 is overbought but less extreme than the hourly reading. MACD at 3.11 against a 2.55 signal, with a 0.55 histogram, shows momentum intact yet narrowing.
Meanwhile, the intraday close of $186.60 sits just above the 15-minute upper band at $186.56, with the mid-band at $179.49. ATR of $2.31 defines realistic intraday swing distance. The short-term pivot is $185.89, with resistance at $188.21 and support at $184.29. Holding above $184.29 keeps the intraday tape in the bulls’ hands. Losing $179.49 would be the first sign the impulse is unwinding.
Bullish scenario
The bullish case requires acceptance above hourly resistance at $188.43, followed by a push toward daily resistance at $193.24. A defended pullback producing higher lows would strengthen the case considerably.
The constructive case is straightforward. Bulls need acceptance above the hourly resistance at $188.43, then a push toward the daily resistance at $193.24. A defended pullback into $180.99 or $174.48 that produces higher lows would strengthen the case considerably. Ideally, the daily MACD histogram stays expanded while RSI cools without breaking down.
Fundamentally, the narrative backdrop is not fighting the chart. Recent coverage has framed AeroVironment as a beneficiary of surging drone demand and a robust defense budget environment. One Seeking Alpha piece called it the most misunderstood drone stock. That kind of framing helps sustain repricing after a violent decline.
Bearish scenario
The bearish case rests on a powerful structural argument: the 200-day EMA at $205 remains far above price, keeping this rally as a rebound within a broader downtrend.
On the other hand, the bearish case has a powerful structural argument. The 200-day EMA at $205 remains far above price, and until that changes, this rally is a rebound within a broader downtrend. The scale of the prior damage is not trivial. Coverage from early August noted the stock had dropped 45.5% since January 2026, to $147.13 per share. Recoveries from that kind of drawdown often stall at resistance.
Practically, a loss of the daily support at $174.48 would undermine the breakout narrative. A daily close back inside the Bollinger band, toward the $153.54 mid-line, would signal the stretch has been resolved to the downside. In contrast to the current picture, that would also drag price back below the 50-day EMA at $163.83, restoring seller control.
Positioning and volatility
This is a bullish short-term tape sitting inside a still-unproven daily recovery. All three timeframes point up, yet all three are extended beyond their upper Bollinger bands, making entry location the primary risk.
Overall, this is a bullish short-term tape sitting inside a still-unproven daily recovery. All three timeframes point up, yet all three are extended beyond their upper Bollinger bands. Therefore the risk is not direction, it is entry location. With daily ATR above $10 and hourly RSI near 85, volatility is elevated and mean-reversion risk is live.
The levels that matter are $188.43 and $193.24 above, $174.48 and $153.54 below. Until $205 comes into play, the burden of proof still rests with the buyers.
FAQ
Is AeroVironment, Inc. stock in a confirmed uptrend?
No. Despite the strong rally on 7 August, the 200-day EMA at $205 remains far above the current price. The daily regime is classified as neutral by the system. This is a recovery within a damaged trend, not a confirmed reversal.
What are the most important resistance levels for AVAV?
The immediate hourly resistance sits at $188.43, with the next daily objective at $193.24. The major structural barrier is the 200-day EMA at $205. Until that level is challenged, the broader trend remains unproven.
What support levels should traders watch?
Daily support at $174.48 is the level that defines whether the breakout retains credibility. Below that, the mid-Bollinger band at $153.54 and the 50-day EMA at $163.83 become the next areas of interest.
How extended is AVAV after the 7 August surge?
All three timeframes show price trading above their upper Bollinger bands. Hourly RSI has reached 84.69, deep in overbought territory. Daily RSI at 65.32 still has room. With daily ATR at $10.51, mean-reversion risk is elevated.
Disclaimer: This article is for informational purposes only and does not constitute financial advice, an investment recommendation, or a solicitation to buy or sell any financial instrument or cryptocurrency. The analysis provided is not indicative of future results. Investing in crypto assets and financial markets carries a high risk of capital loss. Always do your own research (DYOR) and consult a qualified financial advisor before making any decision.
Article produced with the assistance of artificial intelligence and reviewed by the editorial team.









 English (US) ·