
 3 months ago
71
3 months ago
71
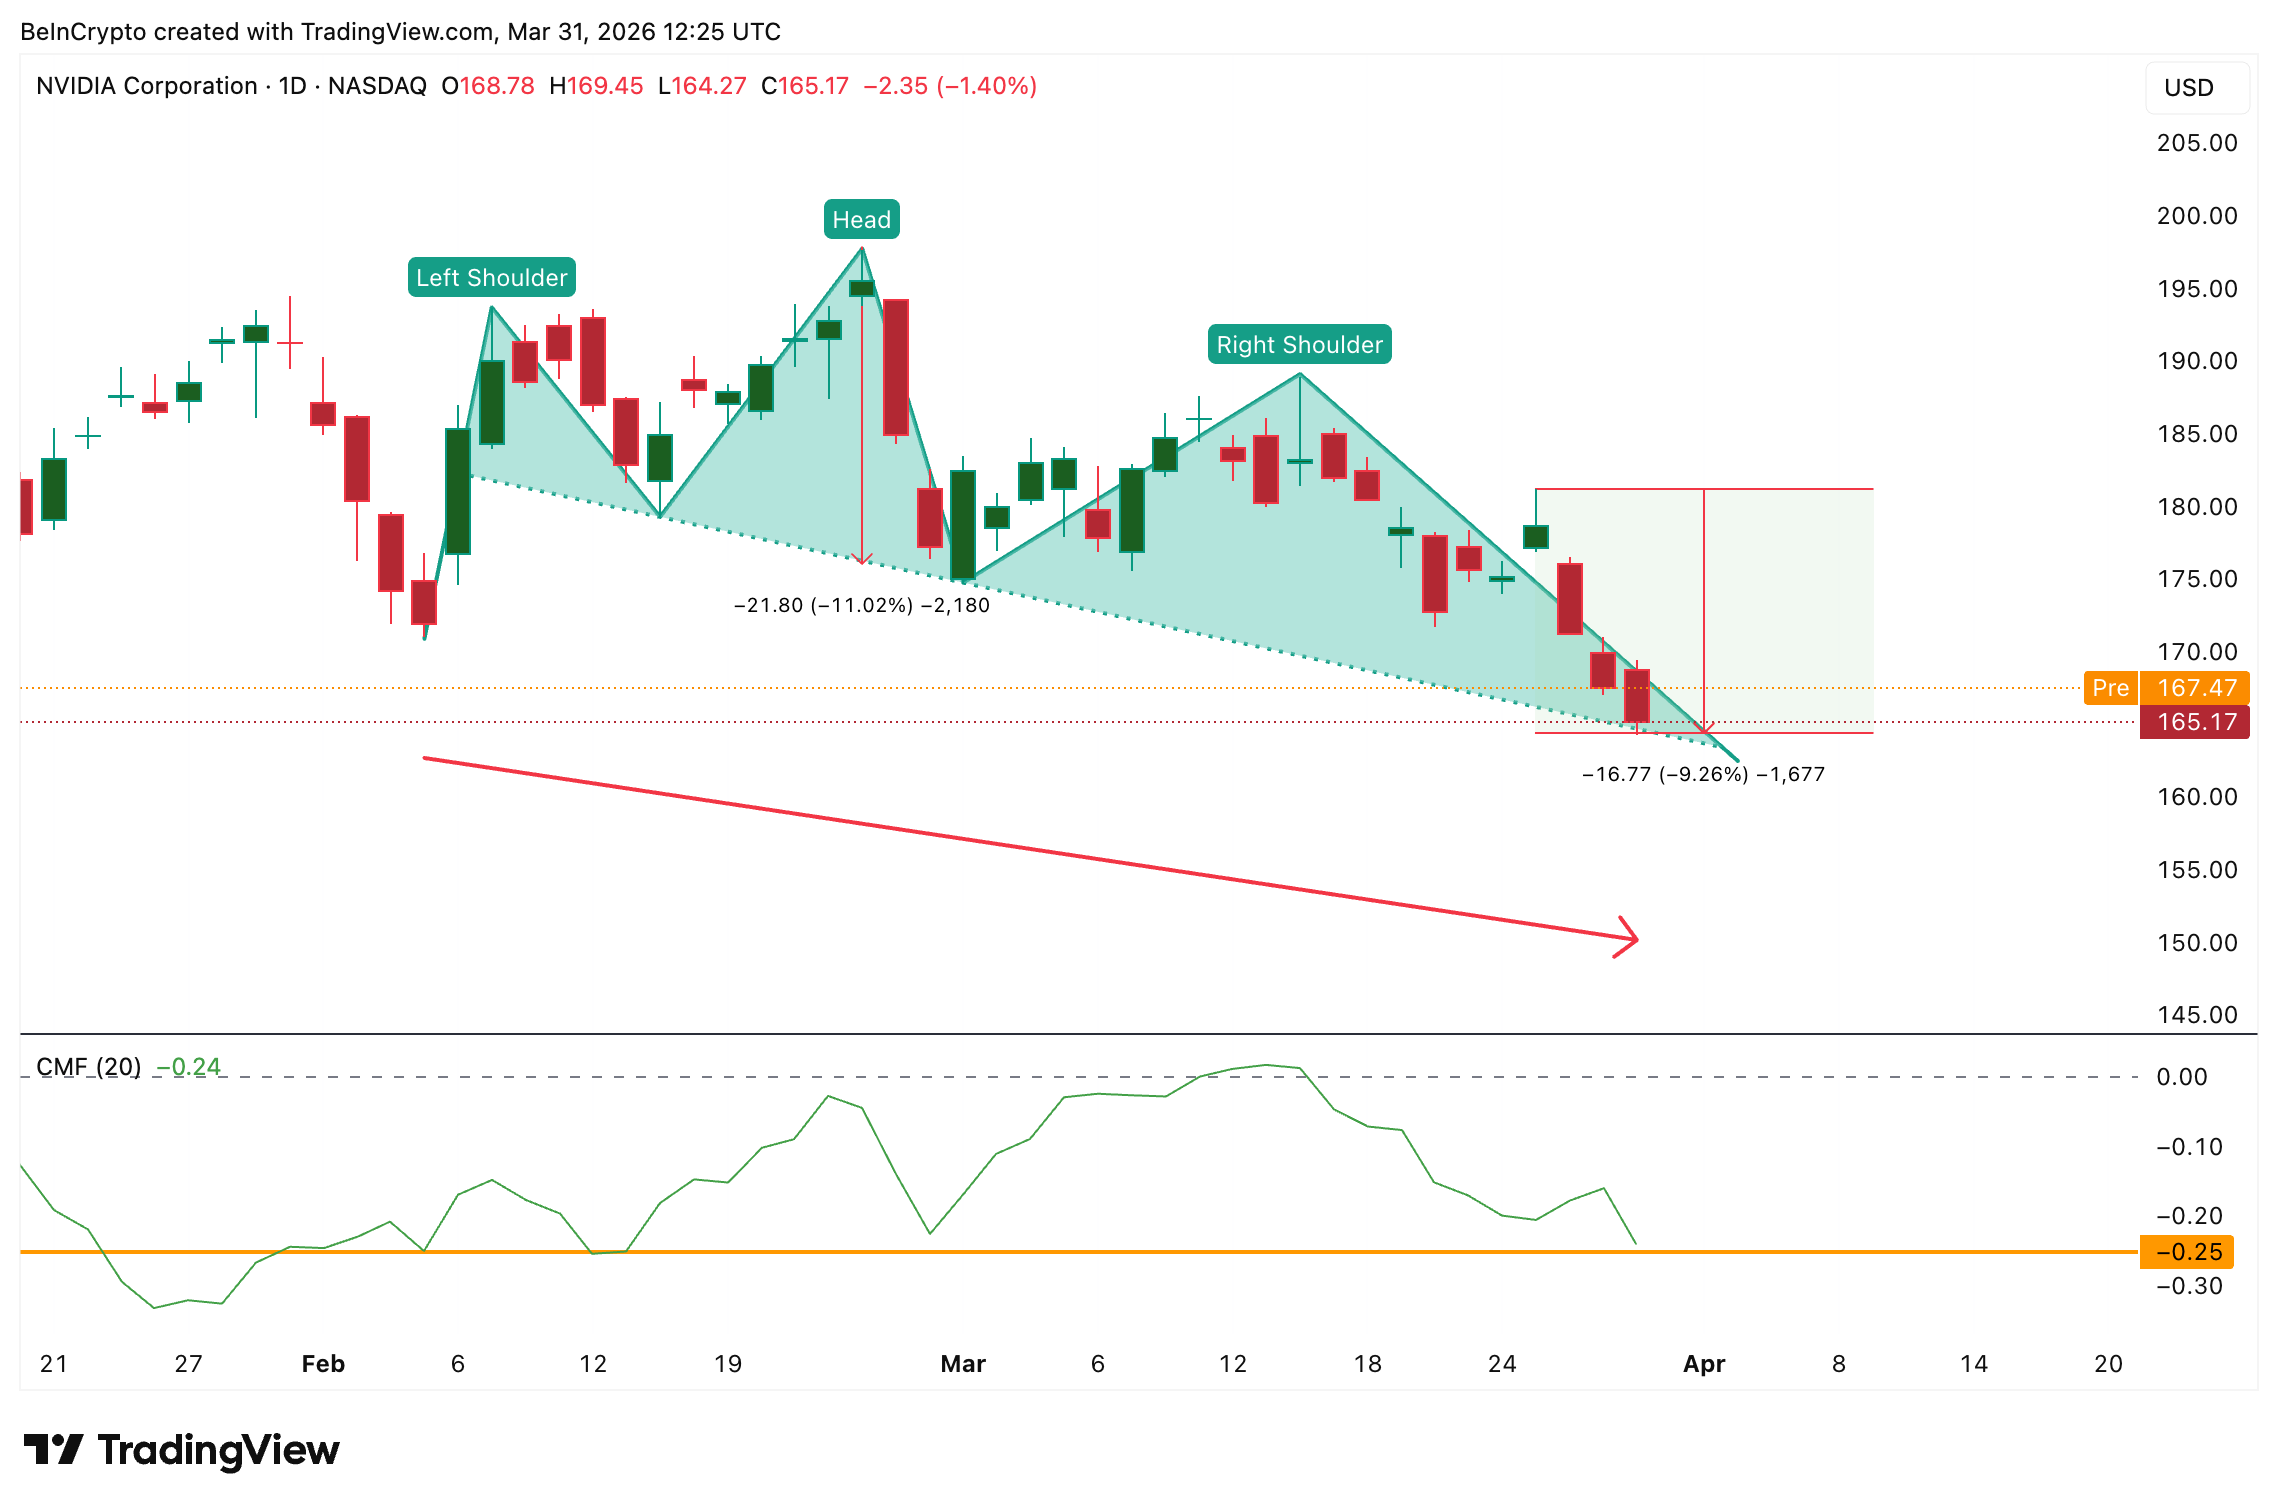
Nvidia (NVDA) stock closed above $165 on March 30, down over 9% since March 25. It now sits directly on the neckline of a head-and-shoulders pattern that projects an 11% measured breakdown if it fails.
The decline has brought Nvidia stock to its most critical technical test since early 2026. Now, the daily chart, institutional flow data, and options positioning are all pointing in different directions.
AI Memory Sell-Off Pushes Nvidia to the Neckline
The catalyst behind the 9% NVDA price decline traces back to March 24. This is when Google announced TurboQuant, a memory compression algorithm that reduces AI model memory requirements by 6x without sacrificing performance.
The announcement triggered a sharp sell-off across AI memory manufacturers. Micron dropped roughly 20%, and SanDisk fell approximately 18% in the days that followed.
Reports that OpenAI is scaling back data center spending compounded the pressure. OpenAI’s October 2025 deal to secure 40% of global DRAM supply had been a key pillar of the memory shortage thesis. Any pullback from that commitment weakens the demand outlook for high-bandwidth memory, which feeds directly into Nvidia’s GPU production pipeline.
The combination dragged the NVDA stock price to $165 by March 30.
The daily chart shows the damage in structural terms. The AI memory rout nearly pushed the NVDA stock beyond the head-and-shoulders neckline. If the neckline breaks, the NVDA stock price might end up correcting by another 11%, per target projections. The sloping-down neckline makes a clean breakdown harder to trigger because the price must keep falling to reach it, but NVDA is now inches away.
The Chaikin Money Flow (CMF) indicator, a proxy for institutional buying and selling pressure, adds nuance. CMF attempted to cross above zero between March 10 and 16. This signalled a brief return of institutional buying interest, but failed and has since declined to -0.24.
Yet, between February 5 and March 30, as the stock prices trended lower, the CMF still managed to hold higher.
 Head and Shoulders Analysis: TradingView
That reading sits just above the -0.25. If CMF breaks below -0.25, it would confirm institutional sellers are driving the move, and the neckline breakdown becomes significantly more likely.
Put-Call Ratio Shows Options Traders Buying Into the Dip
While the price chart and money flow data point to weakness, the Nvidia put-call ratio tells a contrarian story. On March 25, when the sell-off started, the put-call volume ratio stood at 0.89, nearly balanced between bearish puts and bullish calls.
By March 30, the volume ratio had dropped 16.8% to 0.74, meaning call volume (bullish bets) expanded significantly relative to put volume as prices fell. The broader market might be looking at the bullish targets for NVDA, as proposed by Wall Street Analysts.
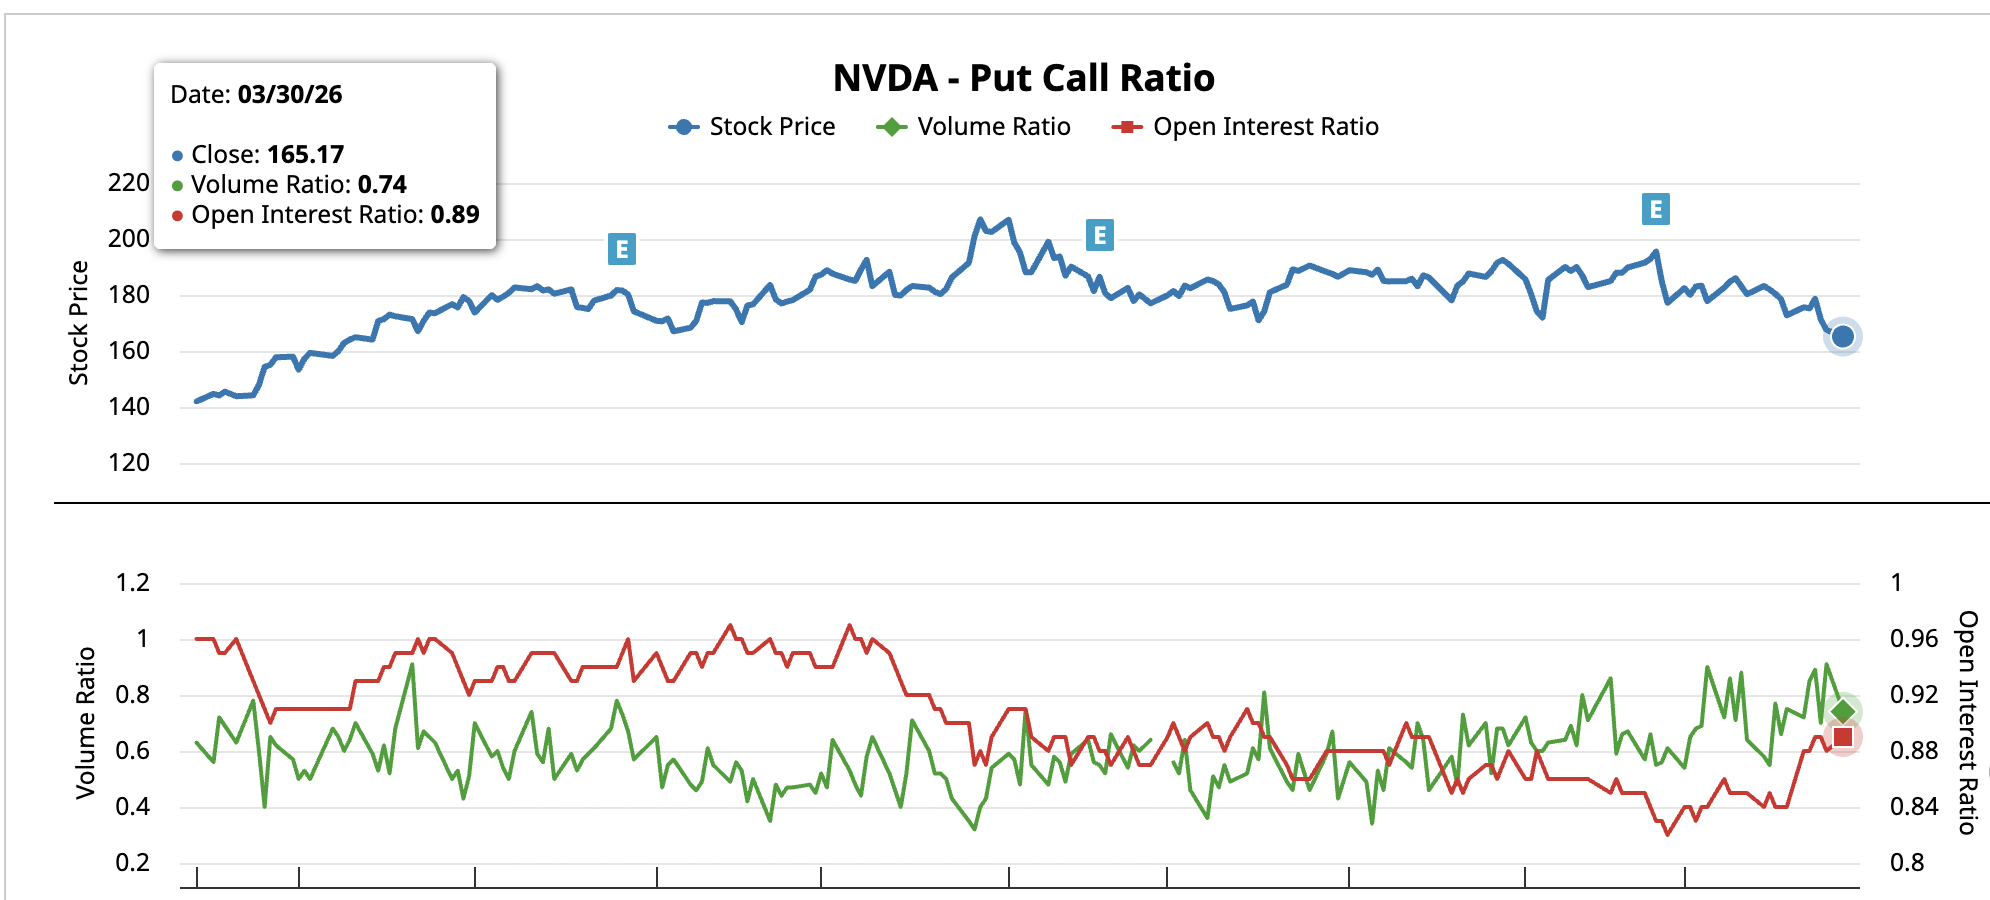 Nvidia Put-Call Ratio: Barchart
UBS analyst Timothy Arcuri reiterated a Buy rating on Nvidia shares with a $245 price target on March 20, implying 48% upside. That call, issued five days before the AI memory rout began, prices in continued demand driven by Rubin GPU shipments and treats the memory supply disruption as a short-term headwind rather than a structural shift.
 NVDA Bullish Call: TipRanks
A volume ratio below 0.80 on a stock that just dropped over 9% in five sessions is unusual. It signals that options traders are using the decline to build bullish positions rather than hedging for further downside.
Want more insights like this? Sign up for Editor Harsh Notariya’s Daily Crypto Newsletter here.
The open interest ratio, which reflects longer-duration positioning, held at 0.89, meaning the existing put-heavy book from earlier in the sell-off remains intact. New activity skews bullish, but the older short base has not been unwound.
That divergence between falling price and rising call activity aligns with UBS’s institutional view and creates a setup where a confirmed bounce off the neckline could trigger a short squeeze in the options market. However, if the neckline breaks, call buyers would face rapid losses, and the unwinding could accelerate the move toward the deeper price targets.
Key Nvidia Stock Price Levels to Watch
The Nvidia stock price now trades below all four major exponential moving averages (EMAs). Exponential moving averages (EMAs) are trend indicators that weight recent prices more heavily to identify directional momentum.
The 20-day EMA sits at $177, the 50-day and 100-day EMAs at $181, and the 200-day at $174. The bearish crossover between the 50-day and 100-day EMA completed during the final week of March, adding a long-term headwind. That headwind seems to have played its part in leading the NVDA price correction.
The key technical levels place the 0.618 level at $174, which closely aligns with the 200-day EMA. That $173-$174 zone becomes the critical reclaim target. A move back above $165 neutralizes the immediate neckline threat, while a reclaim of $174 would place the price above the 200-day EMA and open the path toward $183 and $188. Beyond $188, the UBS analyst’s price target could start looking practical.
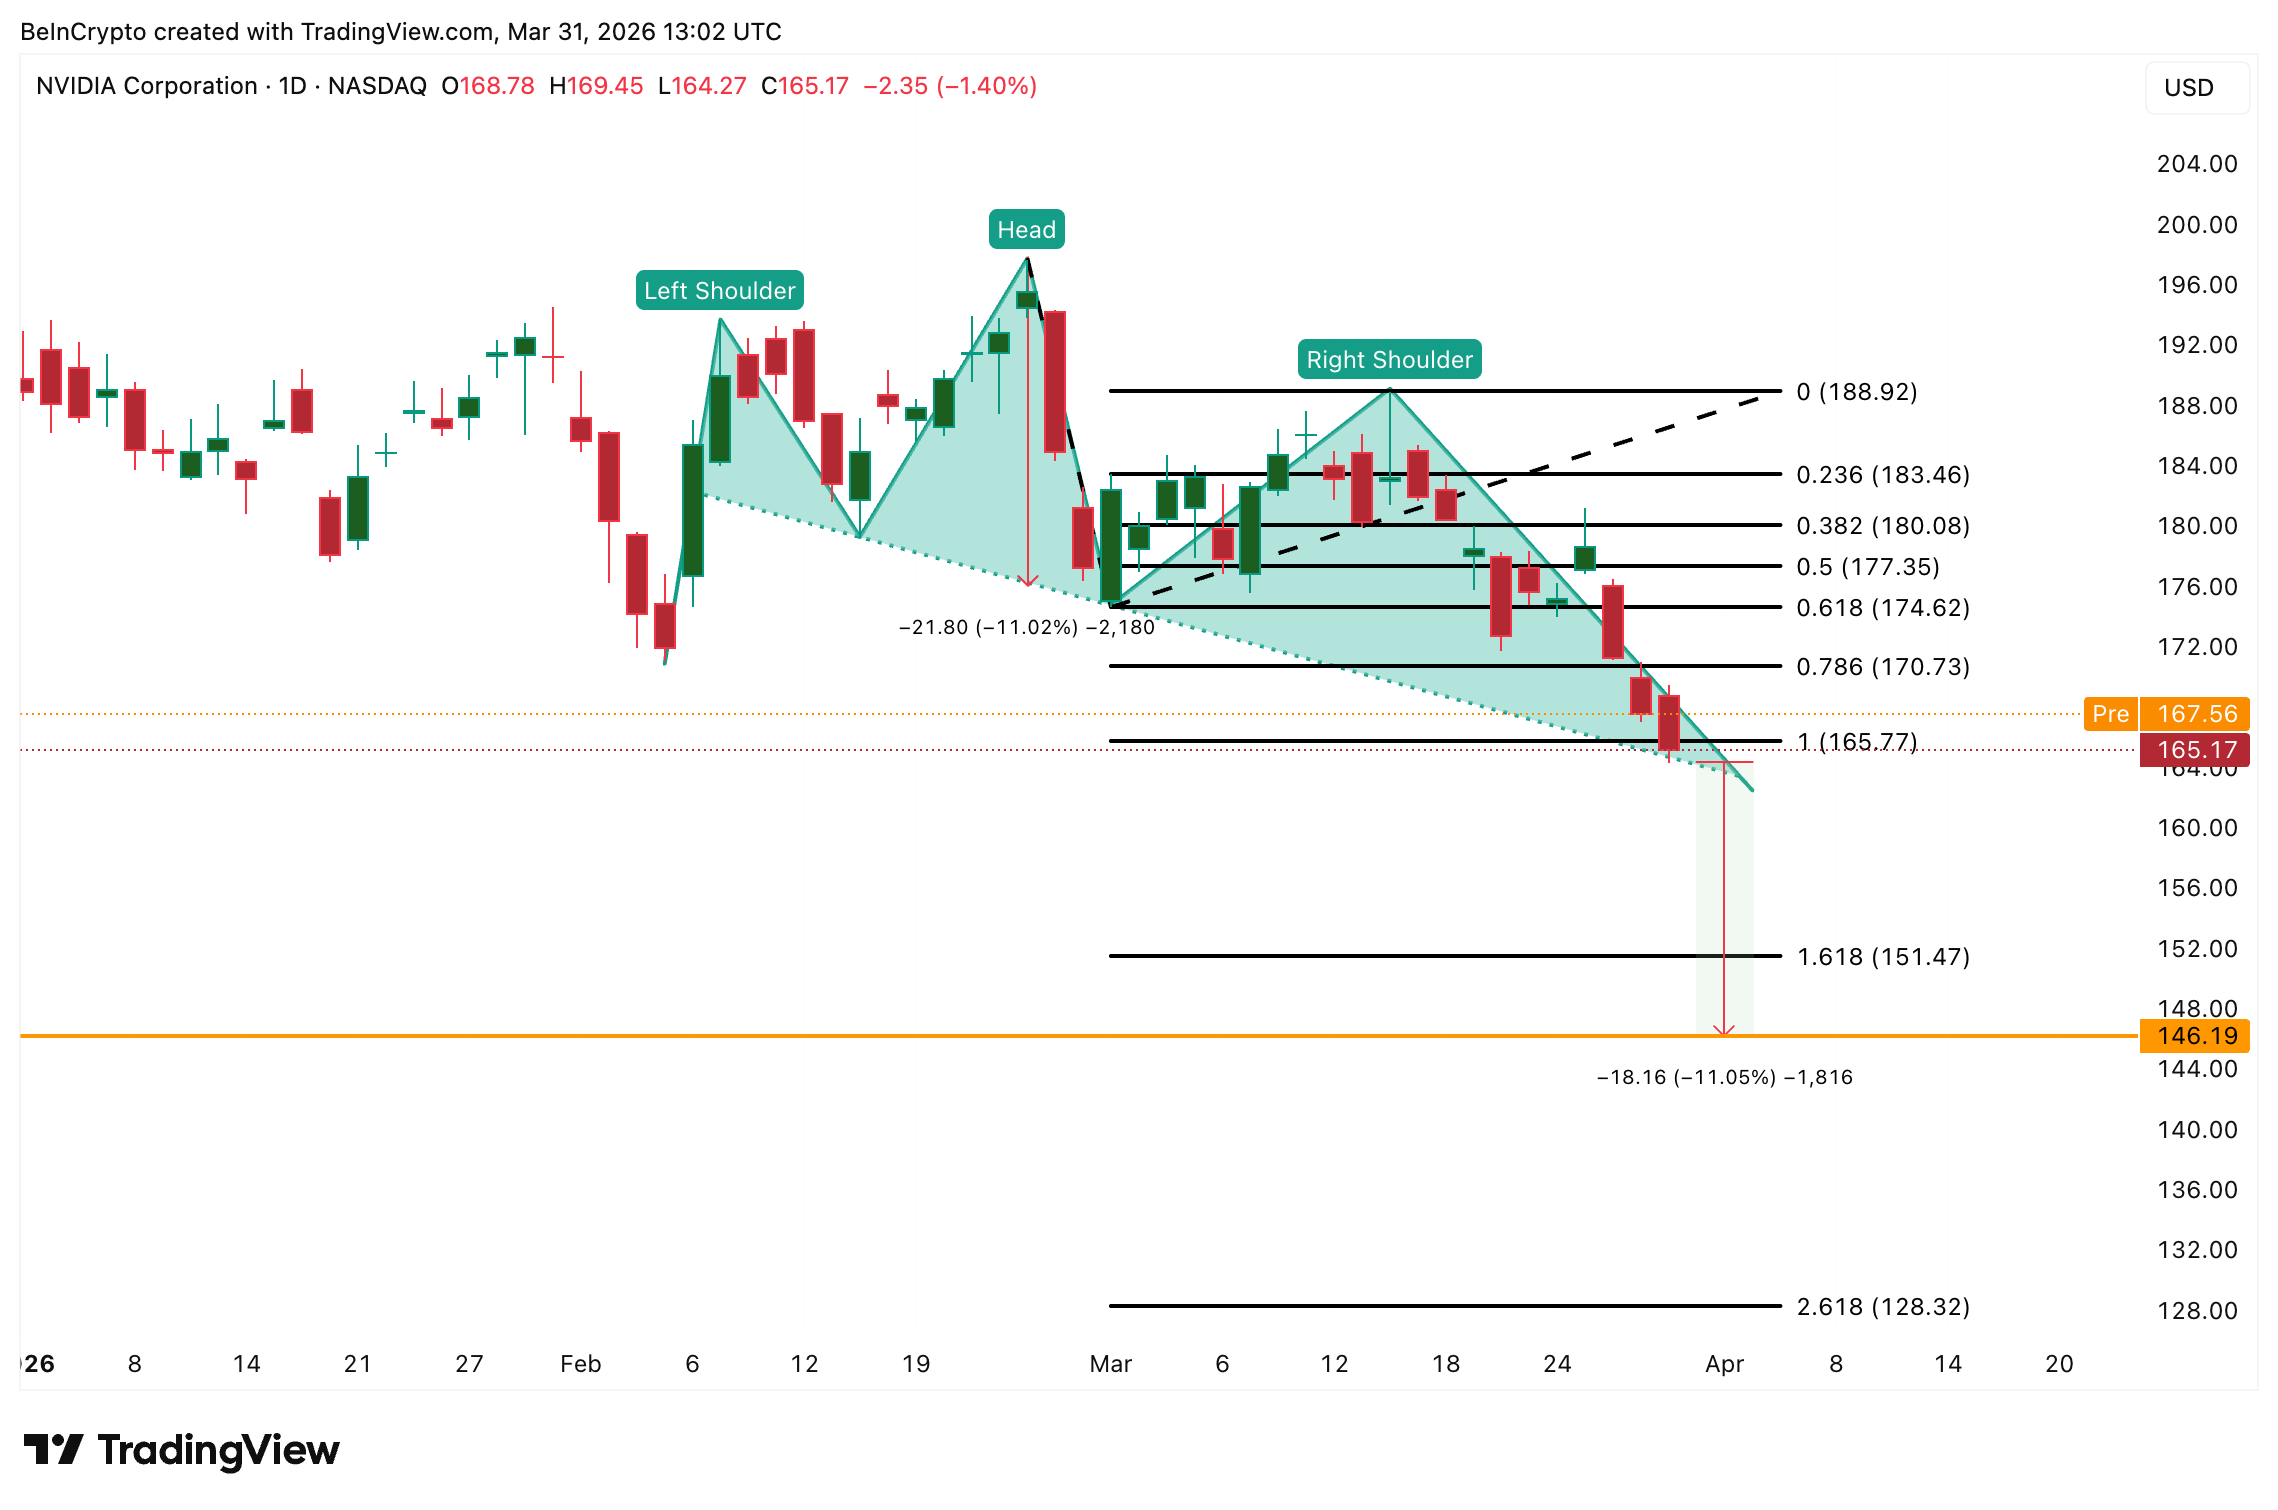 Nvidia Price Analysis: TradingView
A daily close above $174 targets $183 and weakens the breakdown thesis. A failure to reclaim $165 in the subsequent trading sessions confirms the head-and-shoulders and exposes an 11% measured move toward $146.
The post AI Memory Rout Wipes 9% Off Nvidia Stock: Chart Says More Pain Ahead appeared first on BeInCrypto.


 English (US) ·