
 1 month ago
54
1 month ago
54
Alcoa Corporation stock is navigating a technically stressed phase. As of July 16, AA closed at $46.85, trading below every major daily moving average. The bias is bearish, but an unusually depressed RSI suggests the stock may be approaching downside exhaustion, even without a reversal catalyst.
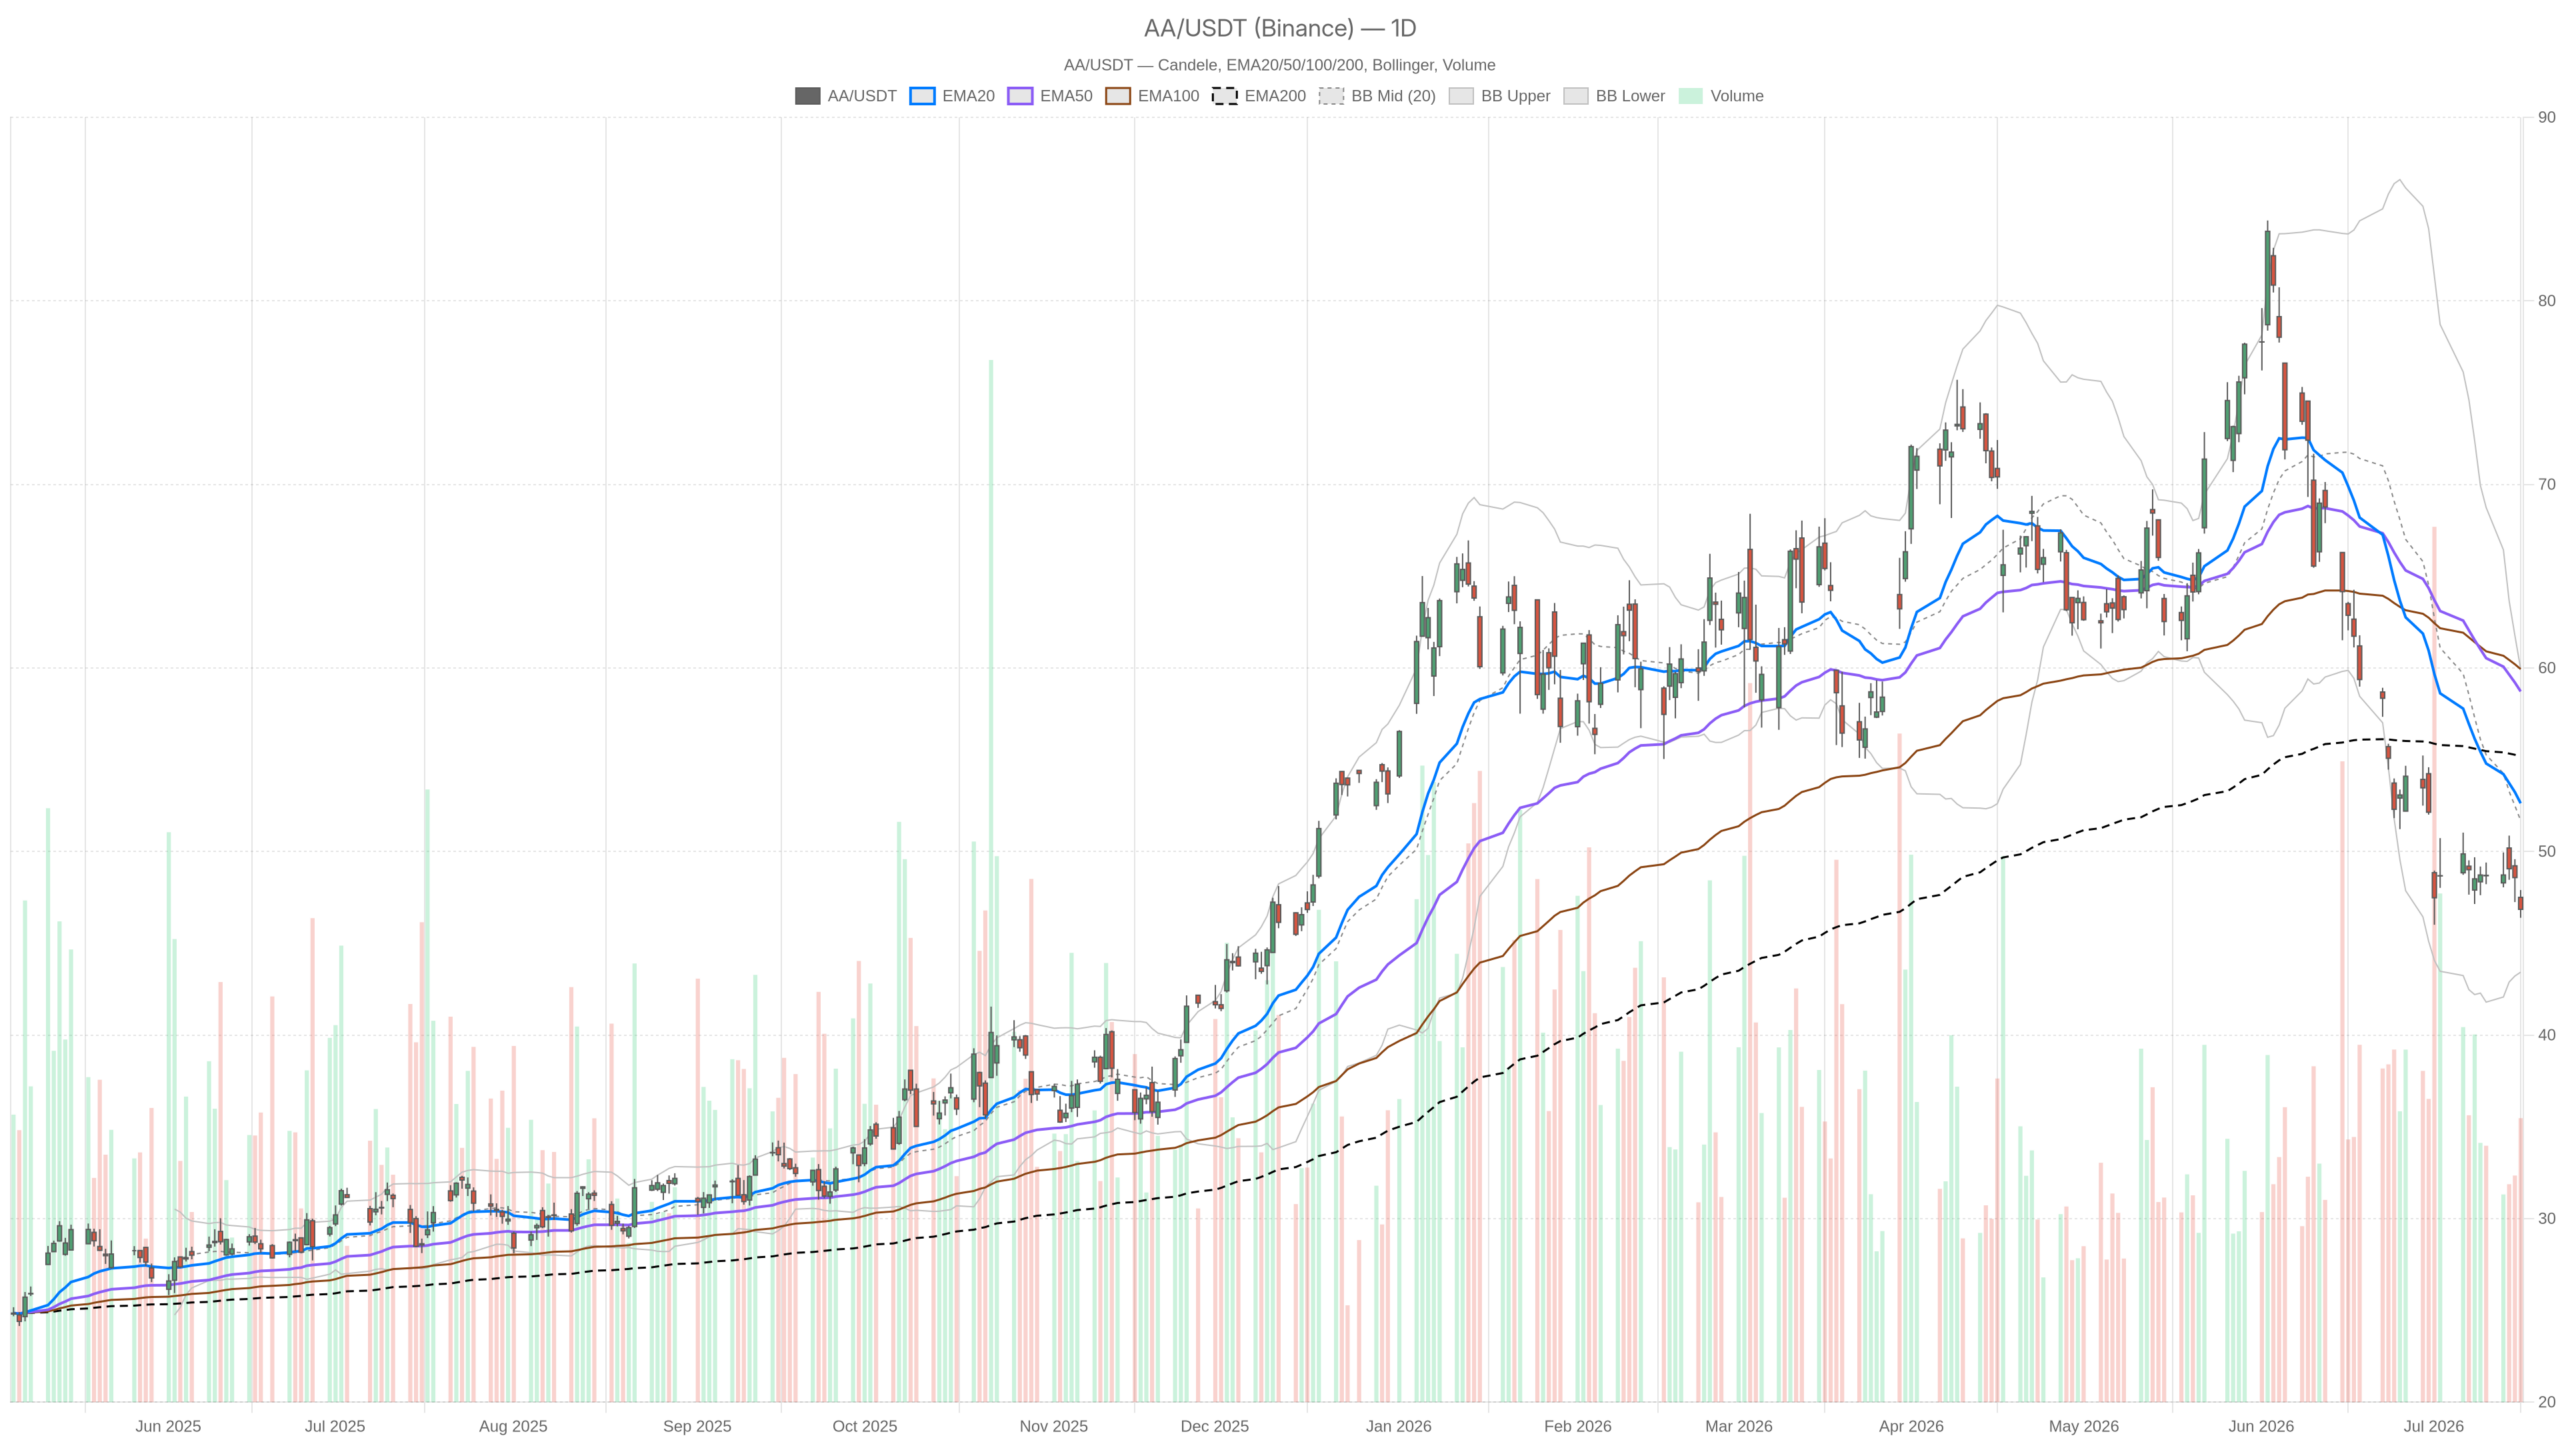 AA — daily chart with candlesticks, EMA20/EMA50 and volume.
Key takeaways
- AA closed at $46.85 on July 16, below all three major daily EMAs: EMA20 at $52.63, EMA50 at $58.72, and EMA200 at $55.19
- Daily RSI14 sits at 28.49, firmly in oversold territory
- Daily MACD histogram turned slightly positive at 0.19, hinting at slowing downside momentum
- Hourly regime remains explicitly bearish with H1 RSI at 38.48, leaving room for further downside
- Q2 earnings serve as a binary catalyst — a strong beat could trigger short-covering from deeply oversold levels
Daily Timeframe: Alcoa Corporation Stock Deep in Oversold Territory
Alcoa Corporation stock sits deep in oversold territory on the daily chart, but the trend remains decisively bearish. Price at $46.85 trades beneath all three major EMAs, confirming a structural downtrend rather than a temporary pullback.
EMA Configuration and Oversold RSI
The daily EMA stack shows EMA20 at $52.63, EMA50 at $58.72, and EMA200 at $55.19. All three averages are layered above current price. This configuration signals a trend that has been deteriorating consistently over time, not just in recent sessions.
Meanwhile, the daily RSI14 at 28.49 is the standout figure. That reading places AA firmly in oversold territory. However, oversold conditions in a trending market are not automatic buy signals. They simply indicate that selling pressure has been intense and sustained.
Momentum Signals and Key Pivot Levels
Still, the daily MACD remains negative. The line sits at -4.55 and the signal at -4.74. Notably, the histogram has turned slightly positive at 0.19. This small but significant development suggests the rate of decline may be slowing.
At the same time, Bollinger Bands reinforce the extended downside picture. The lower band sits at $43.43, with price at $46.85 in the lower third of the band range. The midline at $51.69 represents a significant distance to recover before trend neutralization becomes realistic. The ATR14 at $2.56 reflects meaningful daily volatility.
Daily pivot analysis adds further granularity. The pivot point is $47.05, resistance at R1 sits at $47.70, and support at S1 is at $46.19. Price closed just below the pivot, keeping the bias marginally negative. A reclaim of $47.05 on a closing basis would be the first structural signal worth watching.
Hourly Context: Bearish Regime Confirms Daily Weakness
The hourly chart confirms the bearish regime seen on the daily timeframe. Price at $46.86 trades below the EMA20 at $47.70, the EMA50 at $48.47, and far beneath the EMA200 at $55.15.
The H1 RSI14 at 38.48 is weak but not yet oversold. This distinction matters. It suggests there is still room for further downside before any short-term bounce becomes technically obligatory.
The H1 MACD histogram is negative at -0.13. The line at -0.49 remains below the signal at -0.36. Therefore, momentum continues to deteriorate at this resolution.
In contrast to the daily MACD’s small positive histogram, the hourly MACD shows active bearish divergence. This conflict between timeframes is worth noting. The daily shows very early signs of momentum deceleration. The hourly shows active selling momentum. The two readings suggest AA is not yet building a base.
The H1 Bollinger lower band at $46.22 acts as an immediate cushion. Price hovers just above it at $46.86. The hourly pivot support at $46.66 is also close. A break below both levels would expose the $46.19 daily S1 pivot. The $43.43 daily Bollinger lower band then becomes the next logical reference point.
Alcoa Corporation Stock: The Fundamental Backdrop Into Q2 Earnings
The fundamental setup for Alcoa Corporation stock heading into Q2 earnings presents a classic asymmetric positioning challenge. Technical weakness coincides with expectations of meaningful year-over-year improvement in revenues and earnings per share.
The market has been watching AA ahead of its second-quarter 2026 earnings report. Stronger aluminum demand across packaging, electrical, and transportation end markets supports the optimistic case. Additionally, the restart of key smelters in Spain, Brazil, and Norway has been cited as a positive catalyst.
However, alumina shipments have faced headwinds. This introduces a segment-level drag that tempers the overall optimism. Therefore, the setup into earnings carries binary risk.
A strong Q2 print could trigger a sharp short-covering rally from deeply oversold levels. This becomes especially likely if aluminum revenue and smelter restart benefits exceed expectations. On the other hand, any miss on alumina could validate the current technical weakness. A disappointment in the segment mix would likely push the stock toward the daily Bollinger lower band near $43.43.
Bullish Scenario: Earnings Catalyst Meets Technical Exhaustion
The bullish case for Alcoa Corporation stock rests on converging technical exhaustion and a potential fundamental catalyst. The deeply oversold daily RSI creates conditions where even moderate positive news could trigger an outsized reaction.
The daily RSI at 28.49 is at a level that historically precedes short-term bounces in individual equities. This is especially relevant when a fundamental catalyst is imminent. At the same time, the small positive shift in the daily MACD histogram hints that selling momentum could be running thin.
For this scenario to materialize, however, AA would need to reclaim the daily pivot at $47.05 on a sustained basis. Above that, the R1 at $47.70 and then the EMA20 at $52.63 become the sequence of resistance levels to clear. A strong Q2 earnings beat would be the most credible near-term trigger. Upside surprises in aluminum revenues driven by smelter restarts would be particularly impactful.
Bearish Scenario: Structure Overwhelms Oversold Signals
The bearish case remains structurally dominant despite the oversold daily RSI. Price sits below all three EMAs on both the daily and hourly timeframes, and no confirmed base formation exists on any timeframe.
Meanwhile, the regime on H1 and the 15-minute chart is explicitly bearish. The MACD on H1 is still in active negative territory. There is no confirmed pivot or base formation yet on any timeframe.
On the 15-minute chart, the EMA stack mirrors the structure seen on higher timeframes. The EMA20 at $46.97, EMA50 at $47.43, and EMA200 at $48.45 are all layered above price. The 15m MACD histogram has turned marginally positive at 0.06. Still, with RSI at 43.55, there is no short-term momentum shift worth trading against the dominant trend.
In this scenario, failure to hold the $46.66 hourly support leads to a test of $46.19 (daily S1). Below that, the daily Bollinger lower band at $43.43 becomes the next key zone. Broader market weakness adds to the headwinds. U.S. equities finished lower on Thursday as a decline in global technology stocks weighed on sentiment. This pressures a cyclical name like AA in the current environment.
Positioning and Volatility Outlook
The weight of evidence points to Alcoa Corporation stock still being in a downtrend, not yet in recovery. The oversold daily RSI and the faint MACD histogram improvement are early warning lights, not confirmed reversal signals.
Overall, the proximity of Q2 earnings introduces binary event risk. The ATR of $2.56 on the daily and $0.72 on the hourly alone cannot fully capture this. For market participants tracking AA, the key watchpoint is the earnings catalyst. How price reacts to the $47.05 daily pivot in the aftermath will be critical.
Until a higher-timeframe structure begins to repair — at minimum, a reclaim of the EMA20 — the path of least resistance remains lower. The oversold condition provides a technical floor of caution, not a floor of conviction. This is not financial advice.
FAQ
Is Alcoa Corporation stock oversold right now?
Yes. The daily RSI14 sits at 28.49, which is firmly in oversold territory. However, oversold conditions in a trending market are not automatic buy signals. The stock can remain oversold for extended periods if fundamentals continue to deteriorate.
What are the key resistance levels for Alcoa Corporation stock?
The immediate resistance is the daily pivot at $47.05. Above that, R1 at $47.70 becomes the next hurdle, followed by the EMA20 at $52.63. A sustained reclaim of these levels would be needed before any trend neutralization becomes realistic.
What is the bearish scenario for AA?
Failure to hold the $46.66 hourly support would lead to a test of the daily S1 pivot at $46.19. Below that, the daily Bollinger lower band at $43.43 becomes the next key downside reference zone. The bearish structure remains dominant across all timeframes.
Could Q2 earnings reverse the downtrend in Alcoa Corporation stock?
A strong Q2 earnings beat — particularly with upside surprises in aluminum revenues driven by smelter restarts — could trigger sharp short-covering from deeply oversold levels. However, the structural trend remains bearish until the EMA20 at $52.63 is reclaimed on a sustained basis.
Disclaimer: This article is for informational purposes only and does not constitute financial advice, an investment recommendation, or a solicitation to buy or sell any financial instrument or cryptocurrency. The analysis provided is not indicative of future results. Investing in crypto assets and financial markets carries a high risk of capital loss. Always do your own research (DYOR) and consult a qualified financial advisor before making any decision.
Article produced with the assistance of artificial intelligence and reviewed by the editorial team.








 English (US) ·