
 3 hours ago
18
3 hours ago
18
Alibaba stock closed at $118.47 on Monday, down roughly 10% after the company confirmed a $10.2 billion equity placement to fund its AI build-out. Price now trades below all three key moving averages on the daily chart. The broader trend structure has turned unmistakably heavy.
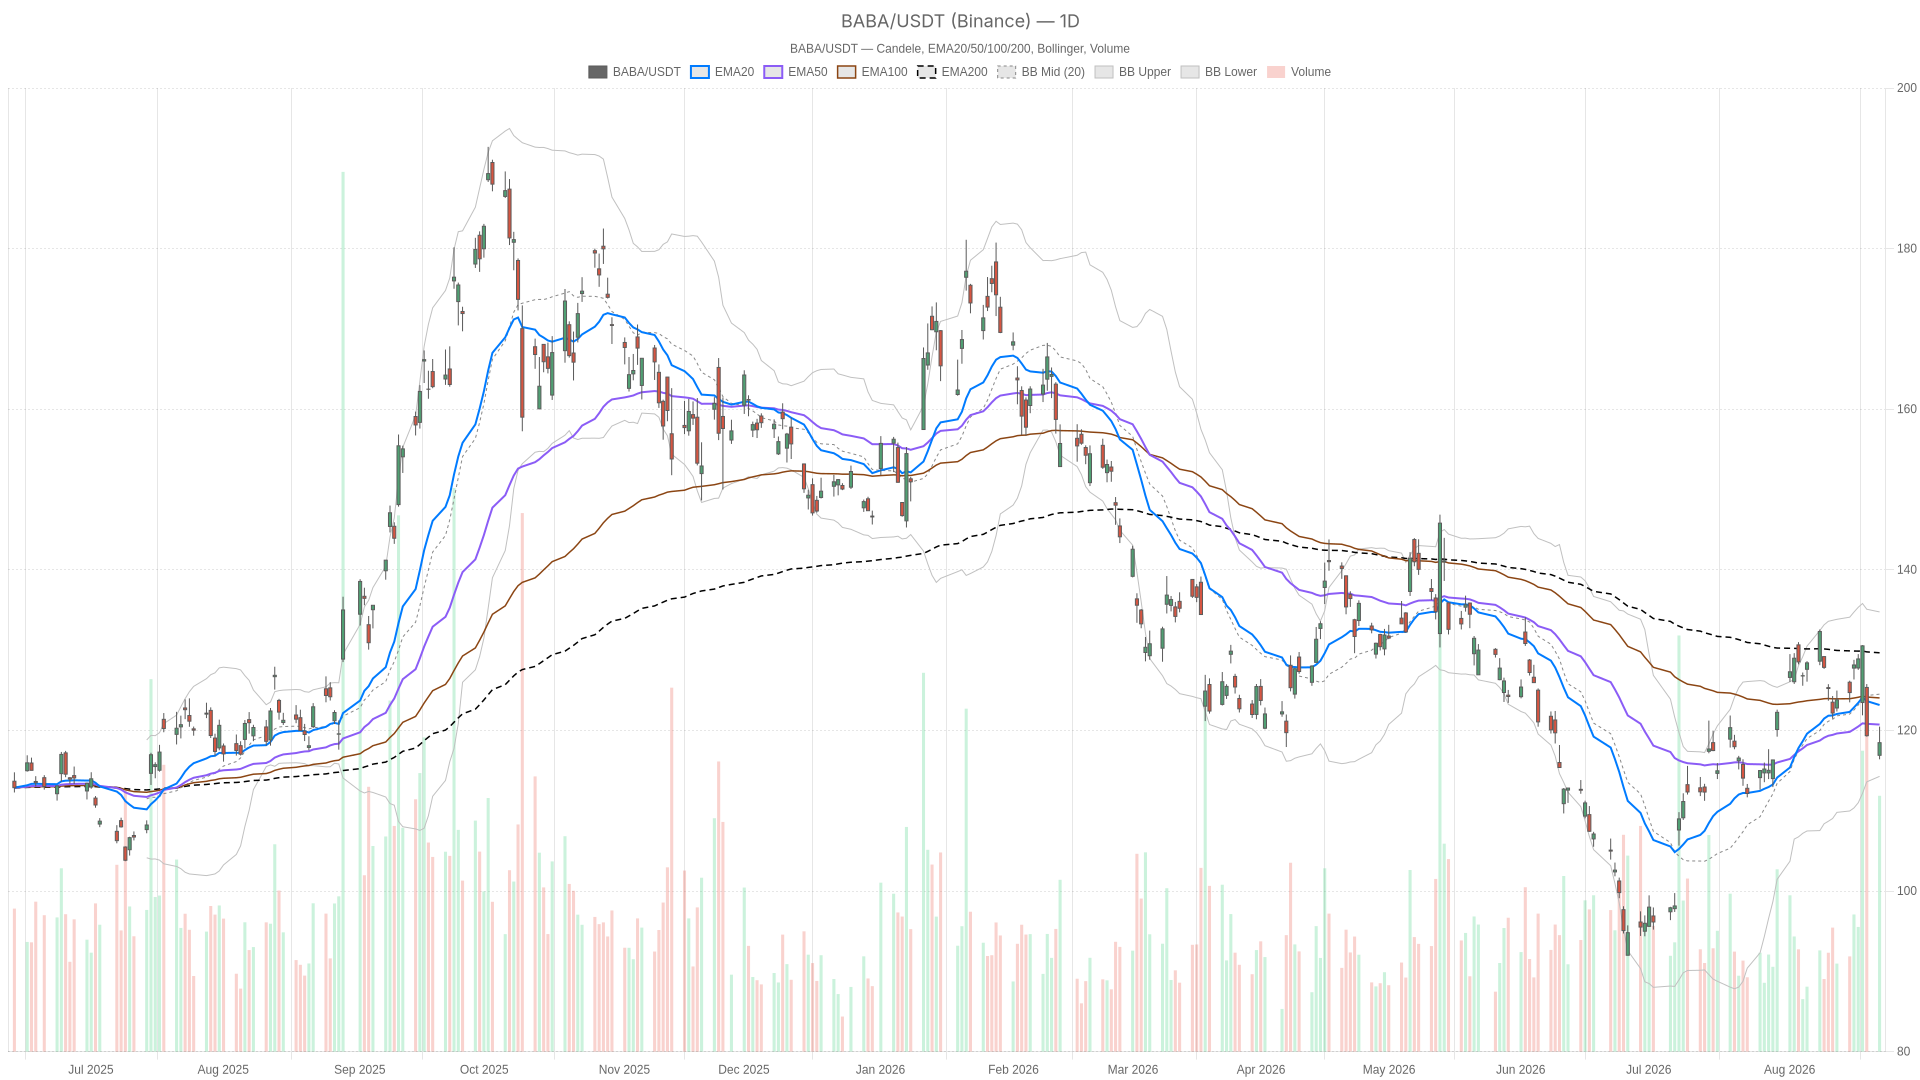 BABA — daily chart with candlesticks, EMA20/EMA50 and volume.
Key takeaways
- Alibaba stock fell roughly 10% after a $10.2 billion equity placement for AI investment
- Price trades below the EMA20 ($123.16), EMA50 ($120.73), and EMA200 ($129.67)
- Insiders, including the CEO, purchased more than 1 million shares following the selloff
- Daily support sits at $116.42, with resistance at $120.49
- RSI14 at 44.99 remains neutral, meaning the selloff has not yet reached exhaustion
Alibaba Stock Daily Chart: A Trend Under Pressure
The daily chart shows Alibaba stock has lost its bullish footing decisively. Price trades below all three key moving averages in a textbook bearish alignment.
In terms of momentum, the MACD line sits at 2.0 versus a signal line of 3.1. This produces a negative histogram of -1.1. Momentum is clearly fading. The MACD line remains in modestly positive territory, but recent bounce attempts have lacked real conviction. Meanwhile, RSI14 at 44.99 is not yet oversold. It sits in neutral ground, which suggests sellers have pushed price lower without exhausting the move.
On the volatility front, the daily Bollinger Bands show price hugging the lower half of the range. The mid-band stands at $124.51 and the lower band at $114.28. A close near that lower boundary after a violent single-day drop typically signals stress rather than calm consolidation.
AI Funding Shock Triggers the Selloff
Notably, the news backdrop explains much of this technical damage. Alibaba’s decision to sell 710 million shares to raise $10.2 billion for AI investment put it alongside Alphabet and Intel. Both raised capital earlier this year for similar reasons. However, investors reacted with clear discomfort. Dilution concerns collided with a weak June quarter, and shares were dumped aggressively.
Insider Buying Offers a Counter-Signal
At the same time, a notable counter-signal emerged. Alibaba’s CEO and other insiders purchased more than 1 million shares following the selloff. Markets often read such gestures as confidence from those closest to the business. Seeking Alpha‘s coverage went further, arguing the market got this one wrong. That divergence between headline reaction and insider behavior is worth watching closely as Alibaba stock searches for a base.
Elevated Volatility and Pivot Structure
In volatility terms, daily ATR14 stands at 4.36, confirming just how much turbulence has entered the picture. The daily pivot structure places the pivot point at $118.45, essentially where price closed. Resistance sits at $120.49 and support at $116.42. This tight clustering around the pivot suggests the market is still deciding direction rather than committing firmly to either side.
1H Timeframe Confirms the Bearish Bias
The 1-hour chart reinforces the bearish tone across Alibaba stock without offering relief. Price remains below all three key moving averages, mirroring the daily structure exactly.
On the 1H chart, price sits below the EMA20 ($121.41), EMA50 ($123.69), and EMA200 ($120.84). However, RSI14 on the 1H has dropped to 34.11. That is meaningfully closer to oversold territory than the daily reading. This gap between timeframes matters. It implies the recent decline has been steep and fast on an intraday basis. The daily RSI has not yet reached extreme levels, but the 1H reading tells a more urgent story. The 1H MACD reinforces the negative tilt. The line at -2.18 sits below a signal of -1.89, with a histogram of -0.29. Both are firmly negative.
Therefore, the 1H timeframe does not contradict the daily bias. It sharpens it. The tight 1H pivot range shows price compressed into a narrow band just above the pivot. Pivot stands at $118.68, resistance at $118.97, and support at $118.19. This kind of compression after a large move often precedes a directional decision. Traders should treat the current zone as a decision point rather than a stable equilibrium.
15-Minute Execution Context
On the 15-minute chart, Alibaba stock remains in a bearish regime. A subtle stabilization hint has appeared within the broader downtrend, but it is far from a reversal signal.
Currently, price trades right at its EMA20 ($118.99) while remaining well below the EMA50 ($120.42) and EMA200 ($123.98). Notably, the 15m MACD histogram has ticked slightly positive at 0.08. Yet the MACD line (-0.41) stays below its signal (-0.49). This hints at short-term stabilization within a broader downtrend. RSI14 at 41.64 remains below the midpoint. That is consistent with sellers still holding the upper hand intraday. The 15m Bollinger Bands are notably narrow, with bounds at $119.98 and $118.04. This reflects the sharp drop in short-term ATR to 0.48 as the market consolidates after Monday’s volatility spike.
Bullish Scenario for Alibaba Stock
A bullish recovery in Alibaba stock hinges on reclaiming key pivot and moving average levels. Insider buying provides a credible argument that the selloff may be overdone.
A constructive case would need price to reclaim the daily pivot at $118.45 and push through resistance near $120.49. Ideally, it would also recover the EMA50 on the daily chart at $120.73. Insider buying of more than 1 million shares by the CEO and other executives adds weight to the bullish argument. Those with the deepest knowledge of the business appear to see the selloff as overdone. If the AI investment thesis gains traction with investors over time, sentiment could shift from dilution fear toward growth optimism. Comparisons to Alphabet and Intel’s own capital raises support this view. A close back above the daily EMA20 near $123 would be an early signal that buyers are regaining control.
Bearish Scenario and Invalidation Levels
The bearish case for Alibaba stock remains intact as long as price stays below the daily EMA200 and fails to reclaim the pivot zone. A break of key support would extend the current downtrend.
Price remains below the daily EMA200 at $129.67. A break below daily support at $116.42 would open the door toward the lower Bollinger Band at $114.28. Continued concern over AI spending weighing on profits could keep pressure on shares. The weak June quarter cited in recent coverage adds to this risk, even if insiders are buying. A failure of the 1H RSI to recover from its current 34.11 reading would confirm sellers remain dominant. Persistently negative MACD histograms across both daily and 1H timeframes reinforce this outlook.
Alibaba Stock: Key Levels and Market Outlook
Alibaba stock sits at a genuine inflection point between dilution fears and insider confidence. The $116.42 to $120.49 range on the daily chart is the key battleground to watch.
Overall, the daily and 1H timeframes align on near-term weakness. However, insider buying and contrarian analyst views introduce real uncertainty into the longer-term picture. Volatility remains elevated, as shown by the daily ATR of 4.36. The narrow pivot ranges across timeframes suggest the market has not yet settled on a clear direction. This is a market defined by conflicting forces. Dilution concerns compete against insider confidence. AI spending risk vies against long-term strategic bets. Positioning here calls for discipline given the volatility. Traders should watch the $116.42 to $120.49 range on the daily chart as the key battleground for the next directional move.
FAQ
Why did Alibaba stock drop recently?
Alibaba stock fell roughly 10% after the company announced a $10.2 billion equity placement, issuing 710 million shares to fund its AI infrastructure build-out. Investors reacted negatively to the dilution, compounded by a weak June quarter.
What are the key support and resistance levels for Alibaba stock?
Daily support sits at $116.42, with the lower Bollinger Band at $114.28 providing additional support. Resistance stands at $120.49, with the EMA50 at $120.73 and EMA20 near $123 acting as overhead barriers.
Are Alibaba insiders buying the stock?
Yes. Alibaba’s CEO and other executives purchased more than 1 million shares following the selloff, signaling confidence from those closest to the business.
Disclaimer: This article is for informational purposes only and does not constitute financial advice, an investment recommendation, or a solicitation to buy or sell any financial instrument or cryptocurrency. The analysis provided is not indicative of future results. Investing in crypto assets and financial markets carries a high risk of capital loss. Always do your own research (DYOR) and consult a qualified financial advisor before making any decision.
Article produced with the assistance of artificial intelligence and reviewed by the editorial team.




 English (US) ·