
 2 months ago
42
2 months ago
42
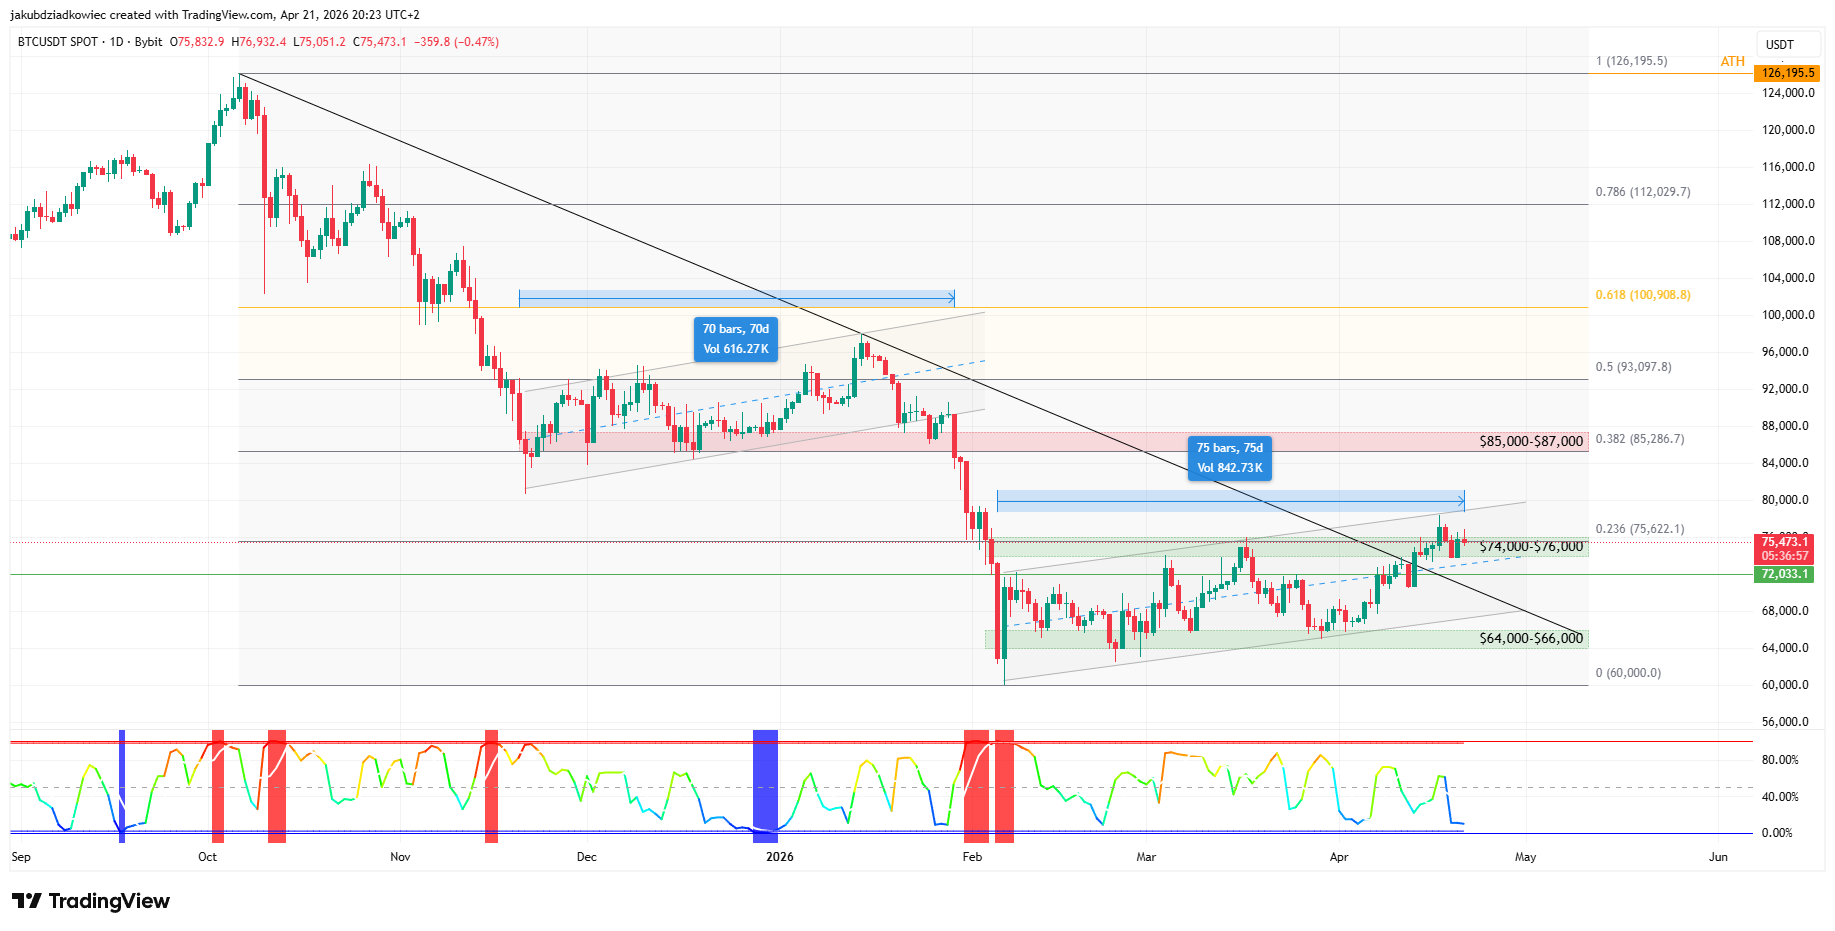
Bitcoin (BTC) is trading near $75,400 after rejecting $78,000 earlier this week. Price sits on the upper rail of an ascending parallel channel that has held for 75 days.
The setup places Bitcoin at a pivotal moment. A daily RSI triangle is compressing, and the 4-hour chart is flashing bearish divergence. A widely shared X post calls this the third rejection zone of the past eight months.
Descending Trendline Break Meets the Channel Top
The daily Bitcoin chart shows a descending trendline from the $126,195 peak set in October 2025. That line connects to the February 2026 cycle low at $60,000. Bitcoin broke above it for the first time this cycle on April 13.
Two ascending parallel channels define the recent structure. The first channel ran for 70 days before breaking down in late January. The current channel has now reached day 75, with price pressing the upper boundary.
The BBWP indicator at the bottom of the chart tracks volatility compression. Readings sit near cycle lows, a classic accumulation footprint that typically precedes a strong directional move.
Bitcoin must defend the $74,000 to $76,000 zone to keep the structure intact. A loss of that range exposes the descending trendline near $70,000 as secondary support. The next demand cluster sits between $64,000 and $66,000. Closest resistance is the 0.382 Fibonacci level between $85,000 and $87,000.
 BTC/USDT daily chart / Source: Tradingview
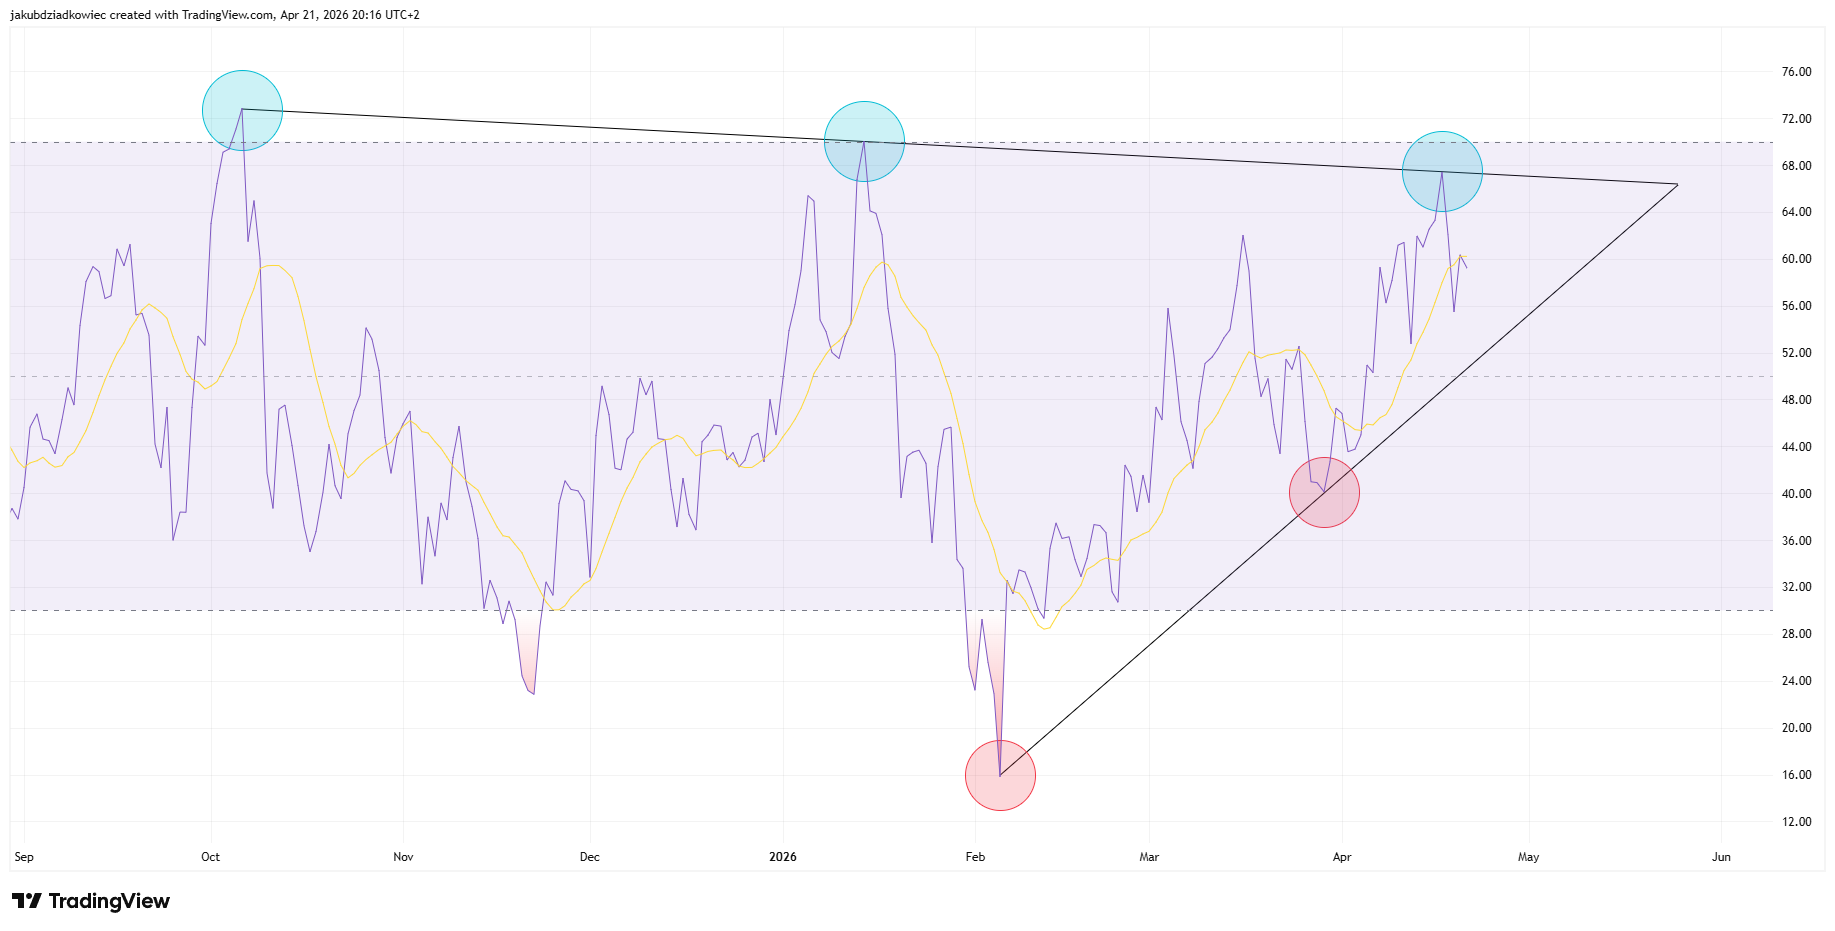
Daily RSI Carves a Tightening Triangle
The daily RSI is forming a symmetrical triangle built from three descending peaks and two ascending support tests. The first peak printed deep in overbought territory in October 2025.
The second peak formed in mid-January 2026 with RSI touching 70 before a sharp rejection. The third and most recent peak capped out near 68 earlier this month.
On the support side, RSI collapsed to oversold readings near 15 during the February selloff. A second test near 40 in March held firmly and confirmed the ascending line.
The triangle is now tight. A clean break into overbought territory would validate the bullish continuation scenario. A breakdown through the ascending support would flip the medium-term momentum bearish.
 BTC/USDT daily RSI chart / Source: Tradingview
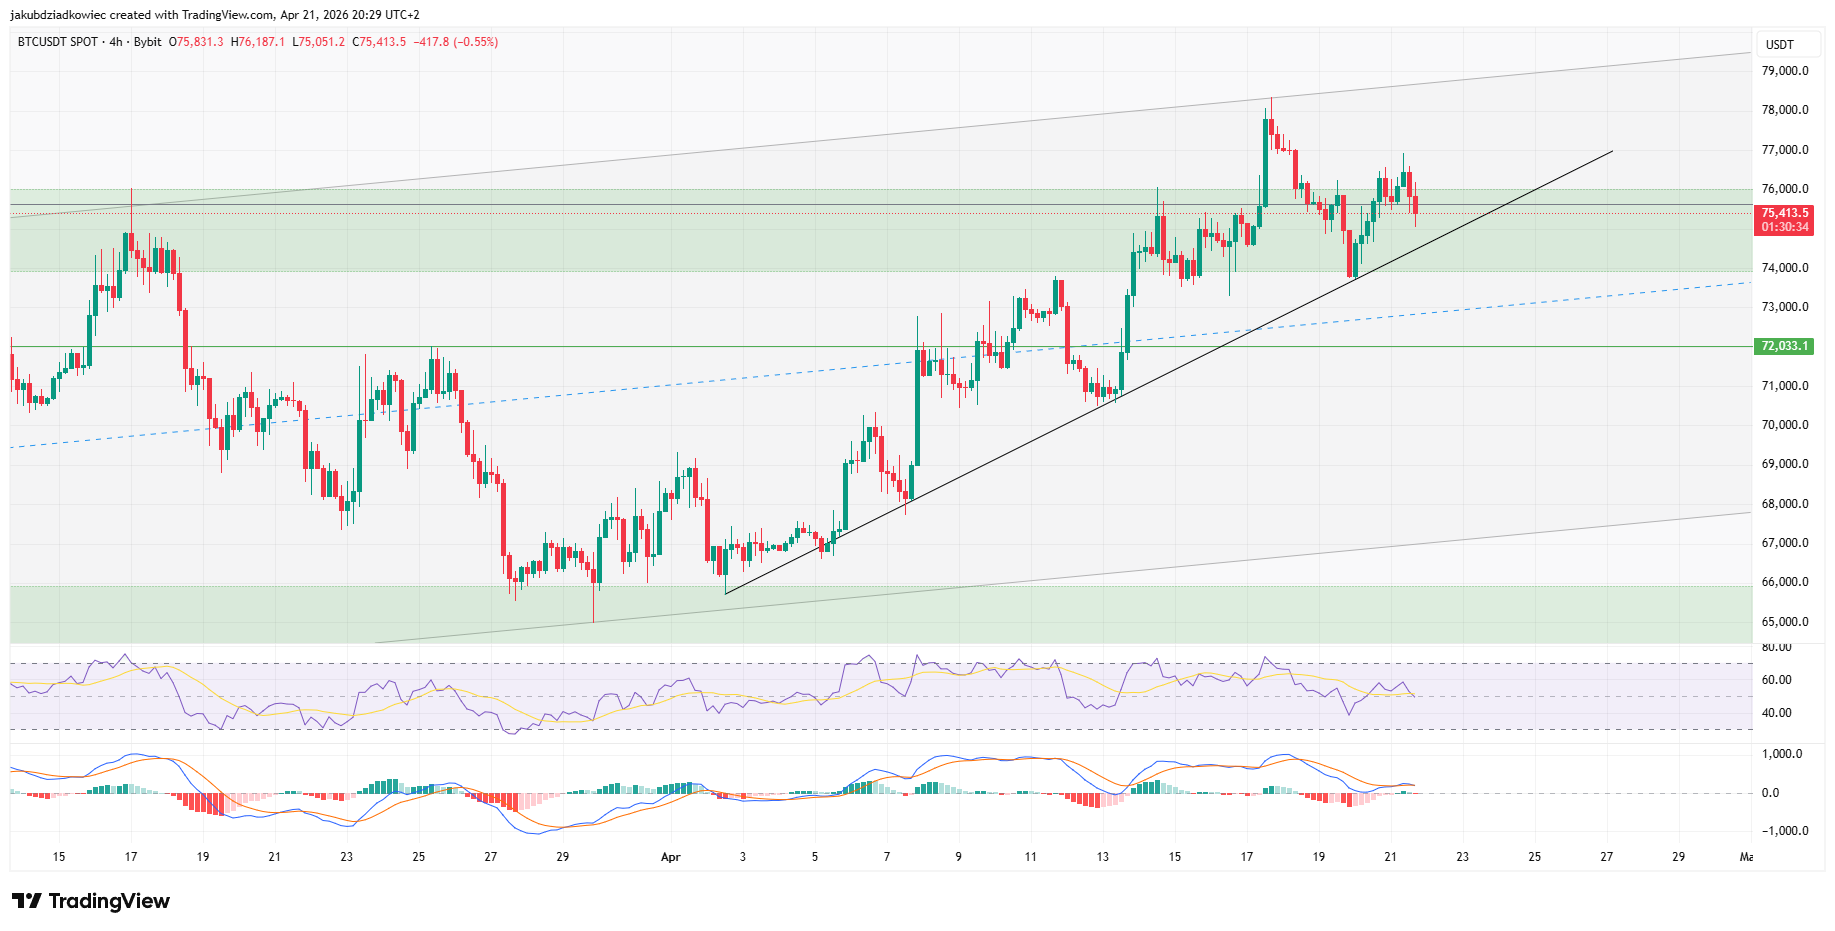
4-Hour Chart Flashes Five-Drive Bearish Divergence
Bitcoin on the 4-hour timeframe shows a short-term uptrend with higher highs and higher lows. The structure has held since late March, bottoming near $65,500, with an ascending trendline connecting those swing lows.
Price rejected the $78,000 zone earlier this week. That level matches the top of the daily parallel channel. Bitcoin now trades near $75,400, sitting directly on the ascending trendline that has guided every bounce since early April.
The 4-hour RSI has been posting slightly lower lows while the price made higher highs. That pattern forms a five-drive bearish divergence, signaling weakening momentum beneath rising prices.
The MACD has crossed below its signal line and is edging toward negative territory. A loss of $74,500 would confirm the short-term momentum shift and expose the daily ascending trendline.
 BTC/USDT 4-hour chart / Source: Tradingview
Analyst Flags Third Rejection Zone
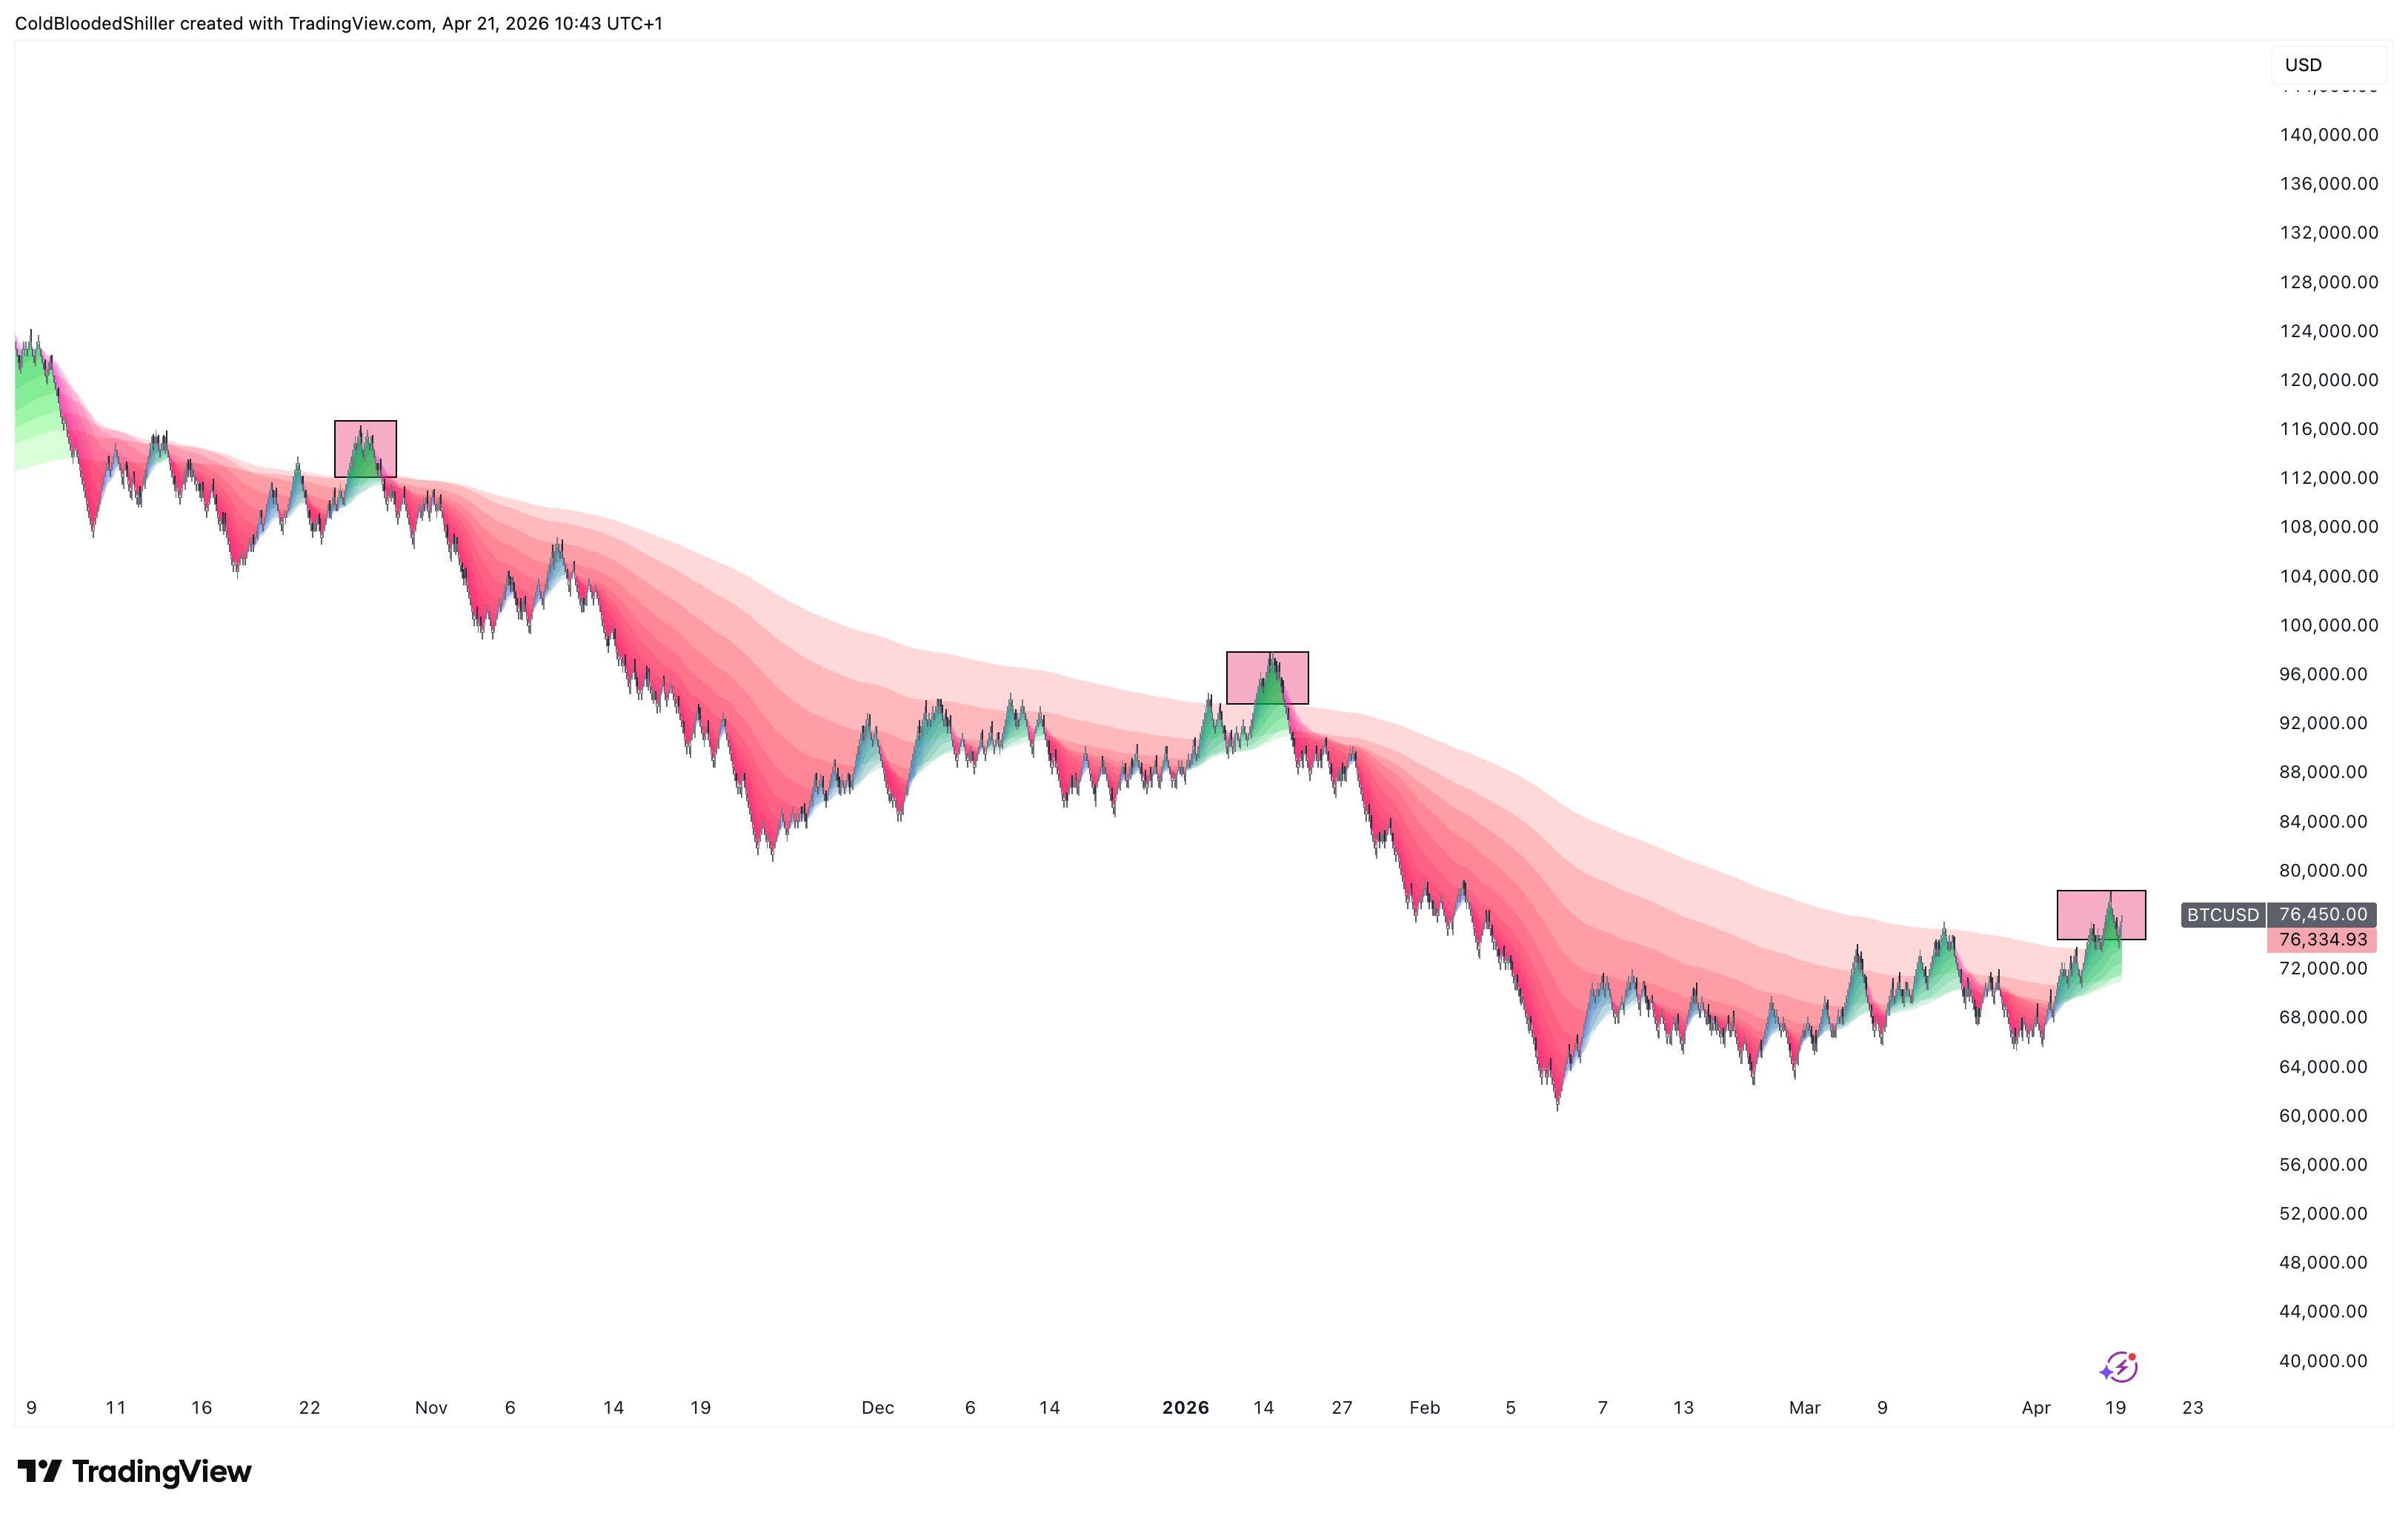
A chart posted to X by analyst ColdBloodedShiller highlights a key rejection zone for Bitcoin. The same band has capped every BTC advance in the past eight months. The three pink boxes mark October 2025 near $116,000, January 2026 near $96,000, and the current level near $76,000.
The trader frames this as the best risk-to-reward short setup currently available. Each prior visit to the upper band produced a sharp reversal. The pattern lines up with the daily trendline break and the 4-hour divergence above.
If this breaks up, it’s the most significant change to the market we’ve seen for the best part of 12 months.
 BTC/USDT chart / Source: X
Institutional flows, however, complicate the bearish thesis. Strategy, the largest corporate Bitcoin holder, added roughly $2.54 billion of BTC between April 13 and 19. Its average cost came in near $74,395. Sustained demand at these levels could weaken the recurring rejection pattern.
The next three to five daily candles should settle the dispute between the channel breakout and ColdBloodedShiller’s third rejection setup.
The post Analyst Predicts the Best Bitcoin Short Setup in a Year appeared first on BeInCrypto.


 English (US) ·