
 2 hours ago
19
2 hours ago
19
Apple stock enters earnings week with strong technical momentum, trading at $335.71. AAPL sits above all major moving averages in a confirmed bullish regime. Up over 22% year to date, it recently became the world’s most valuable company. The July 30 earnings report looms as the next major catalyst.
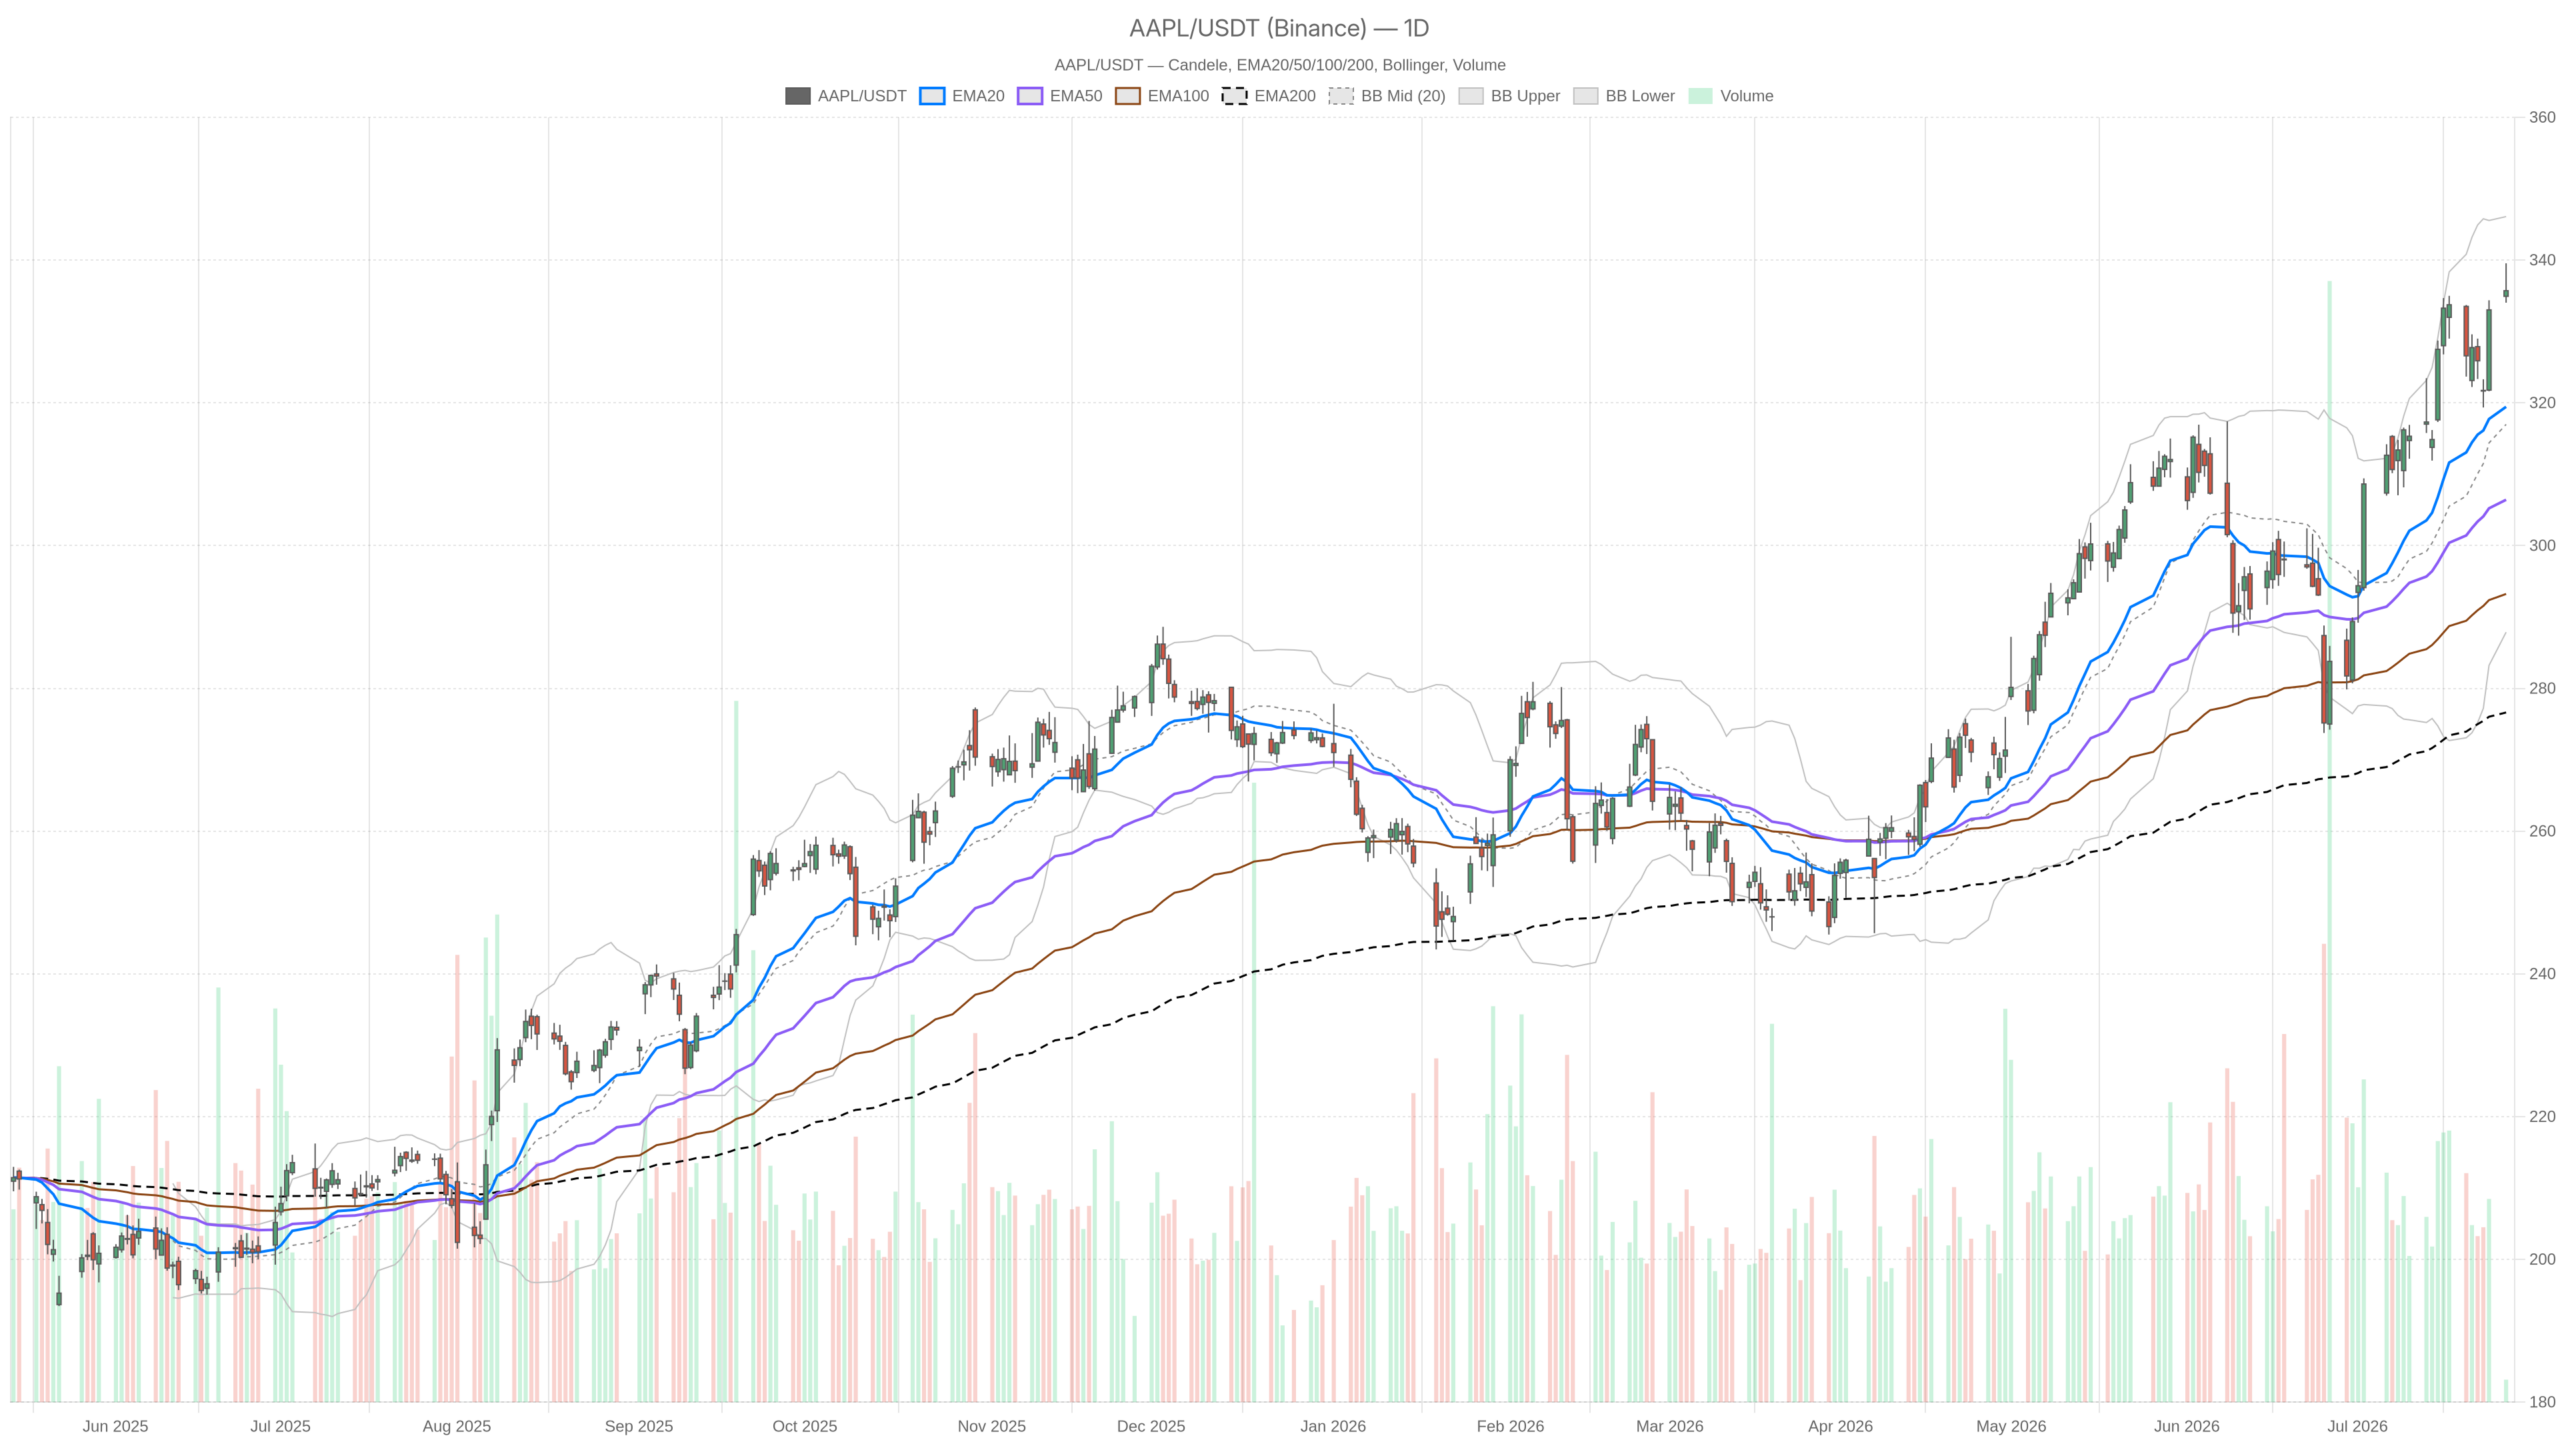 AAPL — daily chart with candlesticks, EMA20/EMA50 and volume.
Key takeaways
- AAPL trades at $335.71, well above its 20-day EMA ($319.45), 50-day EMA ($306.42), and 200-day EMA ($276.62).
- Daily RSI at 66.68 signals strong momentum without reaching overbought territory; MACD histogram remains positive at 1.03.
- Apple stock has climbed more than 22% year to date and recently overtook Nvidia as the world’s most valuable company.
- The daily pivot sits at $336.43, with resistance at $338.83 and support at $333.31 — price is hugging the pivot ahead of earnings.
- Quarterly earnings on July 30 represent a major volatility event, with bullish daily and hourly trends facing a binary catalyst.
Daily Timeframe: Apple Stock’s Trend With Real Substance
The daily chart shows Apple stock in a confirmed multi-month uptrend with no structural deterioration. All trend indicators point in the same direction.
Apple stock’s EMA stack is fully aligned and positively ordered. The 20-day EMA sits at $319.45, the 50-day at $306.42, and the 200-day at $276.62. At $335.71, price trades well above all three. This structure reflects sustained, multi-month accumulation rather than short-term noise.
Meanwhile, the daily RSI at 66.68 signals strong momentum without triggering overbought warnings. The MACD reinforces this view. Its line stands at 8.83, above the signal at 7.80, while the histogram prints a positive 1.03. The trend is not just intact — it is still expanding.
At the same time, the Bollinger Bands place the upper band at $346.10 and the lower at $287.87. Price sits comfortably in the upper half of the range. This positioning is consistent with a trending environment rather than a mean-reversion setup. The ATR of 7.93 reflects moderate daily volatility — enough range for trading without erratic instability.
On the pivot framework, the daily pivot stands at $336.43. Resistance rests at $338.83 and support at $333.31. Price closed at $335.71, essentially hugging the pivot. This proximity signals indecision at a near-term inflection point — a market holding its breath before Thursday’s earnings.
Hourly Confirmation: Apple Stock’s Intraday Trend Holds
The hourly timeframe confirms the daily bullish bias without adding complications. Dips continue to attract buyers across the intraday structure.
Meanwhile, Apple stock’s hourly EMA stack mirrors the daily alignment. The EMA20 sits at $331.50, the EMA50 at $327.81, and the EMA200 at $315.39 — all well below the $335.71 close. Price runs above every major hourly moving average. This is consistent with a market where buying pressure persists on pullbacks.
Hourly RSI at 63.91 echoes the daily reading — strong but not stretched. The MACD on the 1H frame is also positive. The line at 3.07 stands above the signal at 2.16, with a histogram of 0.91. Both momentum and trend align on this timeframe. This strengthens the daily bullish view rather than challenging it.
Notably, the 1H Bollinger Bands place price above the midline at $329.12. This again points toward trend behavior rather than range-bound consolidation. The ATR of 2.74 on this frame is modest. Intraday volatility has been relatively contained — fitting for a stock consolidating gains below resistance ahead of a binary event.
15-Minute Frame: Short-Term Caution Emerges
The 15-minute chart introduces short-term caution without invalidating the broader trend. Momentum is fading slightly at the intraday level.
However, the regime on this timeframe is classified as neutral. The MACD histogram has flipped negative at -0.51. This means short-term momentum is softening, even as the broader structure remains intact. The 15m RSI at 53.25 sits mid-range, offering no directional edge on its own.
Price on the 15-minute frame trades just below the Bollinger midline of $336.81. This represents a minor pullback within a broader uptrend — not a breakdown. The ATR of 1.08 reflects tight, compressed action. For traders evaluating entry timing, this frame suggests patience. Wait for a reclaim of $336.81 or a dip toward the 15m support pivot at $335.46 before acting.
The Bullish Case: Discipline Rewarded, Earnings as Catalyst
The bullish scenario for Apple stock is structurally well-supported. A clean uptrend spans all major timeframes, and the earnings catalyst could accelerate the move.
The narrative around Apple’s capital expenditure restraint is resonating with investors. Many are growing weary of massive AI spending commitments from rivals. Apple stock has climbed more than 22% year to date for a reason. The market is pricing in efficiency and margin discipline — not raw infrastructure spend.
On the technical side, a break and hold above daily resistance at $338.83 would confirm continued strength. Above that level, the upper Bollinger Band at $346.10 becomes the next reference point. A strong earnings print on July 30 could provide the catalyst for that move. Positive commentary around iPhone demand and the consumer product cycle would be especially significant.
The Bearish Case: What Could Invalidate the Setup
Several factors, however, could undermine the bullish thesis for Apple stock. The most immediate risk is the earnings report itself.
In contrast, Apple’s conservative AI spending posture is being openly questioned by some market participants. The debate asks whether this restraint reflects discipline or denial. A disappointing earnings result — or guidance revealing structural demand weakness in the iPhone segment — could snap the momentum quickly.
From a technical standpoint, a daily close below the $333.31 support pivot would be the first warning sign. A deeper breakdown toward the $319–$320 zone would represent a more serious deterioration. That area coincides with the daily EMA20. At that point, the bullish bias would need a full reassessment.
Positioning and Volatility Outlook Ahead of Earnings
Overall, Apple stock enters the final stretch before earnings in a technically sound but event-sensitive position. The trend is supportive, and momentum remains intact across the key timeframes.
The daily and hourly frames are aligned bullishly. The 15-minute frame signals short-term consolidation rather than reversal. The daily ATR of 7.93 provides a reasonable baseline for daily swing expectations. However, earnings week routinely amplifies that figure significantly.
Therefore, traders should treat the July 30 report as a volatility reset point, not merely another data release. The stock trades near critical pivot levels with the trend favoring upside continuation. Patience and risk discipline matter most in the sessions ahead.
FAQ
What is the current price of Apple stock and its key technical levels?
Apple stock closed at $335.71 on July 27, trading above its 20-day EMA ($319.45), 50-day EMA ($306.42), and 200-day EMA ($276.62). The daily pivot stands at $336.43, with resistance at $338.83 and support at $333.31. The upper Bollinger Band sits at $346.10.
Is Apple stock overbought ahead of earnings?
The daily RSI at 66.68 indicates strong momentum but remains below the typical overbought threshold. The MACD histogram is still positive at 1.03, suggesting the trend is expanding rather than exhausting. The stock is elevated but not technically overbought.
What could invalidate Apple stock’s bullish trend?
A daily close below the $333.31 support pivot would be the first warning. A deeper breakdown toward the $319–$320 zone — where the daily EMA20 sits — would represent more serious trend deterioration. A disappointing earnings report or weak iPhone demand guidance could also trigger a reversal.
When is Apple’s next earnings report?
Apple is scheduled to report quarterly earnings on July 30. The report is expected to be a major volatility event, with the stock’s bullish technical structure facing a binary catalyst.
Disclaimer: This article is for informational purposes only and does not constitute financial advice, an investment recommendation, or a solicitation to buy or sell any financial instrument or cryptocurrency. The analysis provided is not indicative of future results. Investing in crypto assets and financial markets carries a high risk of capital loss. Always do your own research (DYOR) and consult a qualified financial advisor before making any decision.
Article produced with the assistance of artificial intelligence and reviewed by the editorial team.









 English (US) ·