
 1 month ago
53
1 month ago
53

Apple stock closed at $315.32 on July 10, holding near all-time highs in a structurally bullish daily trend. Price sits well above key moving averages, though an hourly momentum divergence now warrants short-term caution.
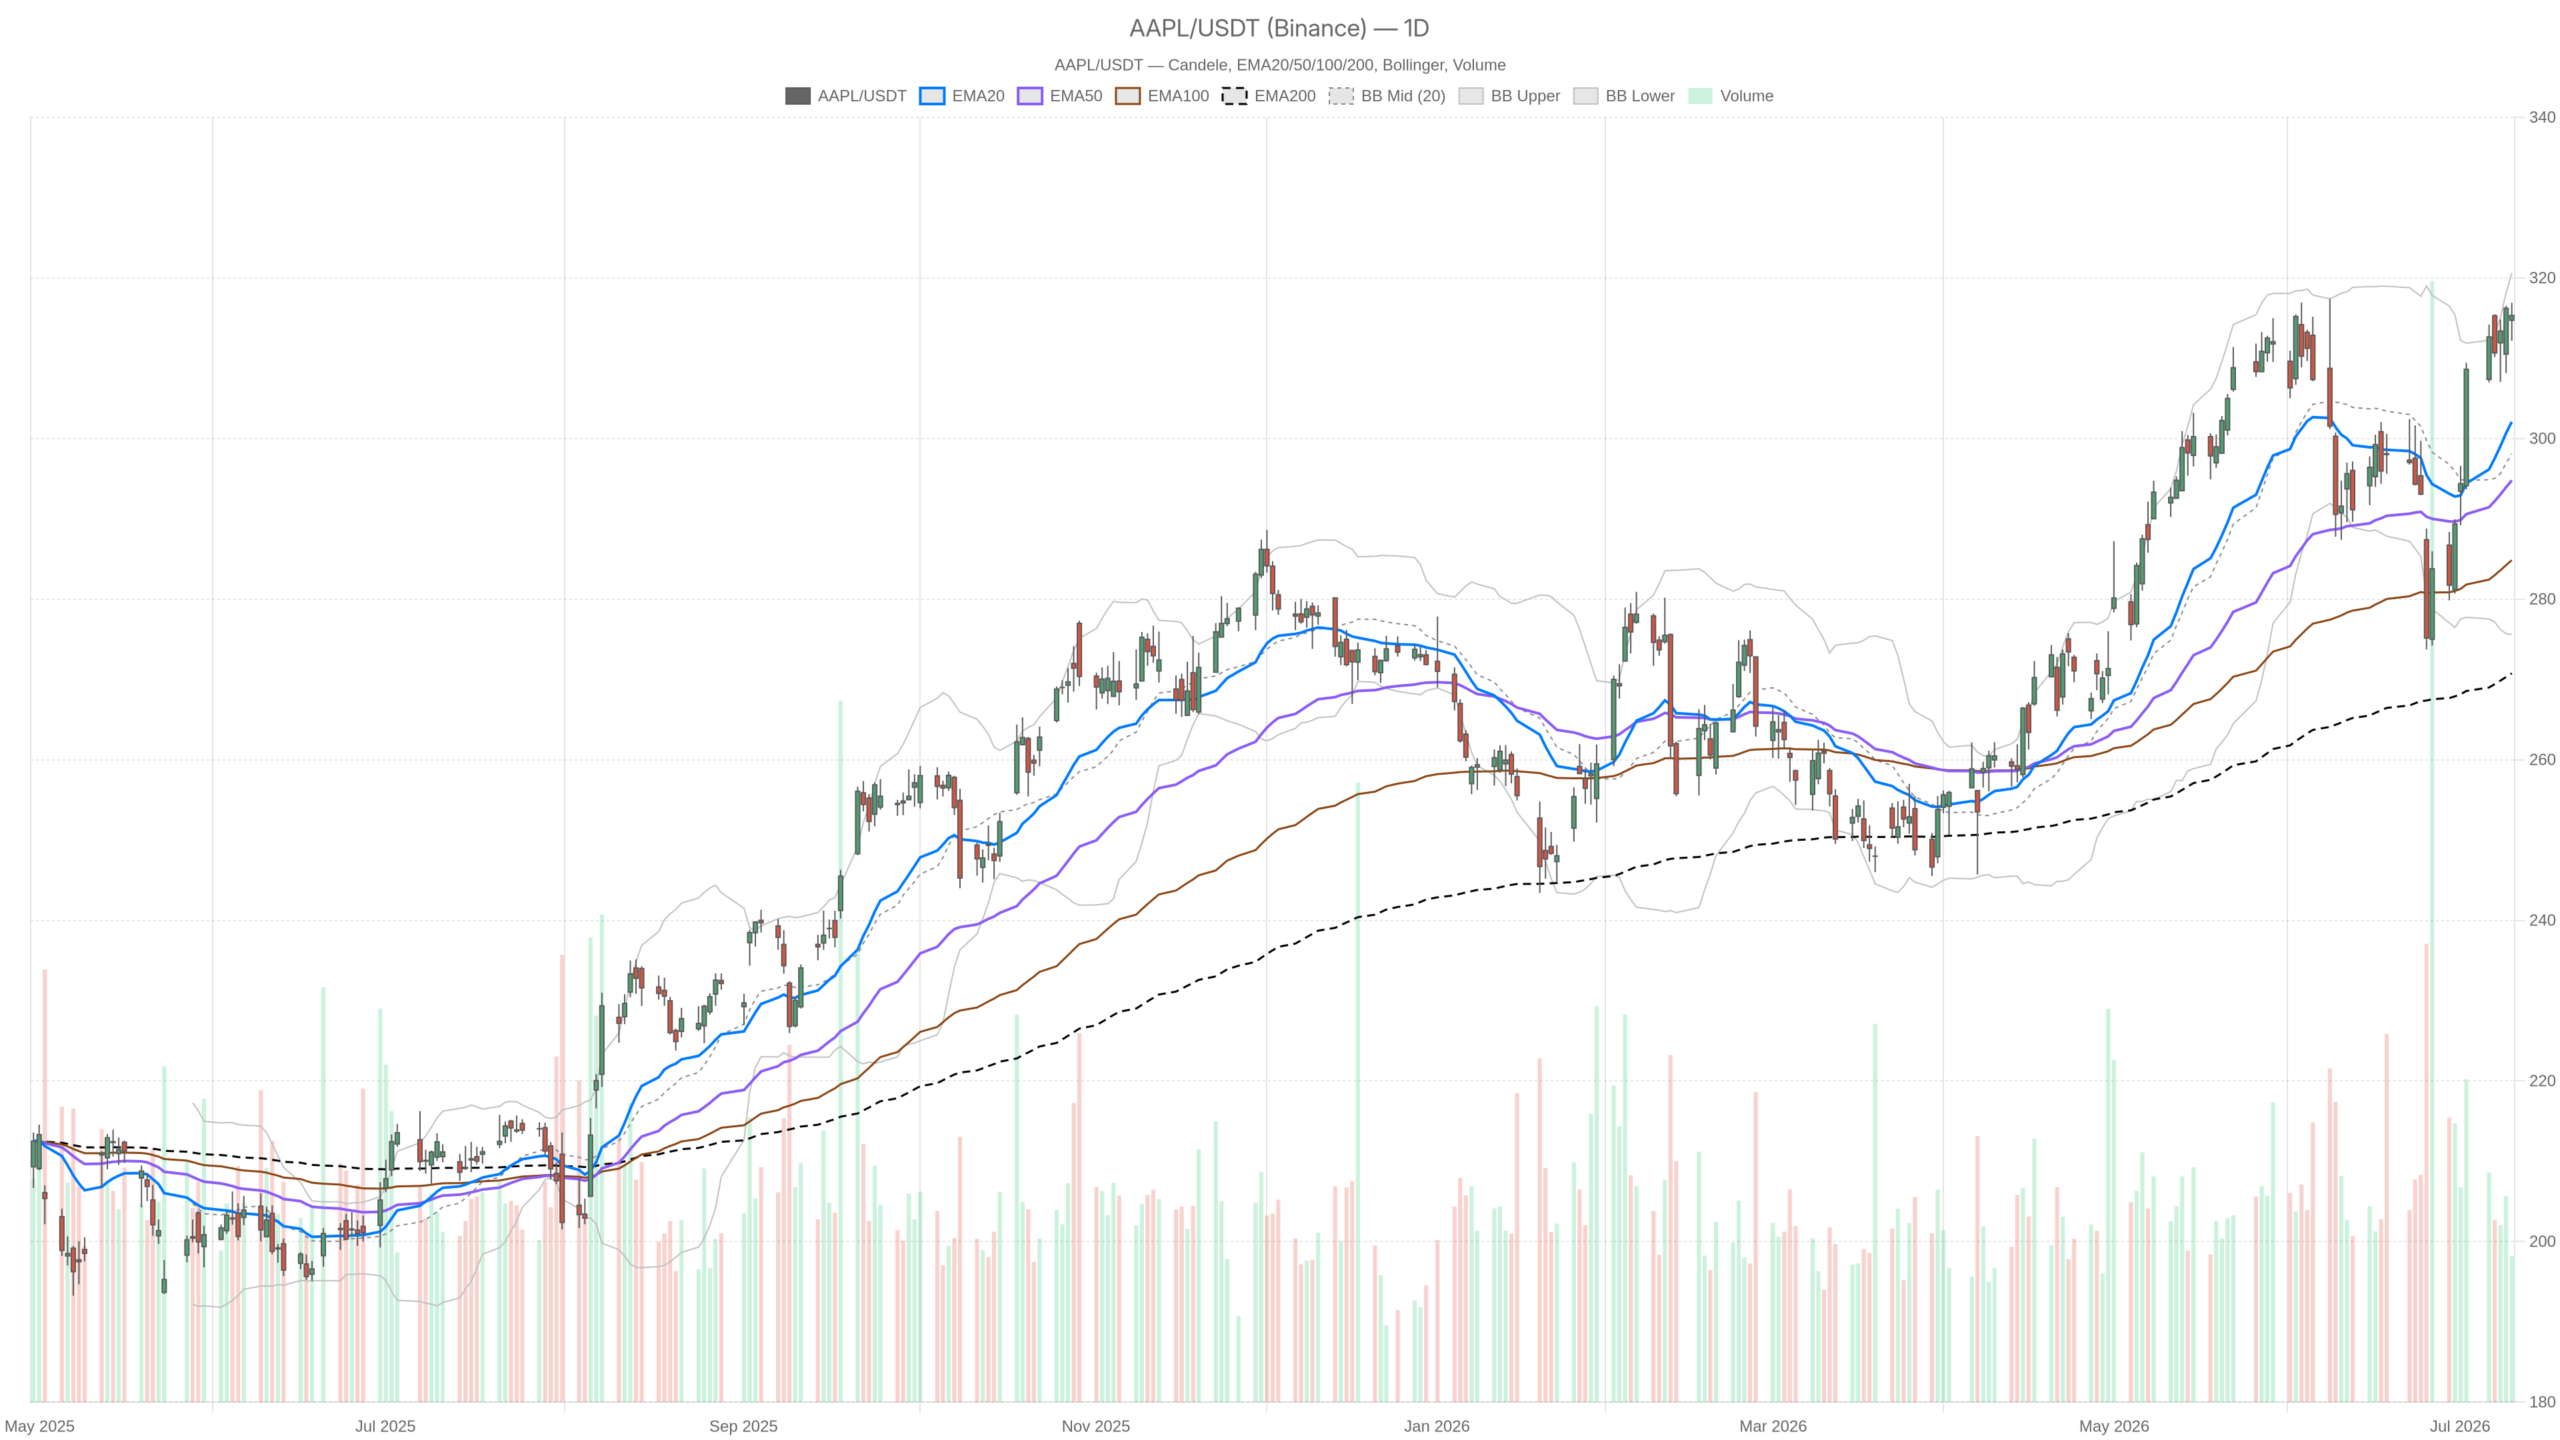 AAPL — daily chart with candlesticks, EMA20/EMA50 and volume.
Key takeaways
- AAPL closed at $315.32 on July 10, up 48.9% over the past year and 16.9% year-to-date.
- Daily RSI14 at 62.93 signals strong momentum with room before overbought territory above 70.
- Hourly MACD has crossed bearish, producing a -0.32 histogram — a minor caution flag for short-term traders.
- The daily Bollinger upper band at $320.61 is the immediate upside target.
- A daily close below the EMA20 at $302.08 would materially weaken the bullish case.
Apple Stock Pushes Higher in a Structurally Bullish Trend
Apple stock remains in a firmly bullish daily structure. Price sits comfortably above all major exponential moving averages — a stacking configuration that signals sustained trend health.
The technical picture on the daily timeframe makes a compelling case for continued upside. Closing at $315.32 on July 10, AAPL sits above the EMA20 at $302.08, EMA50 at $294.78, and EMA200 at $270.76. Notably, price is leading, not chasing. The gap between current levels and long-term trend support is wide enough to absorb meaningful pullbacks without compromising the bullish structure.
The daily regime is classified as bullish, and the evidence supports that label without much ambiguity. AAPL shares are up 48.9% over the past year and 16.9% year-to-date. Meanwhile, Evercore ISI maintained coverage on June 25th with a $365 price target — well above current levels — reinforcing institutional conviction around the name.
Daily Momentum: RSI and MACD Confirm the Bullish Case
Daily momentum indicators reinforce the bullish case. RSI14 at 62.93 shows strong but sustainable momentum, while MACD prints a widening positive spread.
On the daily chart, RSI14 reads 62.93. That is elevated but not overextended — overbought territory typically begins above 70. The current level suggests strong momentum with room to run before exhaustion becomes a genuine concern.
The MACD picture is equally constructive. The MACD line sits at 4.61, well above the signal line at 1.89, with a histogram of 2.72. That positive and widening spread points to accelerating bullish momentum. There is no divergence or weakening histogram — just a clean, trending signal.
Bollinger Bands on the daily frame show price trading between the midline at $298.10 and the upper band at $320.61. This positioning is typical of AAPL in a strong uptrend. However, it is not pressing the upper band aggressively, which reduces the immediate risk of a mean-reversion snap. ATR14 at $8.95 reflects a moderately volatile daily range — meaningful, but not chaotic.
Hourly Timeframe: Bullish Bias Holds, but a Crack Appears
The hourly timeframe remains bullish, but a fresh MACD crossover below the signal line introduces short-term caution for intraday traders.
On the 1-hour chart, price at $315.33 holds above the EMA20 at $313.77, EMA50 at $308.75, and EMA200 at $301.12. All three remain in bullish alignment. RSI14 at 60.23 mirrors the daily reading: healthy momentum with no overbought excess.
However, the hourly MACD introduces a note of caution. The MACD line at 1.72 has slipped below the signal line at 2.04, producing a histogram of -0.32. That is a small but real divergence from the daily momentum signal. It does not reverse the daily thesis, but it suggests short-term bullish energy is fading marginally. In practical terms, the setup is not ideal for chasing AAPL breakouts on the hourly chart right now.
The hourly Bollinger Bands place price near the upper band at $316.97, with the midline at $314.05. That proximity, combined with the MACD crossover, is a minor warning flag for very short-term traders. Hourly pivot levels show resistance at R1 ($316.57) and support at S1 ($314.44). The stock oscillated within that range during the July 10 session.
15-Minute View: Execution Context and Near-Term Positioning
The 15-minute chart offers a neutral execution context. RSI14 at 55.11 and a modestly positive MACD make it useful for timing entries — not for generating directional views.
At the 15-minute level, the picture normalizes. RSI14 sits at 55.11 — neutral, not stretched in either direction. The MACD is positive with a histogram of 0.18, suggesting modest short-term bullish continuation. Price is above all three intraday EMAs, including the EMA200 at $307.94.
The 15m ATR of $0.67 is tight. That compresses the immediate swing range and reflects low intraday volatility around the July 10 close. Pivot support sits at $314.48, with resistance at $316.47 — confirming the same intraday range visible on the hourly chart. Therefore, this timeframe is best used for timing AAPL entries after the daily bias is already established.
The Bullish Scenario: $320 Upper Band in Focus
The immediate upside target for Apple stock is the daily Bollinger upper band at $320.61. R1 resistance at $317.43 acts as a near-term checkpoint.
If AAPL maintains its current structure, a clean break above $317.43 on the daily would likely attract further buying momentum. A recovery in the hourly MACD histogram would reinforce that move. Meanwhile, the longer-term narrative around a potential $5 trillion valuation by year-end provides macro context for sustained institutional demand. D.E. Shaw’s positioning and Evercore ISI’s $365 target both point to continued smart-money interest in the name.
The Bearish Scenario: What Would Invalidate the Thesis
The bearish case hinges on a daily close below the EMA20 at $302.08. That would materially weaken the bullish structure. However, a pullback to S1 at $312.69 remains well within the normal ATR range.
On the fundamental side, one analyst piece recently described the “AI toll booth” thesis for Apple as a myth. The argument: AI monetization remains weak and rising iPhone costs could weigh on growth. That structural concern is worth monitoring, even if it has not yet appeared in the price action.
From a technical standpoint, a pullback toward daily S1 at $312.69 is well within the ATR range. It should not be misread as a trend reversal. However, a sustained break below $302 would shift the bias to neutral at minimum. The ongoing Apple-OpenAI lawsuit saga adds headline risk that could spike volatility. Meanwhile, the public clash between Elon Musk and Sam Altman over anti-competition claims introduces further uncertainty. Still, Apple stock has weathered far worse sentiment storms.
Bottom Line: Strong Daily Trend, Minor Intraday Friction
Apple stock’s technical setup favors the bulls. The daily structure is clean, with only minor intraday friction from the hourly MACD crossover.
The daily timeframe is clean: price above all EMAs, constructive MACD, RSI with headroom. The hourly MACD crossover signals minor short-term fatigue rather than any reversal of substance. For longer-horizon participants, the structure remains intact and the risk/reward skews upward toward $317–$320. For shorter-term traders, patience around the hourly setup makes sense before adding exposure.
Volatility is manageable given the current ATR profile. However, the proximity to all-time highs means any deterioration in sentiment could produce sharp intraday swings. AI narrative pushback or macro noise remain potential triggers. Overall, discipline around levels — not conviction alone — keeps positioning sound in this environment.
FAQ
What is the immediate upside target for AAPL stock?
The daily Bollinger upper band at $320.61 is the immediate upside target, with R1 resistance at $317.43 acting as a near-term checkpoint.
Is Apple stock’s daily trend bullish or bearish?
The daily trend is firmly bullish. Price sits above all major EMAs (EMA20 at $302.08, EMA50 at $294.78, EMA200 at $270.76), with RSI14 at 62.93 and MACD printing a widening positive spread.
What would invalidate the bullish thesis for AAPL?
A daily close below the EMA20 at $302.08 would materially weaken the bullish case. A sustained break below that level would shift the bias to neutral at minimum.
What is the main caution flag in the current AAPL setup?
The hourly MACD has crossed bearish, with the MACD line at 1.72 slipping below the signal line at 2.04 and producing a -0.32 histogram. This signals minor short-term momentum fatigue rather than a reversal of substance.
Disclaimer: This article is for informational purposes only and does not constitute financial advice, an investment recommendation, or a solicitation to buy or sell any financial instrument or cryptocurrency. The analysis provided is not indicative of future results. Investing in crypto assets and financial markets carries a high risk of capital loss. Always do your own research (DYOR) and consult a qualified financial advisor before making any decision.
Article produced with the assistance of artificial intelligence and reviewed by the editorial team.







 English (US) ·