
 7 months ago
73
7 months ago
73
TLDR:
- Paradigm shows Polymarket’s OrderFilled events record both maker and taker sides, inflating reported trading activity.
- Volume dashboards misread redundant event logs, causing routine trades to appear far larger than the actual economic flows.
- Split and merge mechanics generate asymmetric USD movements, yet contract volume remains equal across makers and takers.
- Paradigm recommends using one-sided metrics, which align with prediction-market standards and prevent inflated volume charts.
Growing concerns around Polymarket’s trading data resurfaced this week after new research claimed that widely circulated volume figures may be structurally overstated.
Paradigm’s analysis, based on a full review of Polymarket’s event logs, market structure, and smart contracts, found that many dashboards and commentators have unintentionally been recording twice the actual activity.
found a pretty major data bug
it turns out almost every major dashboard has been double-counting Polymarket volume (not related to wash trading)
this is because Polymarket's onchain data contains redundant representations of each trade. receipts  pic.twitter.com/rQJEzs2Rfl
— storm (@notnotstorm) December 8, 2025
The report stresses that this is not manipulation by Polymarket but a result of misinterpreting how the platform emits on-chain trade events.
According to Paradigm, the core issue stems from the common practice of summing all OrderFilled events.
Because each trade generates two representations—one for the maker side and one for the taker side—the totals appear inflated. A routine $4.13 YES sale, for example, registers as $8.26 on dashboards using this method.
Paradigm states that the event structure is legitimate and consistent with the platform’s matching engine, yet the accounting method used by most analysts has been producing misleading volume figures.
Event Design Creates Misleading Totals Across Dashboards
Paradigm explains that Polymarket transactions follow a strict pattern: each contains several maker-side OrderFilled events, one taker-side OrderFilled event, and a final OrdersMatched event.
All describe the same underlying fills, but many dashboards treat them as separate trades. Each trade involves a single taker and at least one maker, yet the event structure emits redundant data across both sides of the transaction. This is the origin of the double counting.
Complicating matters further, Polymarket’s dual-token structure—YES and NO shares—enables swap, split, and merge operations within a single transaction.
 source- Paradigm
These mechanics allow traders to close or create open interest through YES-NO conversions inside the Conditional Tokens vault.
Paradigm notes that during some multi-leg transactions, the maker and taker can experience very different USD flows despite exchanging the same number of contracts. Dashboards that total both sides capture these asymmetric flows and record them as independent trade volume.
One example highlighted by Paradigm appears on Polygonscan with a displayed “Place Bet of $28.41.”
Despite this small taker-side YES sale, the transaction recorded more than $6,780 of maker-side NO activity. The platform performed a merge inside the contract, converting YES and NO positions into USDC and redistributing the proceeds. Because both sides of the match were emitted separately, naïve summations produced nearly $6,900 in reported volume.
Paradigm emphasizes that Polymarket’s exchange contracts operate purely as routers.
They hold no inventory, assume no risk, and are not counterparties. The redundant emissions are intentional for clarity on the frontend, yet they produce exaggerated totals when aggregated without filtering.
Paradigm Outlines Correct Approaches for Measuring Real Volume
Paradigm’s investigation identifies eight trade types spanning swaps, splits, and merges.
Each trade type affects balances and open interest differently, but all share a single economic reality: the taker and maker exchange equal contract quantities, even if their USD deltas differ. This is why contract-based notional volume remains consistent and unaffected by the split/merge mechanics.
For cash-flow volume, Paradigm recommends using one-sided measurements. Analysts may rely on taker-side USD flow, maker-side USD flow, or an average of the two.
 Source: Paradigm
When aggregated over days or months, these metrics converge, producing figures roughly half the size of the inflated OrderFilled totals.
Paradigm points to monthly dashboards reporting more than $2.5 billion in activity for late 2024—numbers that align with double-counted datasets rather than true economic volume.
The corrected method uses simple filtering. Taker-side volume comes from OrderFilled events where the taker address belongs to the CTF or NegRisk exchange contract.
Maker-side volume is captured by filtering events where the taker field is any other address. When applied consistently, these metrics align with standard prediction market accounting and avoid distorted comparisons across platforms.
Paradigm’s review concludes that Polymarket’s figures are not fabricated but widely misinterpreted. The findings place renewed pressure on data providers to correct their dashboards and adopt consistent one-sided volume metrics to reflect actual trading activity.
The post Are Polymarket’s Trading Figures Being Fabricated? Paradigm Weighs In appeared first on Blockonomi.


 English (US) ·
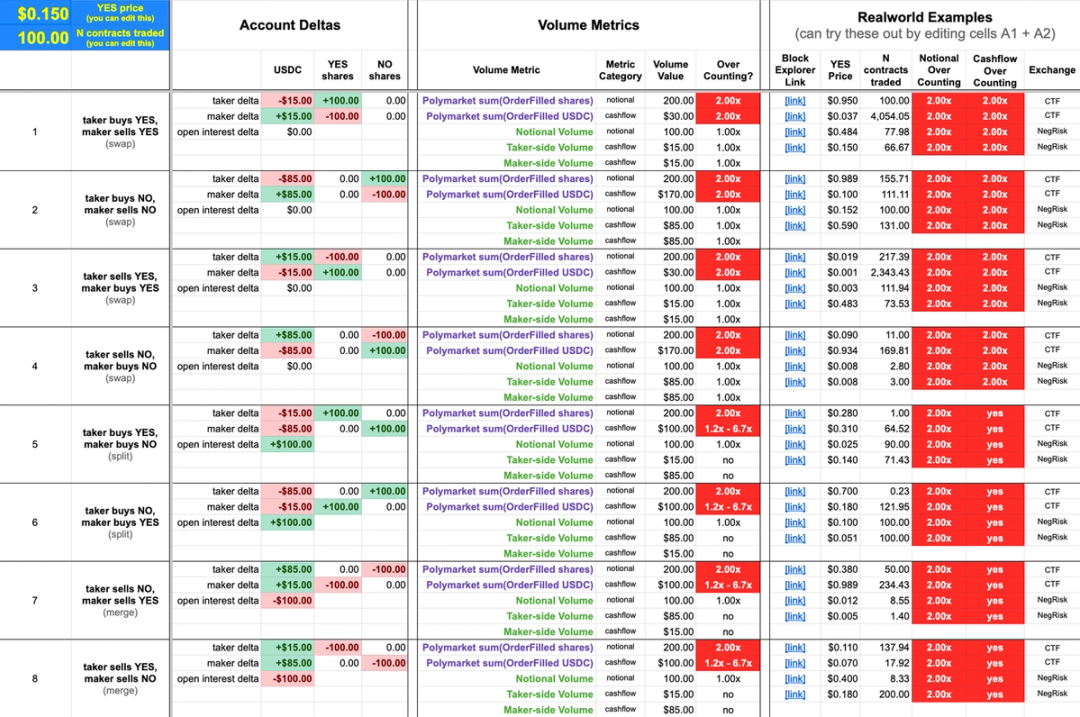