Oct 17, 2025 at 16:42 // Price
Coinidol.com: the price of Avalanche (AVAX) has made another attempt to resume its bearish trend.
Avalanche price long-term analysis: bearish
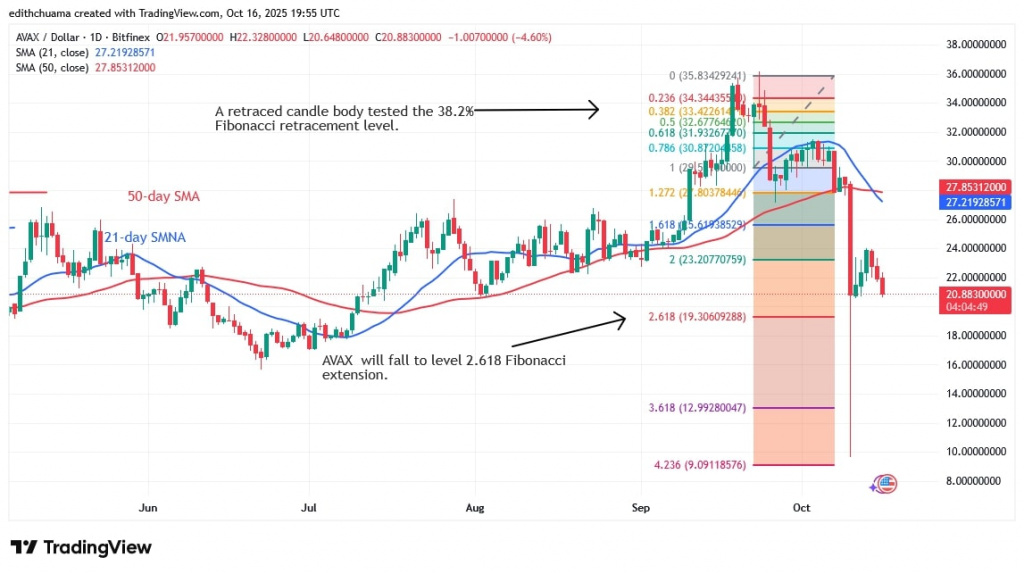
On October 10, the cryptocurrency dropped and surpassed the predicted price level, reaching a low of $9.65. Bulls bought the dips and pushed the price above the $20 support. The price then rose but was capped at a high of $24. If the $20 support is broken, the altcoin's value could fall to $19 and $15.65. If the support holds, the altcoin will be forced to trade between the $20 support and the moving average lines. AVAX is currently at $19.82.
Technical Indicators:
-
Resistance Levels – $60 and $70
-
Support Levels – $30 and $20
Avalanche indicator analysis
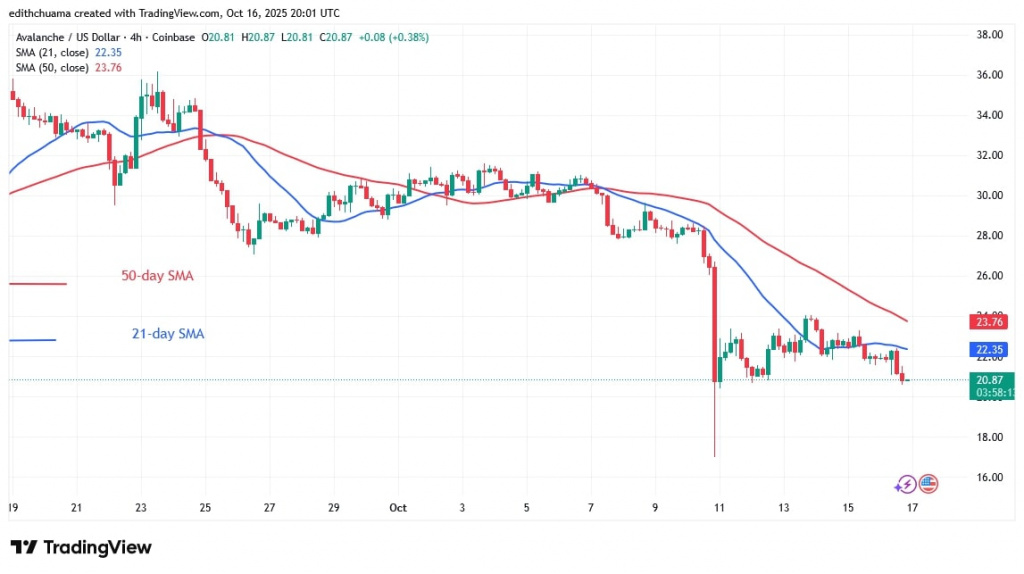
The 21-day SMA is falling below the 50-day SMA, indicating a decline in the cryptocurrency. On the 4-hour chart, the price bars are below the downward-sloping moving averages. A Doji candlestick suggests that the altcoin will move within a range.

AVAX/USD daily chart - October 16, 2025
What is the next direction for Avalanche?
The AVAX price has begun to move sideways as it remains above the $20 support level. On the 4-hour chart, the altcoin oscillates between the $20 support and the $24 high. AVAX is trading within this narrow range as it returns to the current support. The price is fluctuating as it approaches the $20 support.

AVAX/USD 4-hour chart - October 16, 2025
Disclaimer. This analysis and forecast are the personal opinions of the author. The data provided is collected by the author and is not sponsored by any company or token developer. This is not a recommendation to buy or sell cryptocurrency and should not be viewed as an endorsement by Coinidol.com. Readers should do their research before investing in funds.

 1 week ago
9


 English (US) ·