
 1 month ago
24
1 month ago
24
The Avalanche price is, as of 16 June 2026, at one of the most delicate points of recent months. The AVAX quotation is hovering around $6.92: an asset exhausted in the long term, but attempting a reaction in the short term. Not a reversal, for now.
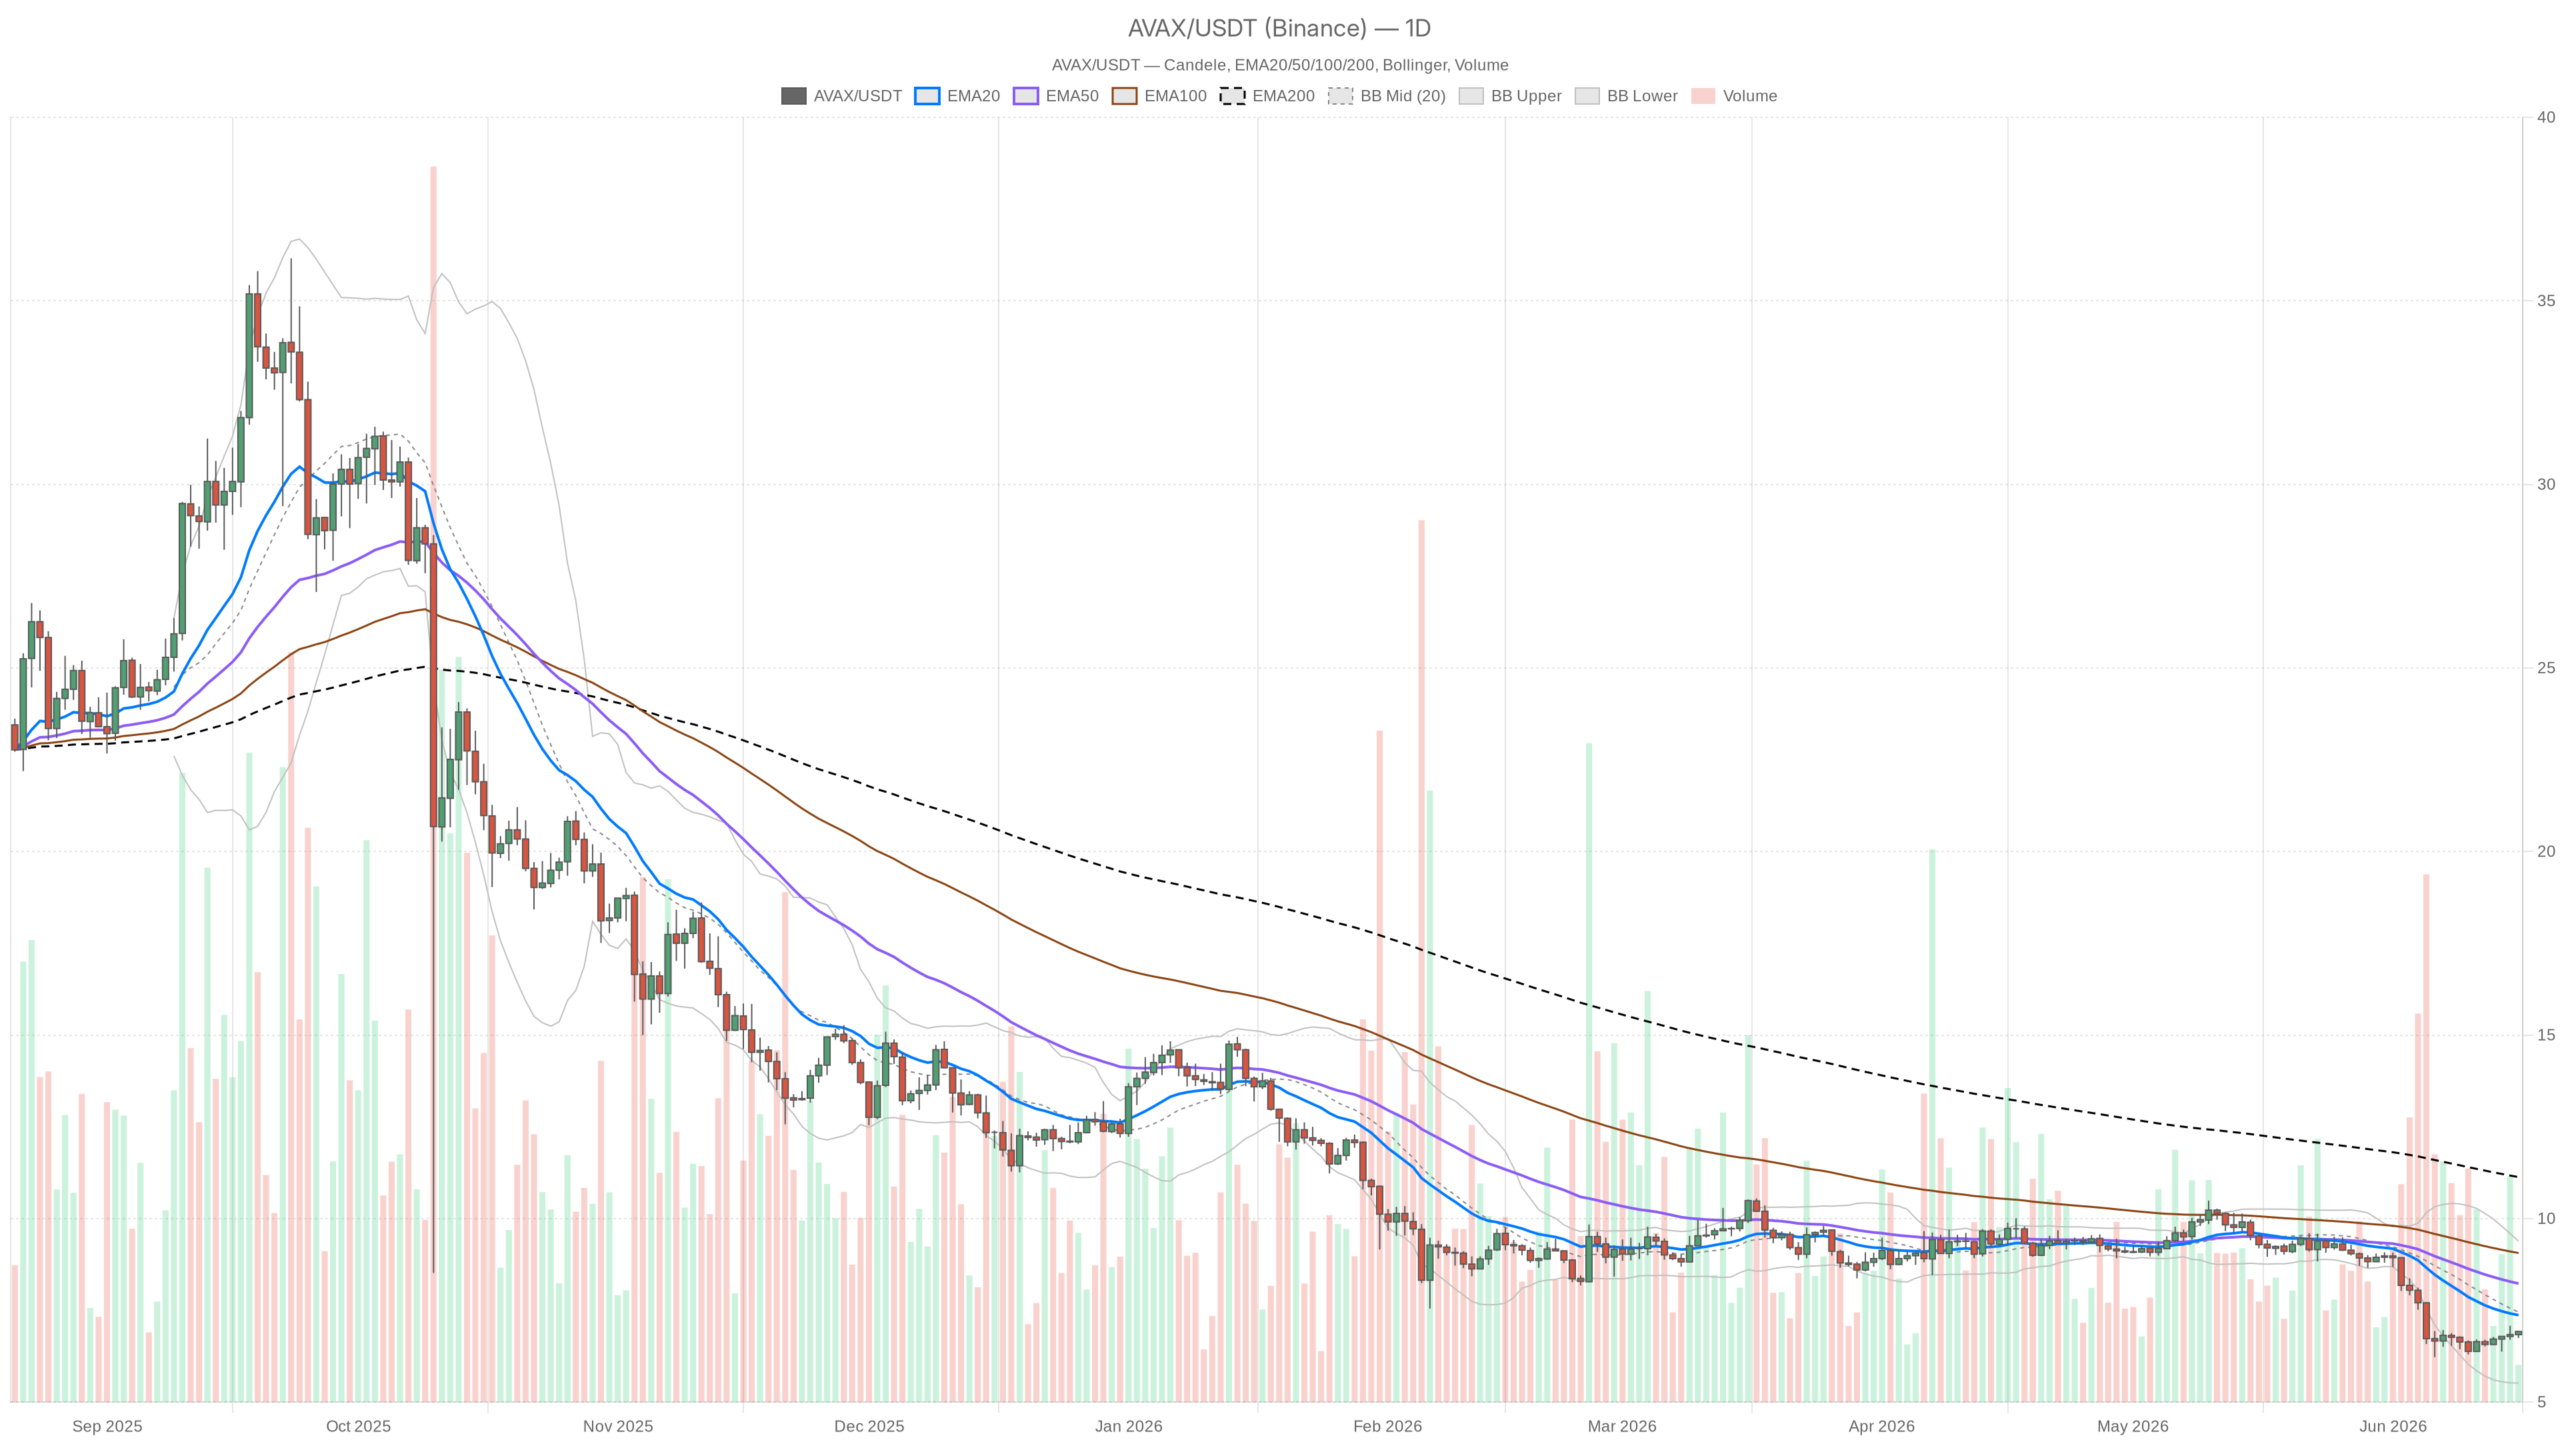 AVAX/USDT — daily chart with candles, EMA20/EMA50 and volumes.
Key points
- AVAX is trading below the EMA20 (7.37), EMA50 (8.23) and EMA200 (11.13) on the daily chart.
- The daily RSI at 34.23 is close to the oversold threshold without having reached it yet.
- On the hourly timeframe the regime is bullish, with the price above the three converging EMAs in the 6.80–6.86 area.
- The key resistance for a change in structure is the daily EMA20 at $7.37; the critical support is at $5.52.
- The Fear & Greed Index is at 23, in extreme fear territory.
The dominant force on the daily chart is clearly bearish. This is not an opinion: AVAX is trading below all the main moving averages, in a regime in which sellers have systematically prevailed in recent weeks. The macro context does not help. The Fear & Greed Index stands at 23, extreme fear territory. In addition, Bitcoin dominance at 56.5% indicates that capital continues to seek refuge in the sector’s main asset rather than rotating into altcoins.
The daily structure: bearish pressure without reversal
The daily structure of AVAX is unequivocally bearish. The arrangement of the exponential moving averages leaves no doubt: the EMA20 is at 7.37, the EMA50 at 8.23 and the EMA200 even at 11.13. The current price at 6.92 is pinned below all three of these references, and the distance from the EMA200 — almost 38% above the current price — describes a long-term structure that is deeply compromised. It is not a gap that can be closed in a few days of rebound.
In this framework, the daily RSI at 34.23 is an interesting detail: we are close to the oversold threshold, without having formally reached it yet. This means that technically there is still room for further deterioration before the market considers itself exhausted on the downside. It is not a buy signal — it is a warning that selling pressure has left its mark, but may not yet be completely exhausted.
The daily MACD shows a slowly improving situation: the line at -0.61 is still below zero, but the histogram at +0.02 suggests that the negative divergence is easing. This is the kind of signal that, taken alone, is not enough to justify a long operation. However, in the right context it could indicate that the worst of the bearish pressure is approaching its end. To be monitored, not anticipated.
At the same time, the Bollinger Bands on the daily chart draw a range between 5.52 and 9.38, with the price positioned in the lower half of the band. The dynamic support of the lower band at 5.52 is the main downside reference: an approach to that area without holding would definitively close any short-term rebound scenario. The daily ATR at 0.44 indicates contained but not absent volatility — daily moves of 40–45 cents remain the norm.
The hourly timeframe: the small light in the tunnel
On the hourly timeframe the picture is different: here the regime is bullish. The price at 6.93 is above the EMA20 (6.86), EMA50 (6.80) and EMA200 (6.80) — all converging in a narrow area that acts as dynamic support. This type of compression on the hourly averages, with the price above, is often the prelude to an attempt at extension.
The 1-hour RSI at 58.71 shows positive momentum without excesses. There is room before overbought, and the hourly MACD — with line and signal both at 0.02 and a flat histogram — confirms a situation of precarious balance. That said, there is no thrust, but there is also no active distribution. The AVAX market on the hourly chart seems to be waiting for a trigger.
Consequently, the hourly pivots are very tight: the pivot point at 6.93, R1 at 6.94 and S1 at 6.92. A compression of just two cents. We are exactly above a key level, with forces in balance. The resolution of this compression will determine the movement in the coming hours.
The 15-minute chart: immediate caution signal
On the 15-minute chart, the price has already touched the upper Bollinger Band at 6.93 — coinciding with the current price. The short-term RSI is at 70.6, technically in overbought territory. This is not necessarily an immediate sell signal, but it is a warning bell for those considering a long entry at this moment: the price has already run in the short term, and a technical pullback towards 6.85–6.86 would be anything but surprising.
In addition, the 15-minute MACD shows a positive histogram at 0.02, with the line having already crossed the signal upwards. Momentum exists, but according to the available data the acceleration is already in an advanced phase on this specific timeframe.
Bullish scenario: what is needed to change the picture
For the Avalanche price to turn the current rebound into something structurally significant, it first needs to reclaim the daily EMA20 at $7.37. Not an intraday touch — a daily close above that level, preferably with volume. That recovery would open the way towards 8.00–8.23, where the EMA50 represents the real resistance of the ongoing bearish cycle.
In any case, the invalidation scenario for this hypothesis is simple: a daily candle that closes below 6.52 would put the price back on the trajectory towards $5.52, the support of the lower Bollinger Band. That level represents the critical threshold below which AVAX’s technical structure would deteriorate further.
Bearish scenario: the rebound trap
The concrete risk is that the current hourly move is exactly what it looks like on the daily chart: a technical reaction in a bearish trend. AVAX has already experienced similar rebounds in previous weeks, only to give up ground again. With the daily EMA200 above 11%, the Avalanche market is structurally in a phase of distribution or deep accumulation — and distinguishing between the two requires confirmations that are currently lacking.
The most immediate bearish trigger is the failure to break through $7.00–$7.10 in the coming sessions. If the price fails to convincingly break that psychological and technical resistance, the risk of a return below $6.80 increases significantly. DeFi data on Avalanche — collected by DefiLlama — show fees on the main DEXs with negative 7-day changes on almost all key protocols (Pharaoh CL -57%, Joe V2.2 -43%), a sign that on-chain activity is not supporting a recovery narrative.
How to read this moment
The honest reading of the current context is this: Avalanche is in a long-term bearish trend with a small technical rebound underway on the shorter timeframes. The conflict between the bearish daily and the bullish hourly is not a paradox — it is the norm during rebound phases within a downtrend. Those operating in the short term must deal with a 15-minute RSI already in saturated territory and compressed pivots that do not offer much directional room.
Ultimately, the most dangerous false signal at this moment would be to interpret the hourly rebound as a reversal. It is not, not yet. A convincing daily close above 7.37 is needed to start talking about a regime change. Until then, Avalanche’s value remains technically vulnerable, and any long position requires risk management proportional to the still heavy structure that the daily chart highlights.
FAQ
What is the key level for a bullish reversal of AVAX?
The decisive level is the daily EMA20 at $7.37. A daily close above this reference is needed, preferably accompanied by an increase in volumes. Only then can we talk about a possible regime change. The EMA50 at 8.23 represents the next resistance.
What does AVAX’s daily RSI at 34.23 indicate?
The RSI at 34.23 indicates that the market is close to the oversold threshold, conventionally set at 30. This means that bearish pressure has been intense but may not yet be completely exhausted. It is not an automatic buy signal: there is still room for further deterioration before a complete exhaustion of sellers.
Why is the hourly rebound not considered a reversal?
The rebound on the hourly timeframe fits within a structurally bearish daily trend. AVAX is trading below all the main moving averages on the daily chart and the 38% distance from the EMA200 describes a compromised long-term structure. In the absence of confirmations — such as a daily close above $7.37 — the hourly move remains classifiable as a technical reaction, not as a reversal.
{“@context”:”https://schema.org”,”@type”:”FAQPage”,”mainEntity”:[{“@type”:”Question”,”name”:”What is the key level for a bullish reversal of AVAX?”,”acceptedAnswer”:{“@type”:”Answer”,”text”:”The decisive level is the daily EMA20 at $7.37. A daily close above this reference is needed, preferably accompanied by an increase in volumes. Only then can we talk about a possible regime change. The EMA50 at 8.23 represents the next resistance.”}},{“@type”:”Question”,”name”:”What does AVAX’s daily RSI at 34.23 indicate?”,”acceptedAnswer”:{“@type”:”Answer”,”text”:”The RSI at 34.23 indicates that the market is close to the oversold threshold, conventionally set at 30. This means that bearish pressure has been intense but may not yet be completely exhausted. It is not an automatic buy signal: there is still room for further deterioration before a complete exhaustion of sellers.”}},{“@type”:”Question”,”name”:”Why is the hourly rebound not considered a reversal?”,”acceptedAnswer”:{“@type”:”Answer”,”text”:”The rebound on the hourly timeframe fits within a structurally bearish daily trend. AVAX is trading below all the main moving averages on the daily chart and the 38% distance from the EMA200 describes a compromised long-term structure. In the absence of confirmations — such as a daily close above $7.37 — the hourly move remains classifiable as a technical reaction, not as a reversal.”}}]}
Disclaimer: This article is for informational purposes only and does not constitute financial advice, investment recommendation or a solicitation to buy or sell financial instruments or cryptocurrencies. The analyses do not guarantee future results. Investments in crypto-assets and financial markets involve a high risk of capital loss. Always do your own research (DYOR) and consult a qualified financial advisor before making any decision.
Content created with the assistance of artificial intelligence and with human editorial review.


 English (US) ·