
 5 hours ago
15
5 hours ago
15

As of July 24, 2026, ZEC finds itself in an uncomfortable spot — not in freefall, but not in recovery either. At $494.59 against USDT, Zcash crypto sits wedged between a daily structure that refuses to fully break down and an intraday tape that keeps rejecting meaningful bounces.
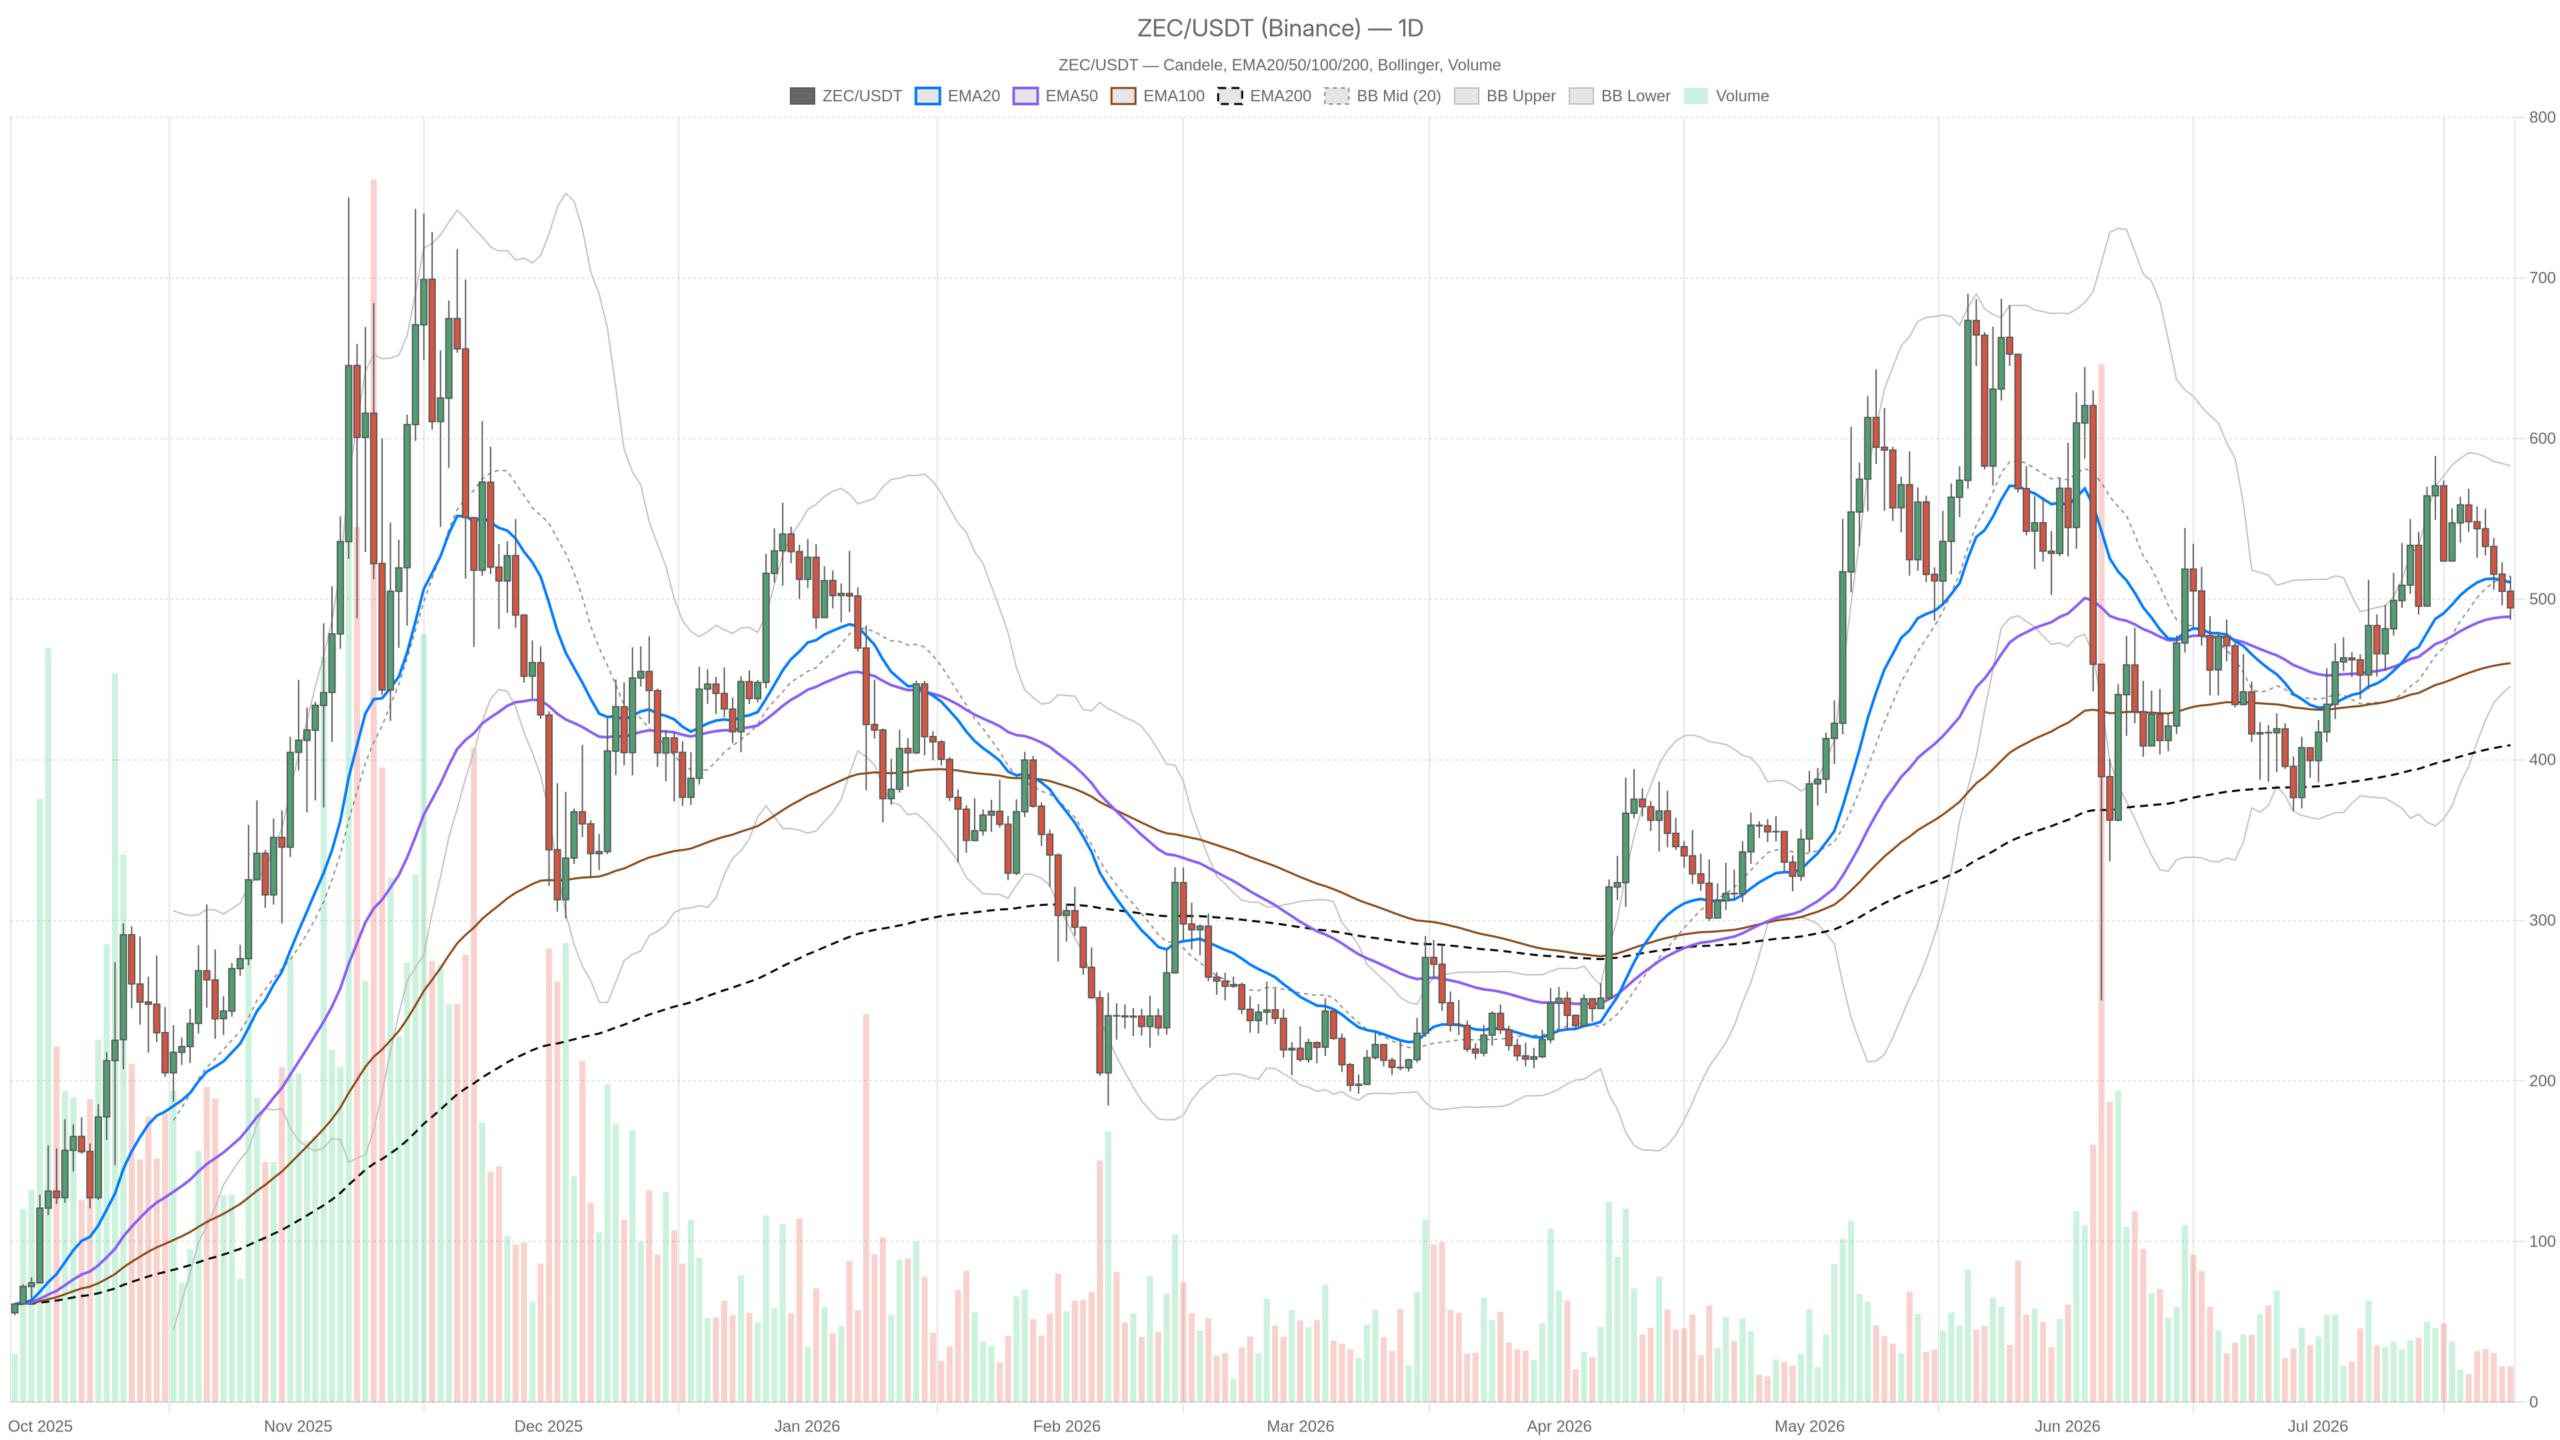 ZEC/USDT — daily chart with candlesticks, EMA20/EMA50 and volume.
Key takeaways
- ZEC trades at $494.59, below its 20-day EMA ($510.36) but above the 50-day EMA ($489.04)
- Daily MACD histogram at -4.97 signals eroding momentum, with the gap between the MACD line and signal line widening
- The Fear & Greed Index at 28 places the market firmly in defensive territory
- All intraday EMAs are stacked above price, confirming bearish control on shorter timeframes
- A break below $491.60 (1H lower Bollinger Band) would open the path toward daily S1 at $483.05
The Daily Regime: Neutral on Paper, Uncomfortable in Practice
The daily chart for ZEC is officially neutral, but the positioning between two key moving averages reveals mounting tension rather than calm. ZEC closed at $494.59, sitting below its 20-day EMA at $510.36 but above its 50-day EMA at $489.04. That sandwich between two short-term averages is the visual definition of indecision. The longer-term 200-day EMA at $409.08 remains well below price, confirming the broader macro trend is still constructive.
The daily MACD reinforces that read. The MACD line sits at 14.82 while the signal line is at 19.79, producing a histogram reading of -4.97. The gap between line and signal is widening in the wrong direction — momentum is eroding, not building. Moreover, the daily RSI of 48.2 sits right on the edge of neutral-to-weak, offering no evidence of buyers stepping in with conviction on this timeframe.
Bollinger Bands on the daily paint the range clearly: the midband at $514.38, upper band at $582.94, and lower band at $445.81. Price trading below the midband shifts the statistical center of gravity to the downside. However, the bands remain relatively wide, suggesting the market has not yet fully compressed into a decision. The daily ATR of 38.45 underscores that any directional move will carry meaningful weight.
Pivot Levels Telling a Quiet Story
The daily pivot at $498.66 acts as a bearish filter — price trading below it signals that sellers maintain the upper hand in the short term. With R1 resistance at $510.19 and S1 support at $483.05, ZEC’s position at $494.59 means the market is spending more time below its own equilibrium than above it. Reclaiming the $498–$510 zone would be the first structural requirement for any intraday recovery to register on a daily basis. Until that happens, short-term rallies remain suspect.
Intraday Structure: Bears Have the Wheel
On the 1-hour and 15-minute timeframes, ZEC’s bearish structure is unambiguous, with every meaningful moving average stacked above price. On the 1H chart, ZEC at $494.76 trades below its 20-hour EMA ($501.62), 50-hour EMA ($508.76), and 200-hour EMA ($526.12). The 1H RSI at 36.33 is approaching oversold territory but has not reached it yet. That distinction matters because it suggests there is still room to the downside before any technical bounce becomes compelling.
The 1H MACD is negative across the board — line at -4.31, signal at -3.41, and the histogram deepening at -0.90 — confirming momentum still points downward. Meanwhile, the 15-minute chart offers a faint glimmer: the MACD histogram has turned slightly positive at +0.53, suggesting the immediate selling pressure may be pausing. However, the 15M regime remains bearish, all three EMAs sit above price, and the RSI at 46.11 does not signal a reversal. At best, this is consolidation at the lows.
Bullish Scenario: What ZEC Needs to Pull It Off
The bull case requires ZEC to reclaim the daily pivot at $498.66 and push through the 20-day EMA at $510.36 — sequential confirmations that have not yet materialized. The foundation remains intact: ZEC trades well above its 200-day EMA at $409.08, and the daily structure has not broken down. The 1H RSI approaching oversold territory adds potential fuel, as markets do bounce from these levels when the daily is not in full breakdown mode. That said, the bullish thesis gets invalidated if price loses the 50-day EMA at $489.04 on a daily close.
Bearish Scenario: The Path of Least Resistance
The bearish scenario carries the most supporting evidence right now, with intraday momentum, market sentiment, and technical structure all pointing toward further downside. Every intraday moving average is stacked above price, the daily MACD histogram is negative and widening, and the broader market sits in Fear. Furthermore, the failure to hold above the daily pivot combined with a below-midband Bollinger reading creates an environment where rallies get sold.
If ZEC breaks the 1H lower Bollinger Band at $491.60, the next target becomes daily S1 at $483.05. A clean break below the 50-day EMA at $489.04 would shift the daily regime from neutral to bearish, opening the door toward $445. The bearish thesis is invalidated by a convincing daily close above the 20-day EMA at $510.36.
Positioning Context: What to Make of All This
ZEC sits at a frustrating crossroads where the macro uptrend and deteriorating intraday momentum pull in opposite directions, demanding patience from traders. The daily regime being neutral, however, is not reassuring — it is a coin-flip zone where the next sustained move could be sharp in either direction, given the daily ATR of $38.45. Anyone holding a long position must acknowledge that the burden of proof currently sits with the bulls. The intraday structure is bearish, sentiment is fearful, and high Bitcoin dominance does not favor altcoin outperformance in the near term.
The DeFi activity data — with Uniswap V3 fees down 12.05% in a single day, even as volume change runs positive — hints at a market where on-chain activity is choppy rather than trending. In turn, this tends to correlate with directionless price action in mid-cap assets like ZEC. For those tracking Zcash crypto, the $489–$498 zone is the battlefield right now. How ZEC closes on the daily over the next one to two sessions will likely determine whether this is a healthy consolidation or the beginning of a more meaningful corrective move toward the $445–$460 region.
FAQ
What is the current price of ZEC and how is it positioned on the daily chart?
As of July 24, 2026, ZEC trades at $494.59 against USDT. On the daily timeframe, it sits below its 20-day EMA ($510.36) but above its 50-day EMA ($489.04), creating a neutral but tense positioning between two key short-term moving averages.
What are the most important support levels for ZEC right now?
The critical near-term support is the 1H lower Bollinger Band at $491.60. Below that, daily S1 at $483.05 and the 50-day EMA at $489.04 form the next line of defense. A breakdown below these levels would expose the lower daily Bollinger Band near $445.
What would confirm a bullish reversal for ZEC?
A bullish reversal requires ZEC to reclaim the daily pivot at $498.66 on a closing basis, followed by a push through the 20-day EMA at $510.36. Improving RSI above 50 and a MACD histogram turning positive would provide additional confirmation.
What market conditions are weighing on ZEC’s performance?
The Fear & Greed Index at 28 reflects a defensive market, while Bitcoin dominance at 56.55% absorbs capital that might otherwise flow into altcoins. Total market capitalization declining roughly 0.93% in 24 hours adds further headwinds for assets like ZEC.
Disclaimer: This article is for informational purposes only and does not constitute financial advice, an investment recommendation, or a solicitation to buy or sell any financial instrument or cryptocurrency. The analysis provided is not indicative of future results. Investing in crypto assets and financial markets carries a high risk of capital loss. Always do your own research (DYOR) and consult a qualified financial advisor before making any decision.
Article produced with the assistance of artificial intelligence and reviewed by the editorial team.







 English (US) ·