
 1 month ago
46
1 month ago
46

Bitcoin trades at $62,950 on July 13, 2026, with macro pressures mounting. The Fear & Greed Index sits at 28. Bitcoin at a crossroads: bears hold the structure while macro headwinds bite, forcing traders to weigh oversold technicals against a hostile macro backdrop.
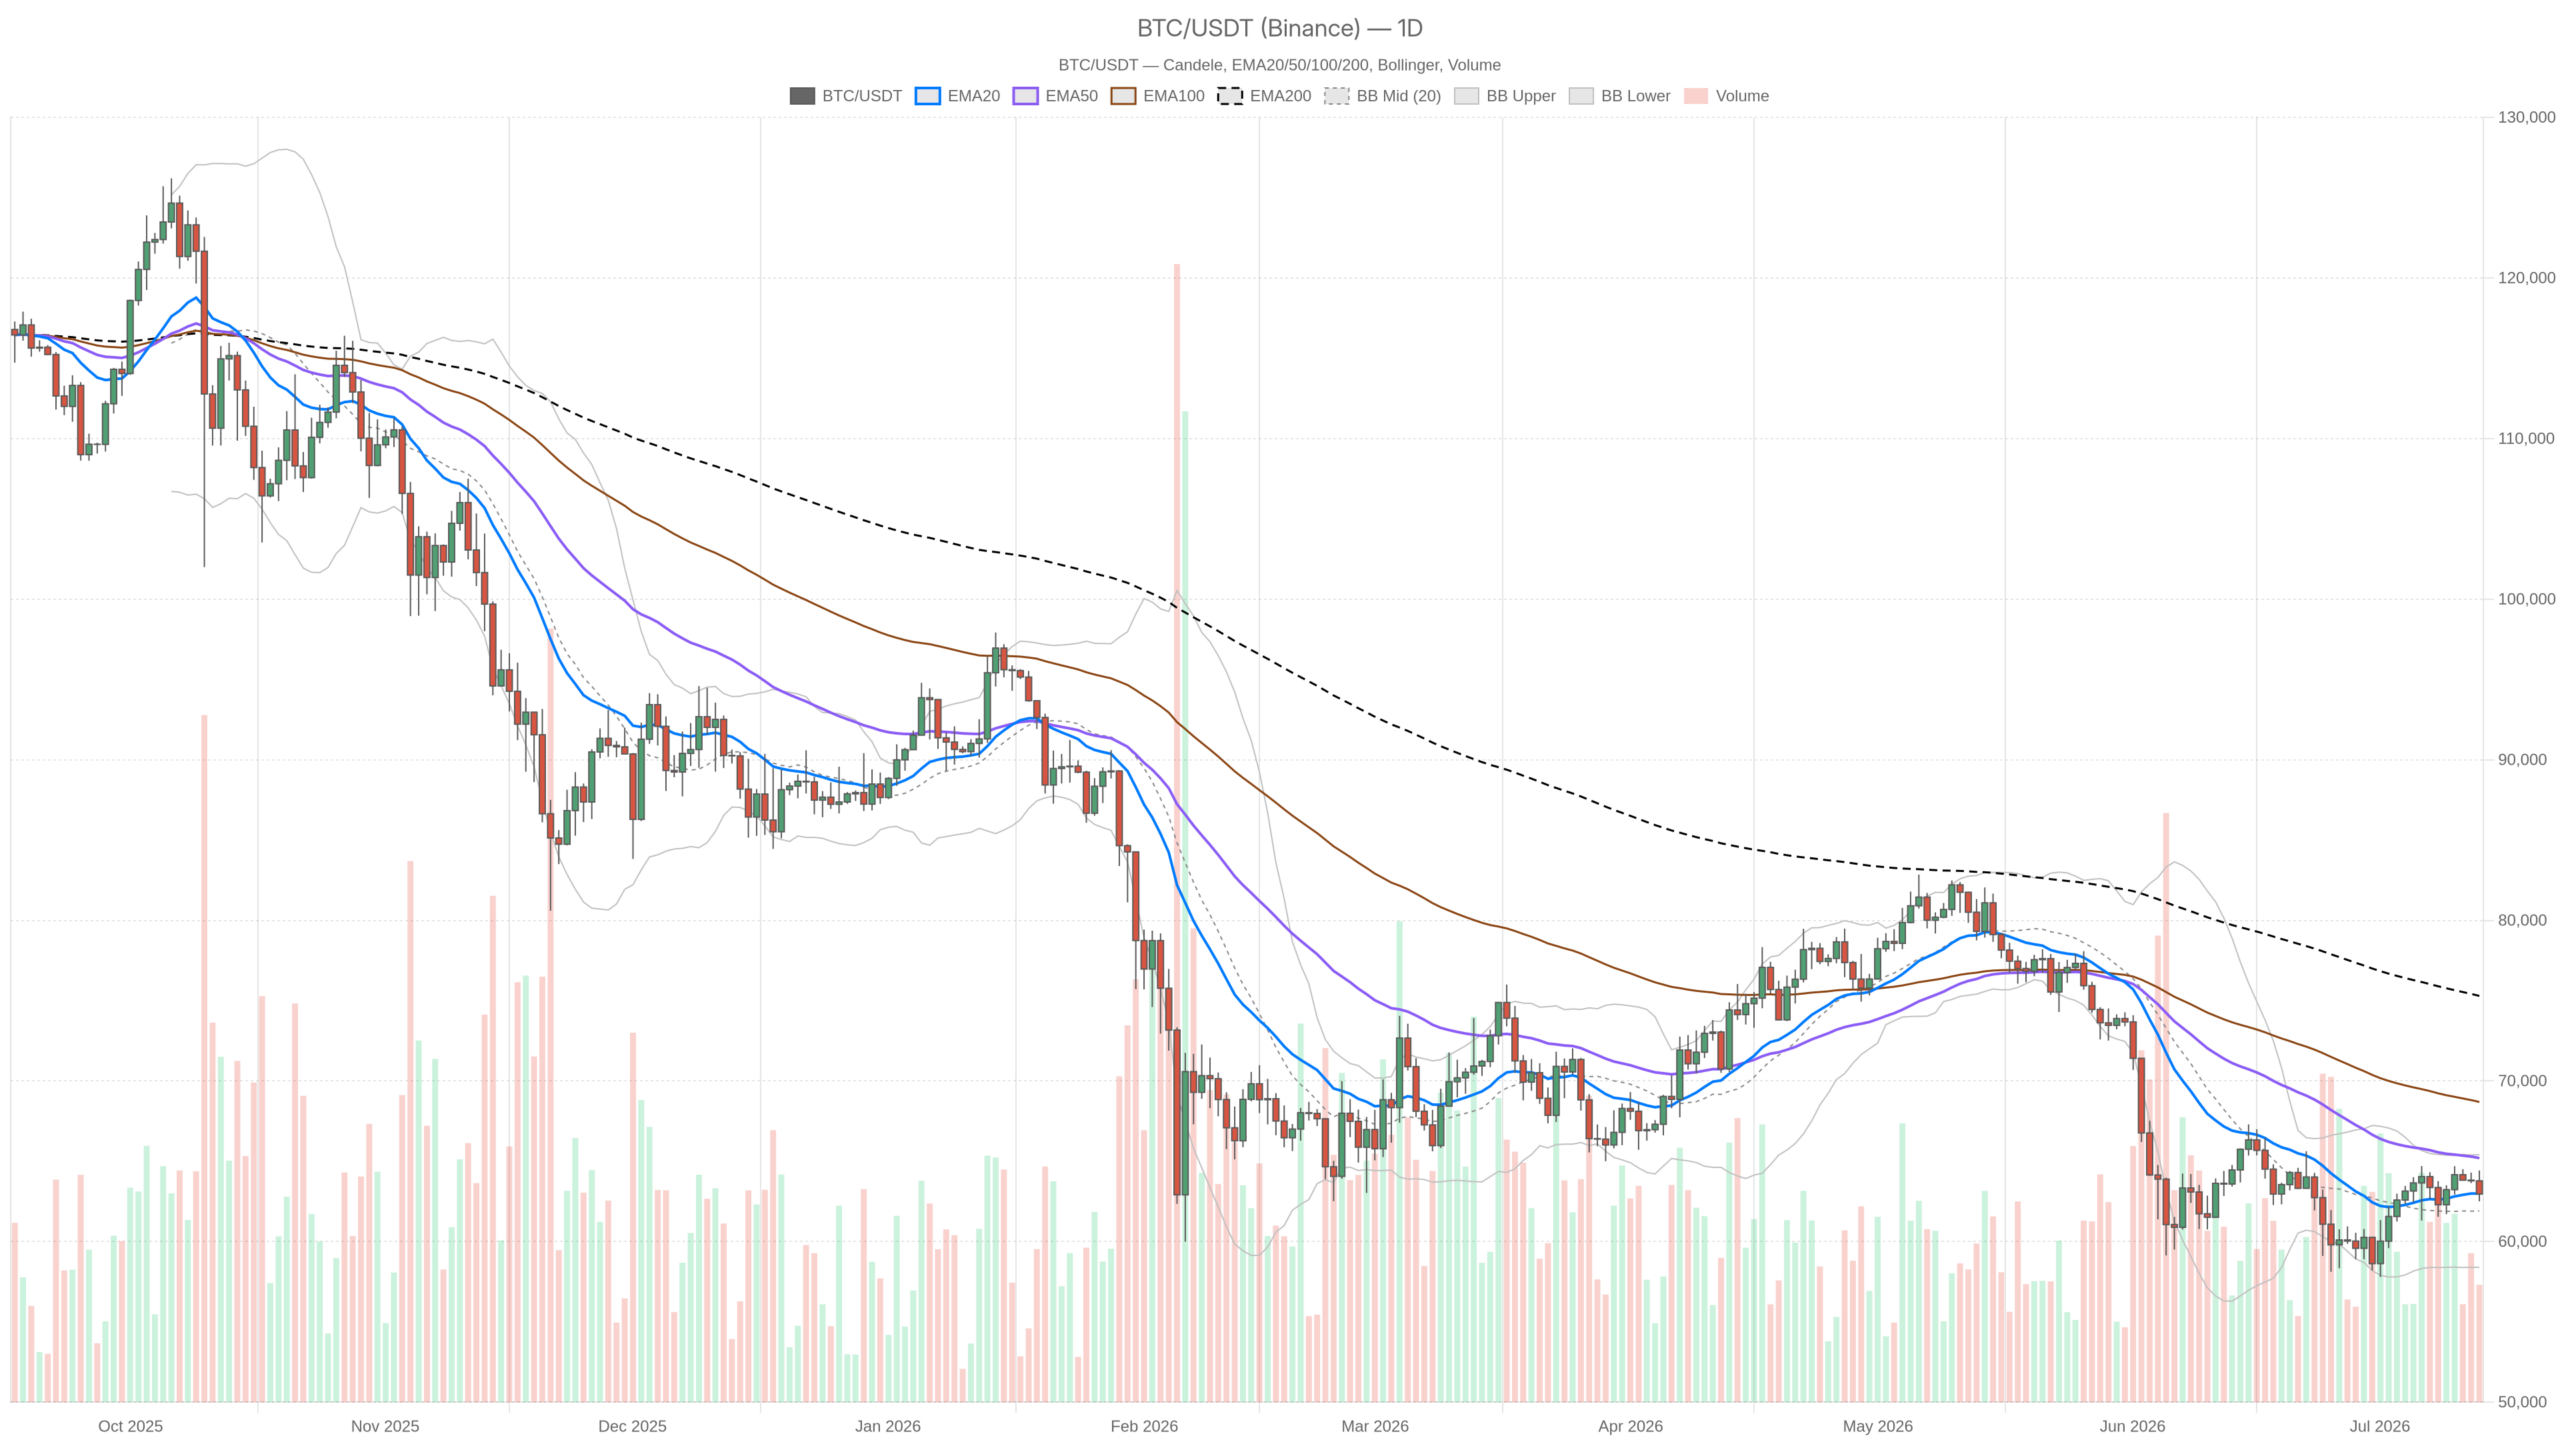 BTC/USDT — daily chart with candlesticks, EMA20/EMA50 and volume.
Key takeaways
- Bitcoin trades at $62,950 USDT with bearish structures on both daily and 15-minute timeframes
- The Fear & Greed Index at 28 signals deep fear; total crypto market cap sits at $2.25 trillion
- Daily pivot at $63,294 and S1 support at $62,164 define the near-term battleground
- MACD histogram prints a positive divergence at +440.26, hinting at slowing selloff momentum
- Bloomberg reports a fresh oil-price spike has revived inflation concerns, dragging BTC lower
Bitcoin Under Pressure as Inflation Fears Return
Bitcoin is under renewed selling pressure as an oil-price spike revives inflation fears, with both daily and 15-minute structures remaining bearish. The dominant force is a collision between an oversold short-term setup and a macro environment that keeps bleeding. Bloomberg reports that fresh oil-price gains have dragged BTC lower, reminding traders that crypto does not float in a vacuum.
The total crypto market cap sits at roughly $2.25 trillion, down 1.35% in 24 hours. Bitcoin dominance holds at 56.08%, signaling that altcoins are absorbing even more pain. The Fear & Greed Index at 28 places the market deep in Fear territory. That is the real context for everything that follows.
Daily Timeframe: The Macro Bias Is Still Bearish
The daily chart confirms sustained bearish momentum, with price below all three key EMAs and the RSI hovering just under neutral at 48.29. Price at $62,958 sits barely below the 20-day EMA at $62,987. However, the 50-day EMA at $65,197 and the 200-day EMA at $75,293 are both well above current levels, forming a stack of resistance that reveals the longer-term damage.
The daily RSI at 48.29 sits just below the neutral 50 level, keeping both sides guessing without triggering mean-reversion hunters. The MACD line at -220.62 remains negative, yet the histogram has printed a positive divergence at +440.26. This means the selloff momentum is slowing. That is not a buy signal; it is a warning to bears that the easy downside may be fading.
Bollinger Bands frame the range cleanly: mid-band at $61,903, upper band at $65,410, lower band at $58,396. Price trades between the mid and upper band, which in a downtrend tends to act as a ceiling. The ATR of $1,908 means any daily candle can swing nearly $2,000. The daily pivot sits at $63,294, with R1 at $64,088 and S1 at $62,164. Price is below the pivot — sellers have the first-mover advantage.
Hourly Structure: A Pause, Not a Pivot
The hourly timeframe has shifted to neutral but remains structurally weak, with price pinned below the 20, 50, and 200 EMAs. Price at $62,950 sits below the 20 EMA at $63,334, the 50 EMA at $63,644, and the 200 EMA at $63,149. That full EMA stack overhead is a compression zone price must crack before anyone can call this a recovery.
The hourly RSI at 37.6 approaches oversold territory without quite hitting it. There is room for one more flush before any meaningful bounce becomes technically justified. The hourly MACD histogram at -36.36 confirms the short-term trend remains negative. Bollinger Bands place the lower boundary at $62,347 — the next natural magnet if buyers continue to stay absent. The pivot cluster is tight: PP at $62,984, R1 at $63,101, S1 at $62,833.
15-Minute Frame: Where Execution Lives
The 15-minute chart remains bearish by regime classification, with price below all three EMAs. Price at $62,950 sits beneath the 20 EMA at $63,022, the 50 EMA at $63,190, and the 200 EMA at $63,713. One small concession to bulls exists: the 15m MACD histogram has ticked positive at +2.41. That signals a micro-momentum shift, but with an ATR of just $104, these are noise-level moves.
The RSI at 44.49 has room in both directions, offering no clear bias at this resolution. For anyone timing an entry, the 15-minute chart is only useful for confirming that the intraday drift has exhausted itself — not for calling a reversal. Position sizing must account for the fact that short-term signals in this regime frequently fail.
Bitcoin Analysis: The Two Scenarios That Actually Matter
Two scenarios define the outlook: a bullish reclaim above $63,294 or a bearish continuation toward the lower Bollinger Band at $58,396. Traders find Bitcoin at a crossroads: bears hold the structure while macro headwinds bite, and the resolution will emerge from whichever side breaks first.
The bullish case needs a daily close above the pivot at $63,294, with a reclaim of the 20-day EMA at $62,987 on a retest-and-hold basis. If that occurs, R1 at $64,088 becomes the first target. The upper Bollinger Band at $65,410 and the 50-day EMA at $65,197 form a meaningful resistance cluster above. The MACD histogram divergence supports this path as a possibility. However, a failure to hold $62,164 on any intraday dip would invalidate it.
The bearish case is simpler and more aligned with the Fear & Greed reading of 28 and the Bloomberg macro narrative. If BTC loses $62,164 on a daily close, the next landing zone is the lower Bollinger Band at $58,396. The distance is roughly $4,500 — more than two ATRs — so it will not happen in one session. Nevertheless, the path is clear: continued selling pressure with no macro relief. A credible macro shift, combined with an hourly close above the 200 EMA at $63,149, would challenge the bear case.
Reading the Room on Positioning
Elevated DEX fee activity amid falling prices suggests volatility-driven trading, with participants hedging and rotating rather than sitting still. Uniswap V3 fees surged +61.45% in a day and +138.14% over seven days, while Curve DEX spiked +98.29% on the day. That kind of fee activity in a falling market signals that traders are actively moving and repositioning.
It is not a bullish signal per se, but elevated DEX activity in Fear conditions can sometimes front-run a sentiment shift. Uniswap V4, by contrast, is down 11.59% over 30 days. That suggests the spike is short-term and reactive rather than structural. Meanwhile, the broader context remains cautious: daily structure is bearish, the macro backdrop is hostile, and sentiment is fearful.
Short-term momentum shows tentative signs of exhaustion, yet volatility remains the only certainty. The ATR alone — nearly $1,900 per day — should inform where risk is set. Watch the $63,294 pivot and the $62,164 support as the two lines that will define the next directional commitment from the market. Position sizing, not conviction, keeps traders in the game through conditions like these.
FAQ
What is driving Bitcoin’s current bearish pressure?
A fresh oil-price spike has revived inflation concerns, according to Bloomberg, dragging Bitcoin lower alongside broader risk assets. The daily structure remains bearish with price below all three key EMAs, while the Fear & Greed Index at 28 reflects deep market caution.
What are the key support and resistance levels to watch?
The daily pivot at $63,294 is the immediate resistance to reclaim for any bullish shift. Support sits at $62,164 (S1), with a breakdown targeting the lower Bollinger Band at $58,396. On the upside, R1 at $64,088 and the 50-day EMA at $65,197 form a resistance cluster.
Is there any bullish signal in the current market data?
The daily MACD histogram has printed a positive divergence at +440.26, indicating that selloff momentum is slowing. This is not a buy signal but suggests the easiest downside may be fading. A daily close above $63,294 would strengthen the bullish case meaningfully.
Disclaimer: This article is for informational purposes only and does not constitute financial advice, an investment recommendation, or a solicitation to buy or sell any financial instrument or cryptocurrency. The analysis provided is not indicative of future results. Investing in crypto assets and financial markets carries a high risk of capital loss. Always do your own research (DYOR) and consult a qualified financial advisor before making any decision.
Article produced with the assistance of artificial intelligence and reviewed by the editorial team.







 English (US) ·