
 2 months ago
37
2 months ago
37
The Bitcoin (BTC) price reached a new yearly high yesterday but fell slightly today.
The price broke out from a long-term horizontal resistance area, the final one before the all-time high price.
Bitcoin Moves Above Resistance
The technical analysis of the weekly time frame shows the BTC price has increased since the start of 2023, accelerating its rate of increase in October. In January 2024, the price reached a high of $48,970 but was rejected, creating a bearish candlestick (red icon). The rejection validated a horizontal and Fib resistance level.
However, BTC has regained its footing in the past four weeks, creating several weekly bullish candlesticks and closing above the confluence of resistance levels. Yesterday, the BTC price reached a new yearly high of $52,816.
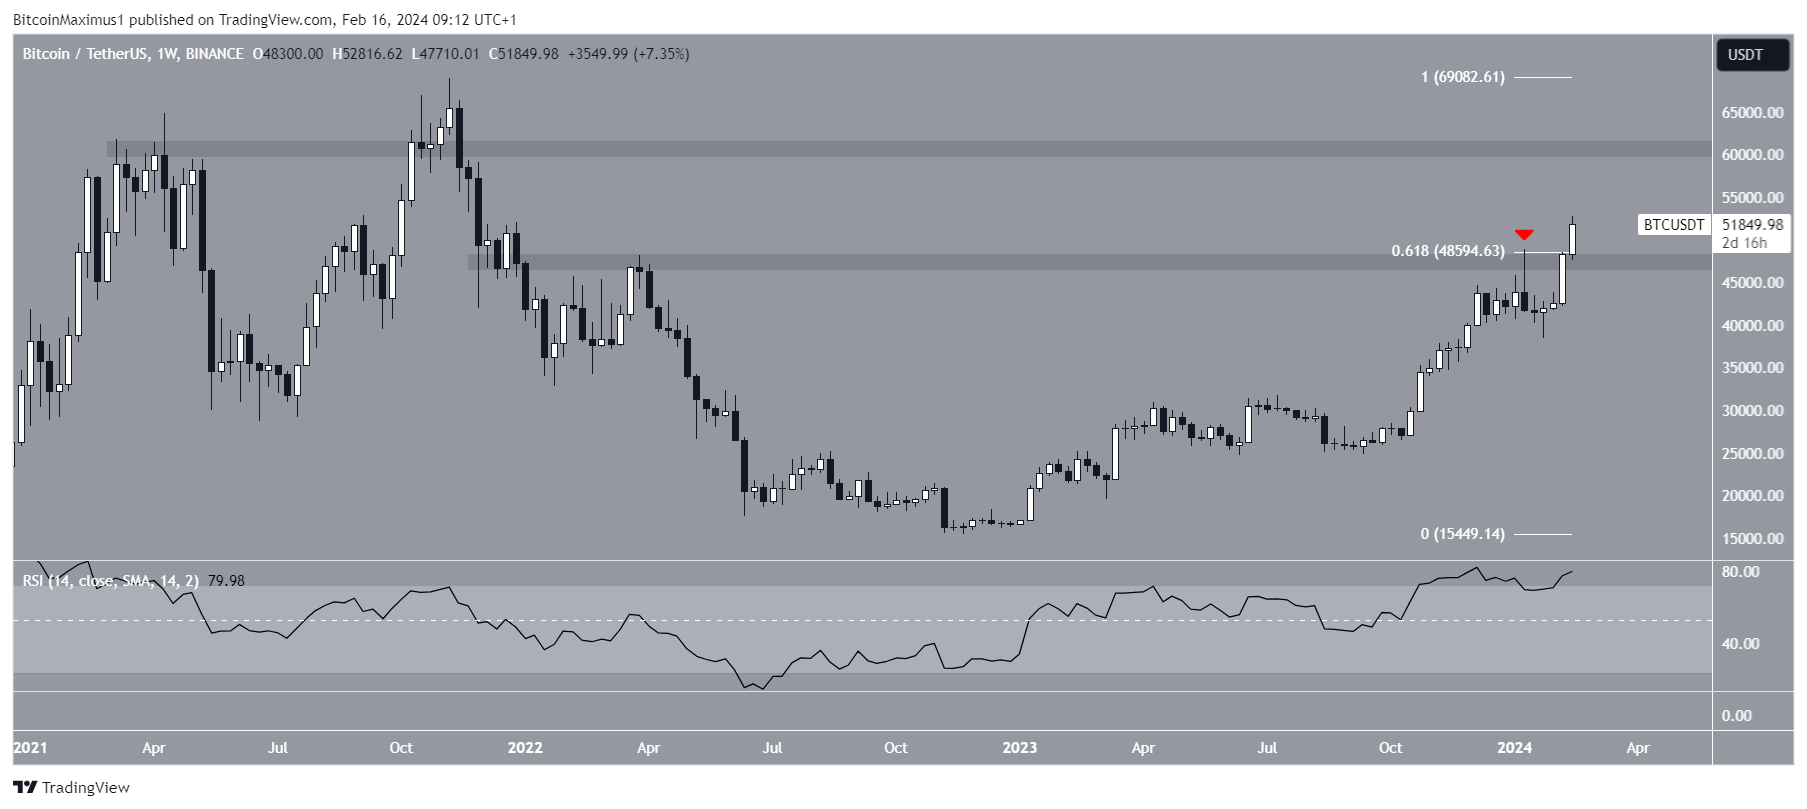 BTC/USDT Weekly Chart. Source: TradingView
The weekly Relative Strength Index (RSI) gives a bullish reading. Market traders use the RSI as a momentum indicator to identify overbought or oversold conditions and to decide whether to accumulate or sell an asset.
Readings above 50 and an upward trend indicate that bulls still have an advantage, whereas readings below 50 suggest the opposite. The weekly RSI has increased above 70, a sign of a bullish trend.
Read More: Where To Trade Bitcoin Futures
What Are Analysts Saying?
Cryptocurrency traders and analysts on X positively view the future BTC trend.
XForceGlobal uses Elliott Wave Theory to predict another high on BTC. Technical analysts employ the Elliott Wave theory to identify recurring long-term price patterns and investor psychology, which helps them determine the direction of a trend.
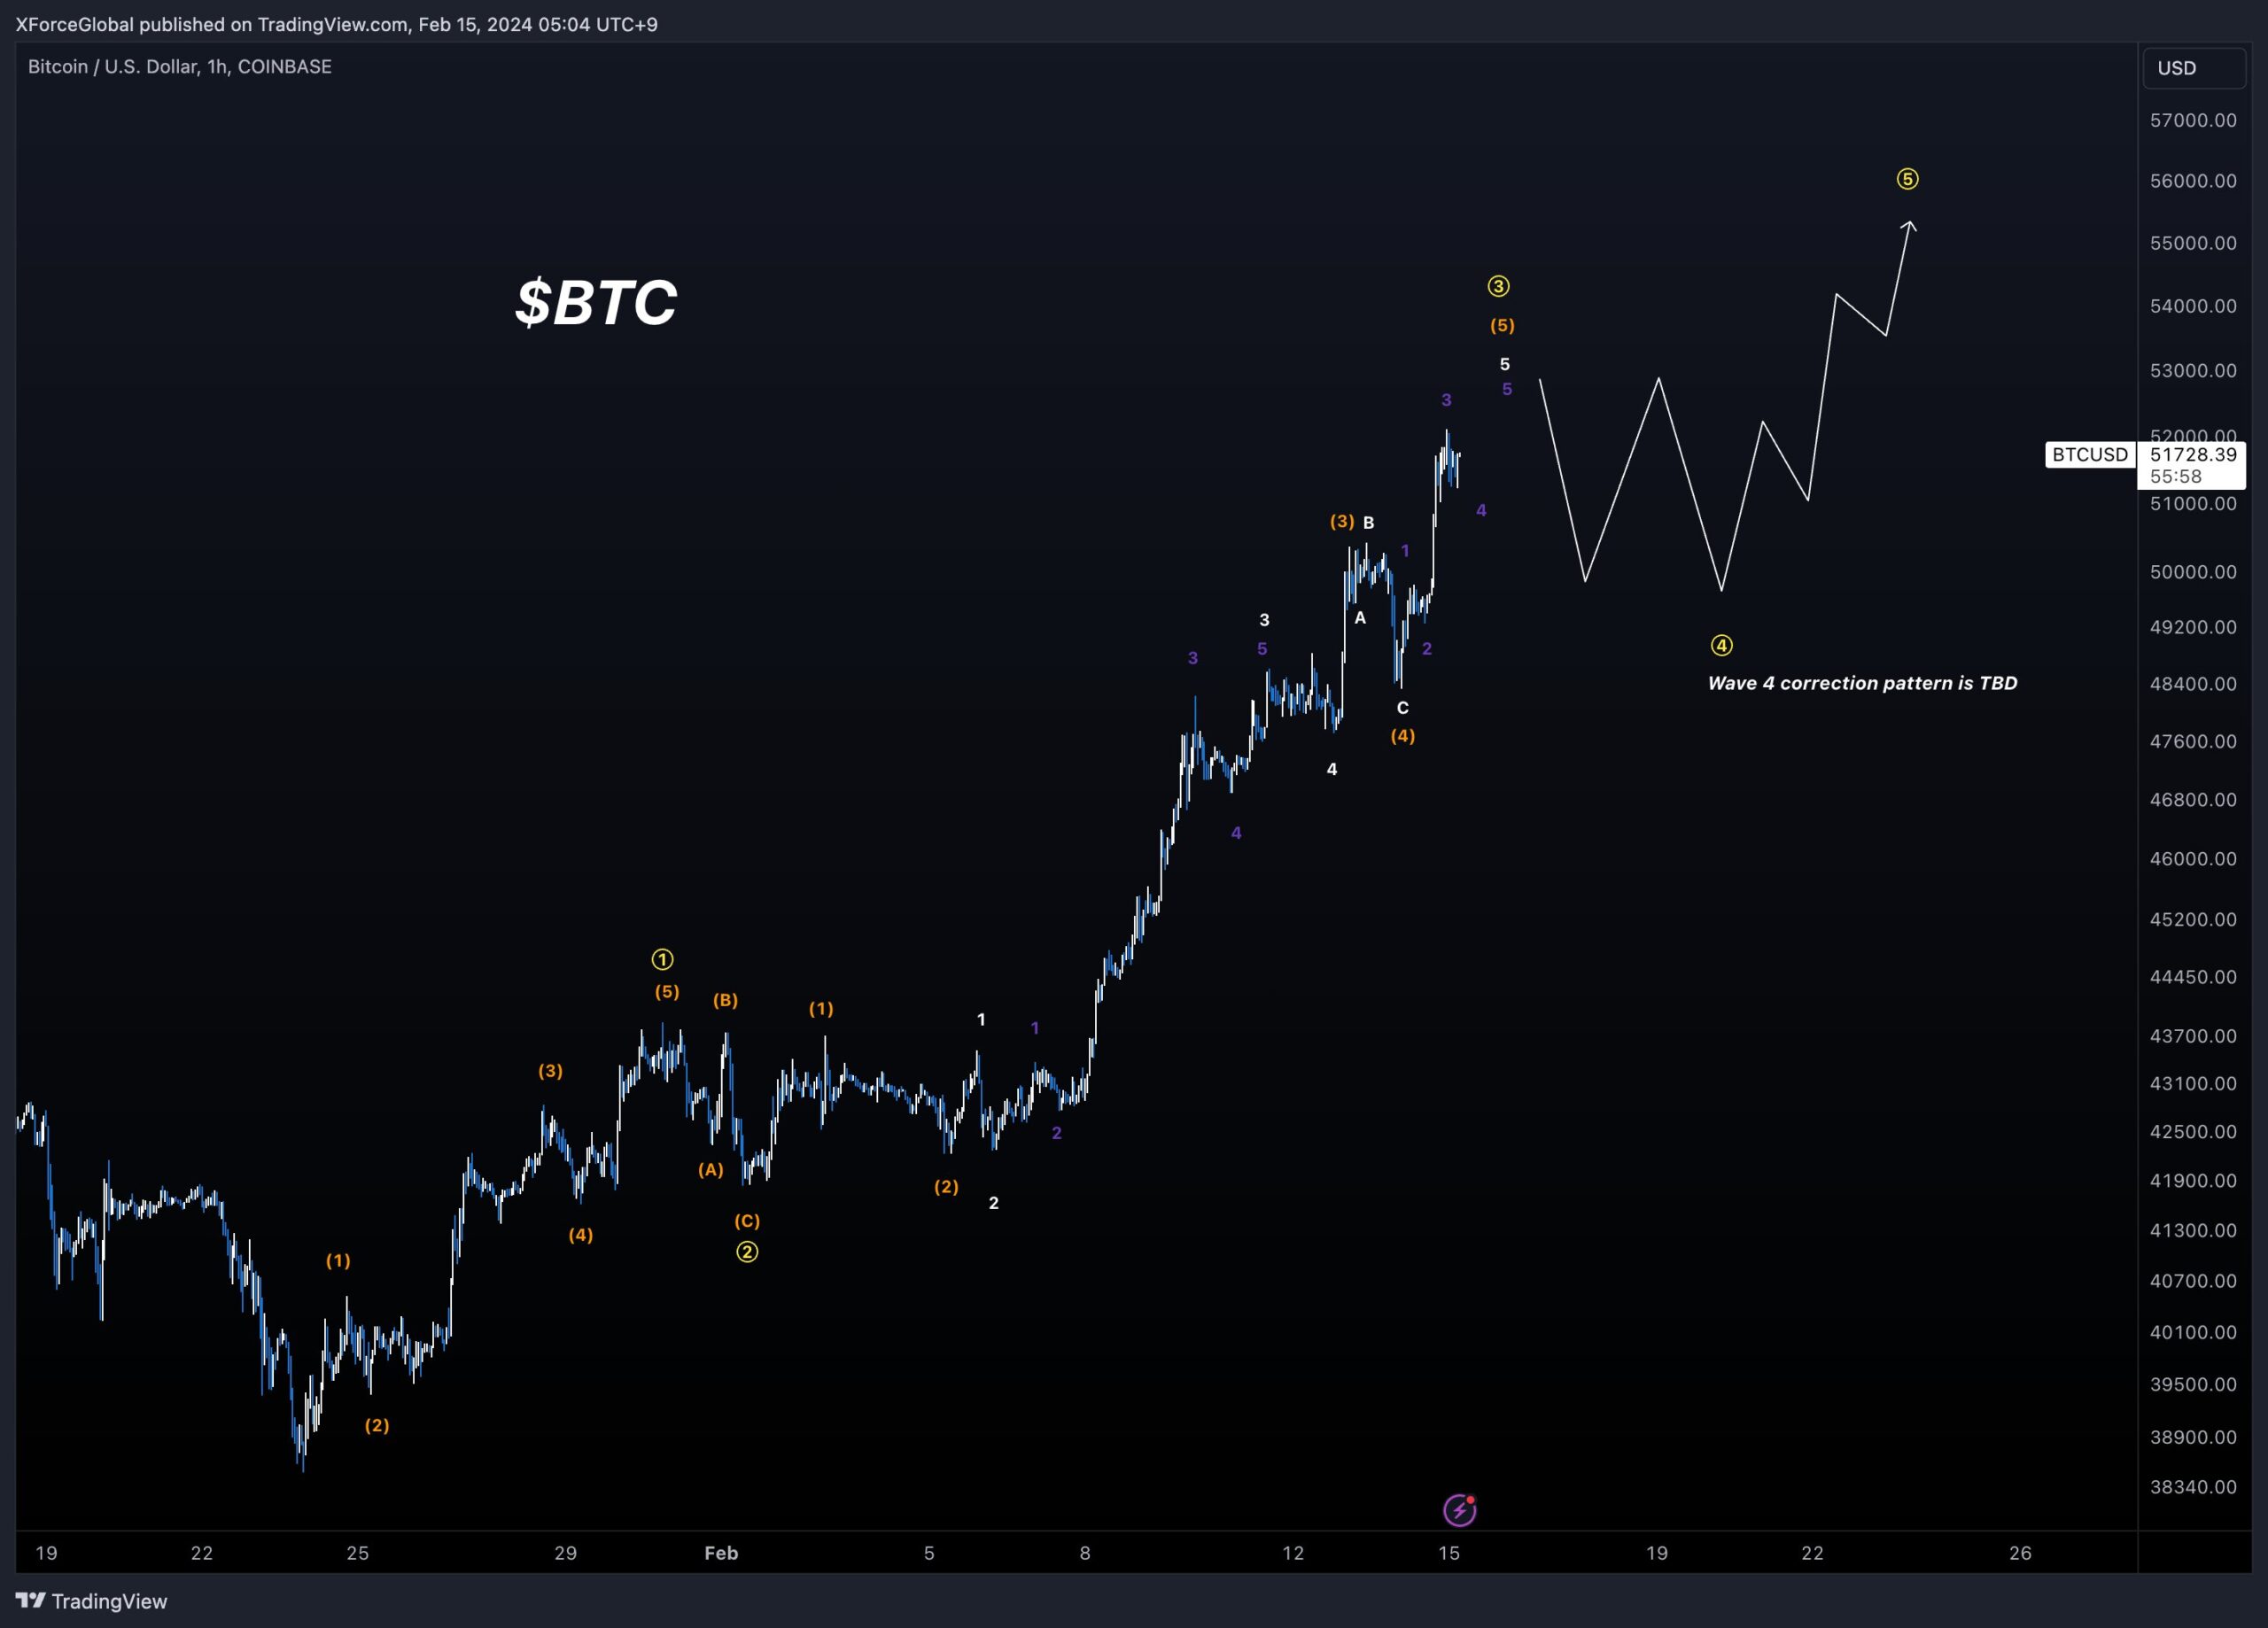 BTC/USDT Hourly Chart. Source: X
CryptoMichNL believes a short-term correction could occur but expects a significant movement afterward.
Checkmate is bullish because of the massive number of inflows from the ETFs.
“#Bitcoin spot ETFs took in 17,983 $BTC on Wednesday, a combined $928M worth of orange coin. This is an astounding single day bid, even $GBTC saw an inflow of 1.8k BTC. Remember, at some stage, probably soon, this initial demand wave will slow down. But the game has changed.” He tweeted.
Similar thoughts are given by prominent on-chain analyst Will Clemente, who noted the significant percentage of BTC that has not moved in more than a year.
“Roughly 70% of Bitcoin supply still hasn’t moved in at least a year while ETFs are seeing $500mm of inflows a day Don’t need to be an economics PHD to know what’s set up to happen next” Clemente believes.
Finally, JJcycles notes that the inflows over the past four working days are more than 2 billion.
Read More: Who Owns the Most Bitcoin in 2024?
BTC Price Prediction: $60,000 Incoming?
Like the weekly time frame, the daily one gives a bullish reading because of the price action, wave count, and RSI.
The wave count suggests that the BTC price began a new bullish increase on January 22 and is currently in wave three. This aligns with the price action, which shows a breakout above the $47,000 resistance area.
Finally, the daily RSI has crossed into overbought territory. The previous time it did this (green) led to a significant upward movement.
Currently, BTC trades at a Fib resistance at $51,780. If it breaks out, it can increase 7% to the next resistance at $55,325.
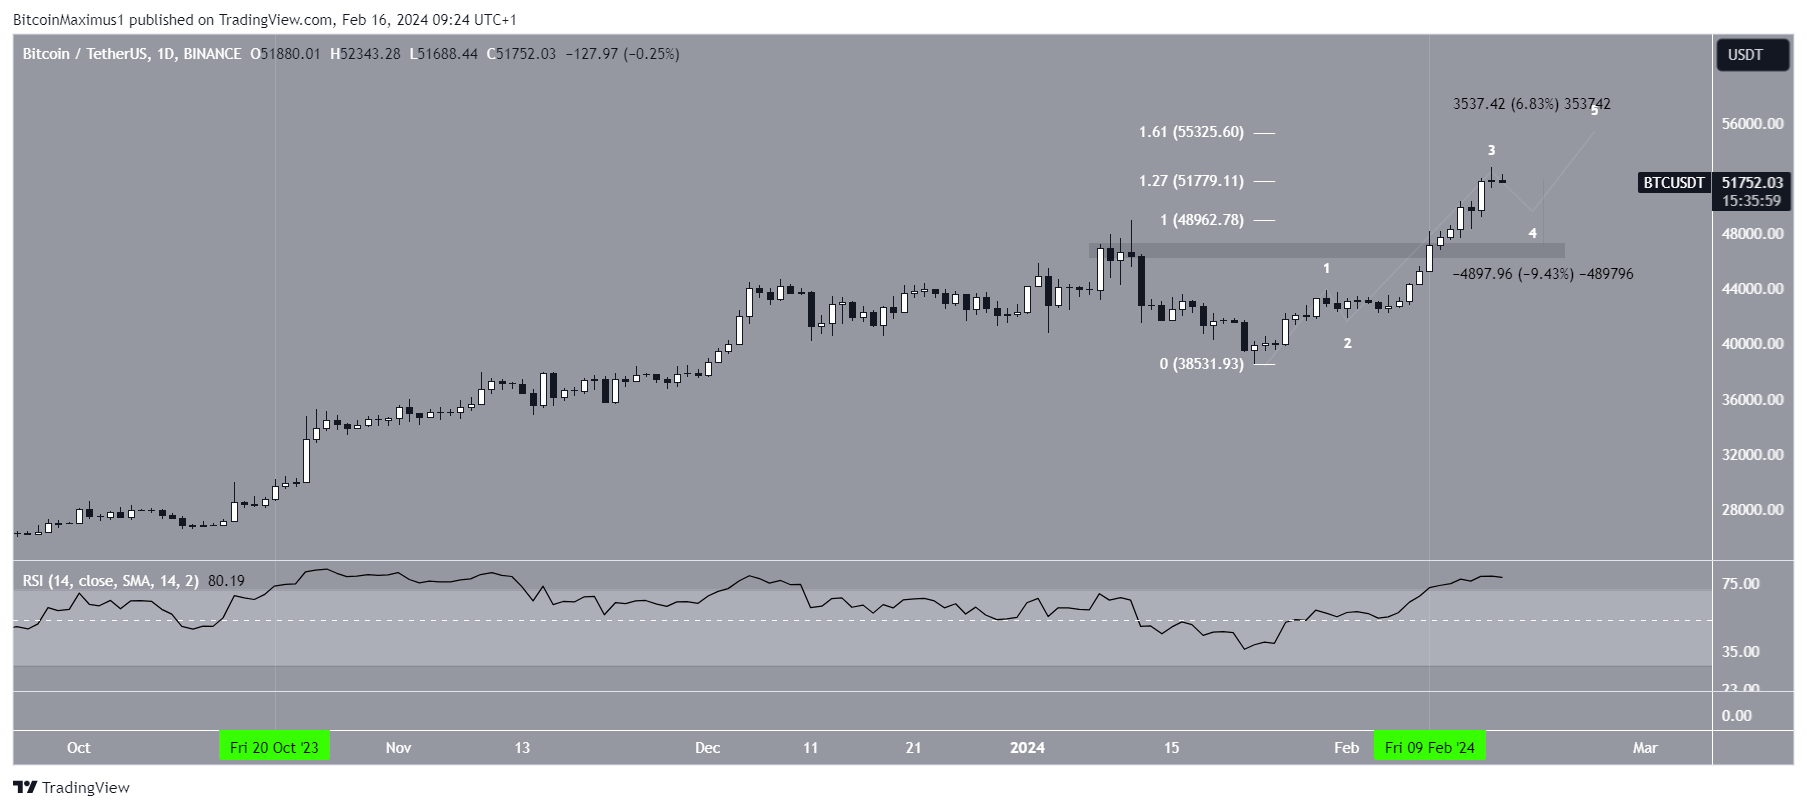 BTC/USDT Daily Chart. Source: TradingView
Despite the bullish BTC price prediction, a rejection from the current resistance can trigger a 10% drop to the closest support at $47,000.
Read More: What is a Bitcoin ETF?
For BeInCrypto‘s latest crypto market analysis, click here.
The post Bitcoin (BTC) Price Breaks $50,000 Barrier: Where to Next? appeared first on BeInCrypto.


 English (US) ·