
 7 months ago
59
7 months ago
59
Bitcoin has shown a continuation to its crash during the last 24 hours. Here’s what on-chain data says regarding whether a bottom is close or not.
Bitcoin NVT Golden Cross Is Now In Oversold Territory
As pointed out by an analyst in a CryptoQuant Quicktake post, the Bitcoin NVT Golden Cross has witnessed a sharp decline recently. The “Network Value to Transactions (NVT) Ratio” refers to an on-chain indicator that measures the ratio between the market cap of Bitcoin and its transaction volume.
When the value of this metric is greater than 1, it means the value of the asset (that is, the market cap) is high compared to its ability to transact coins (the transaction volume). Such a trend can suggest BTC is overvalued.
On the other hand, the indicator being under the zero mark can imply the cryptocurrency may be due for a rebound to the upside as its volume is high relative to its market cap.
In the context of the current discussion, the NVT Ratio itself isn’t of interest, but rather a modified form of it known as the NVT Golden Cross. This indicator basically compares the short-term trend of the NVT Ratio against its long-term one to find whether it’s close to a top or bottom.
For tracking these trends, the metric uses the 10-day and 30-day moving averages (MAs) of the NVT Ratio, respectively. Now, here is the chart shared by the quant that shows the trend in the Bitcoin NVT Golden Cross over the last couple of years:

Historically, there have been two zones that have held importance for the Bitcoin NVT Golden Cross. The first of these is situated above 2.2 (highlighted in red) and is where the tops in the metric have generally occurred. These peaks tend to be signals of overvaluation for the cryptocurrency, so bearish action can probably follow them.
Similarly, the second zone, which takes place below -1.6 (green), is where bottoms occur in the NVT Golden Cross. The indicator dipping into this zone has often proven to be a bullish sign for the asset.
From the chart, it’s visible that the Bitcoin NVT Golden Cross has recently seen a sharp decline as a result of the crash that BTC’s price has witnessed. The metric is now inside the bottoming zone, which means the coin may be starting to become oversold.
So far, the indicator’s value has dropped to -2.4, which is still higher than the other negative spikes that the analyst has marked in the graph. Thus, while BTC may be nearing a bottom, it could still take a further drop before it’s actually in.
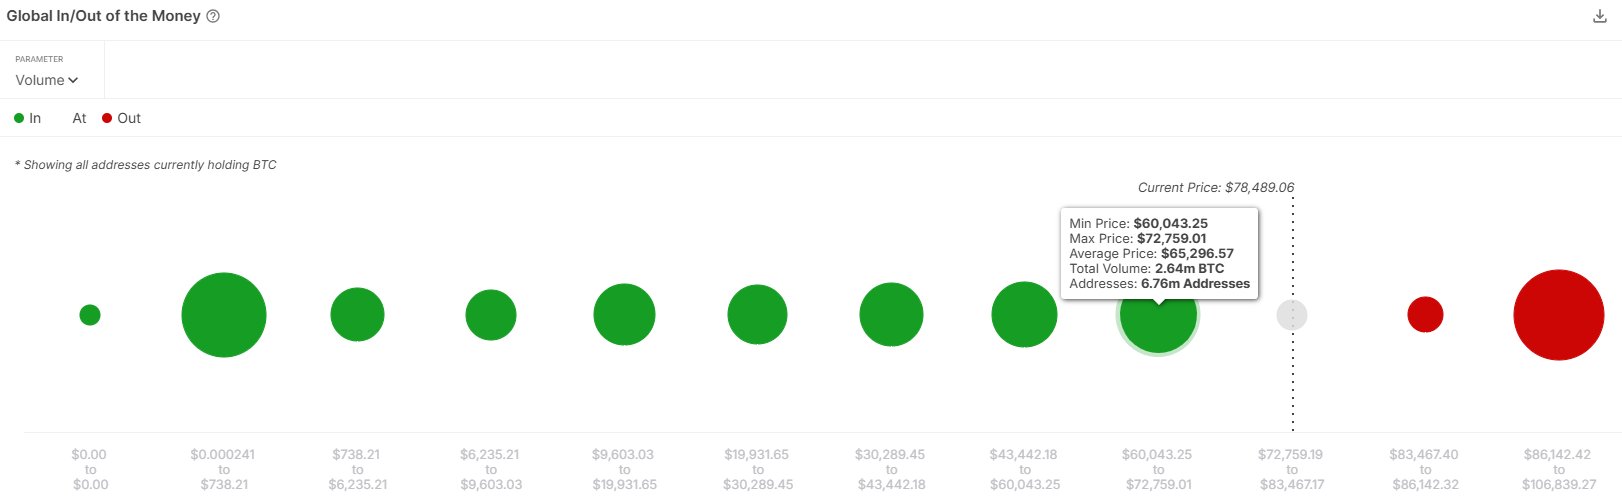
In terms of on-chain support, the market intelligence platform IntoTheBlock has explained that the next relevant one is present under $72,000. As such, if BTC’s decline continues, it’s possible that the asset may find at least temporary relief around this mark.
BTC Price
Following the latest leg of the decline during the past day, Bitcoin has seen its price drop to the $81,600 mark.


 English (US) ·