
 2 months ago
36
2 months ago
36
Bitcoin (BTC) price trades near $75,000, up marginally on the day, following a rejection near $78,380 on April 17.
The pullback has neutralized derivatives positioning, yet long-term holders have added to their stacks at an accelerating pace. That split has set up a narrow single-level decision for the days ahead.
Bitcoin Builds a Bull Flag After a 21% Rally From the March Low
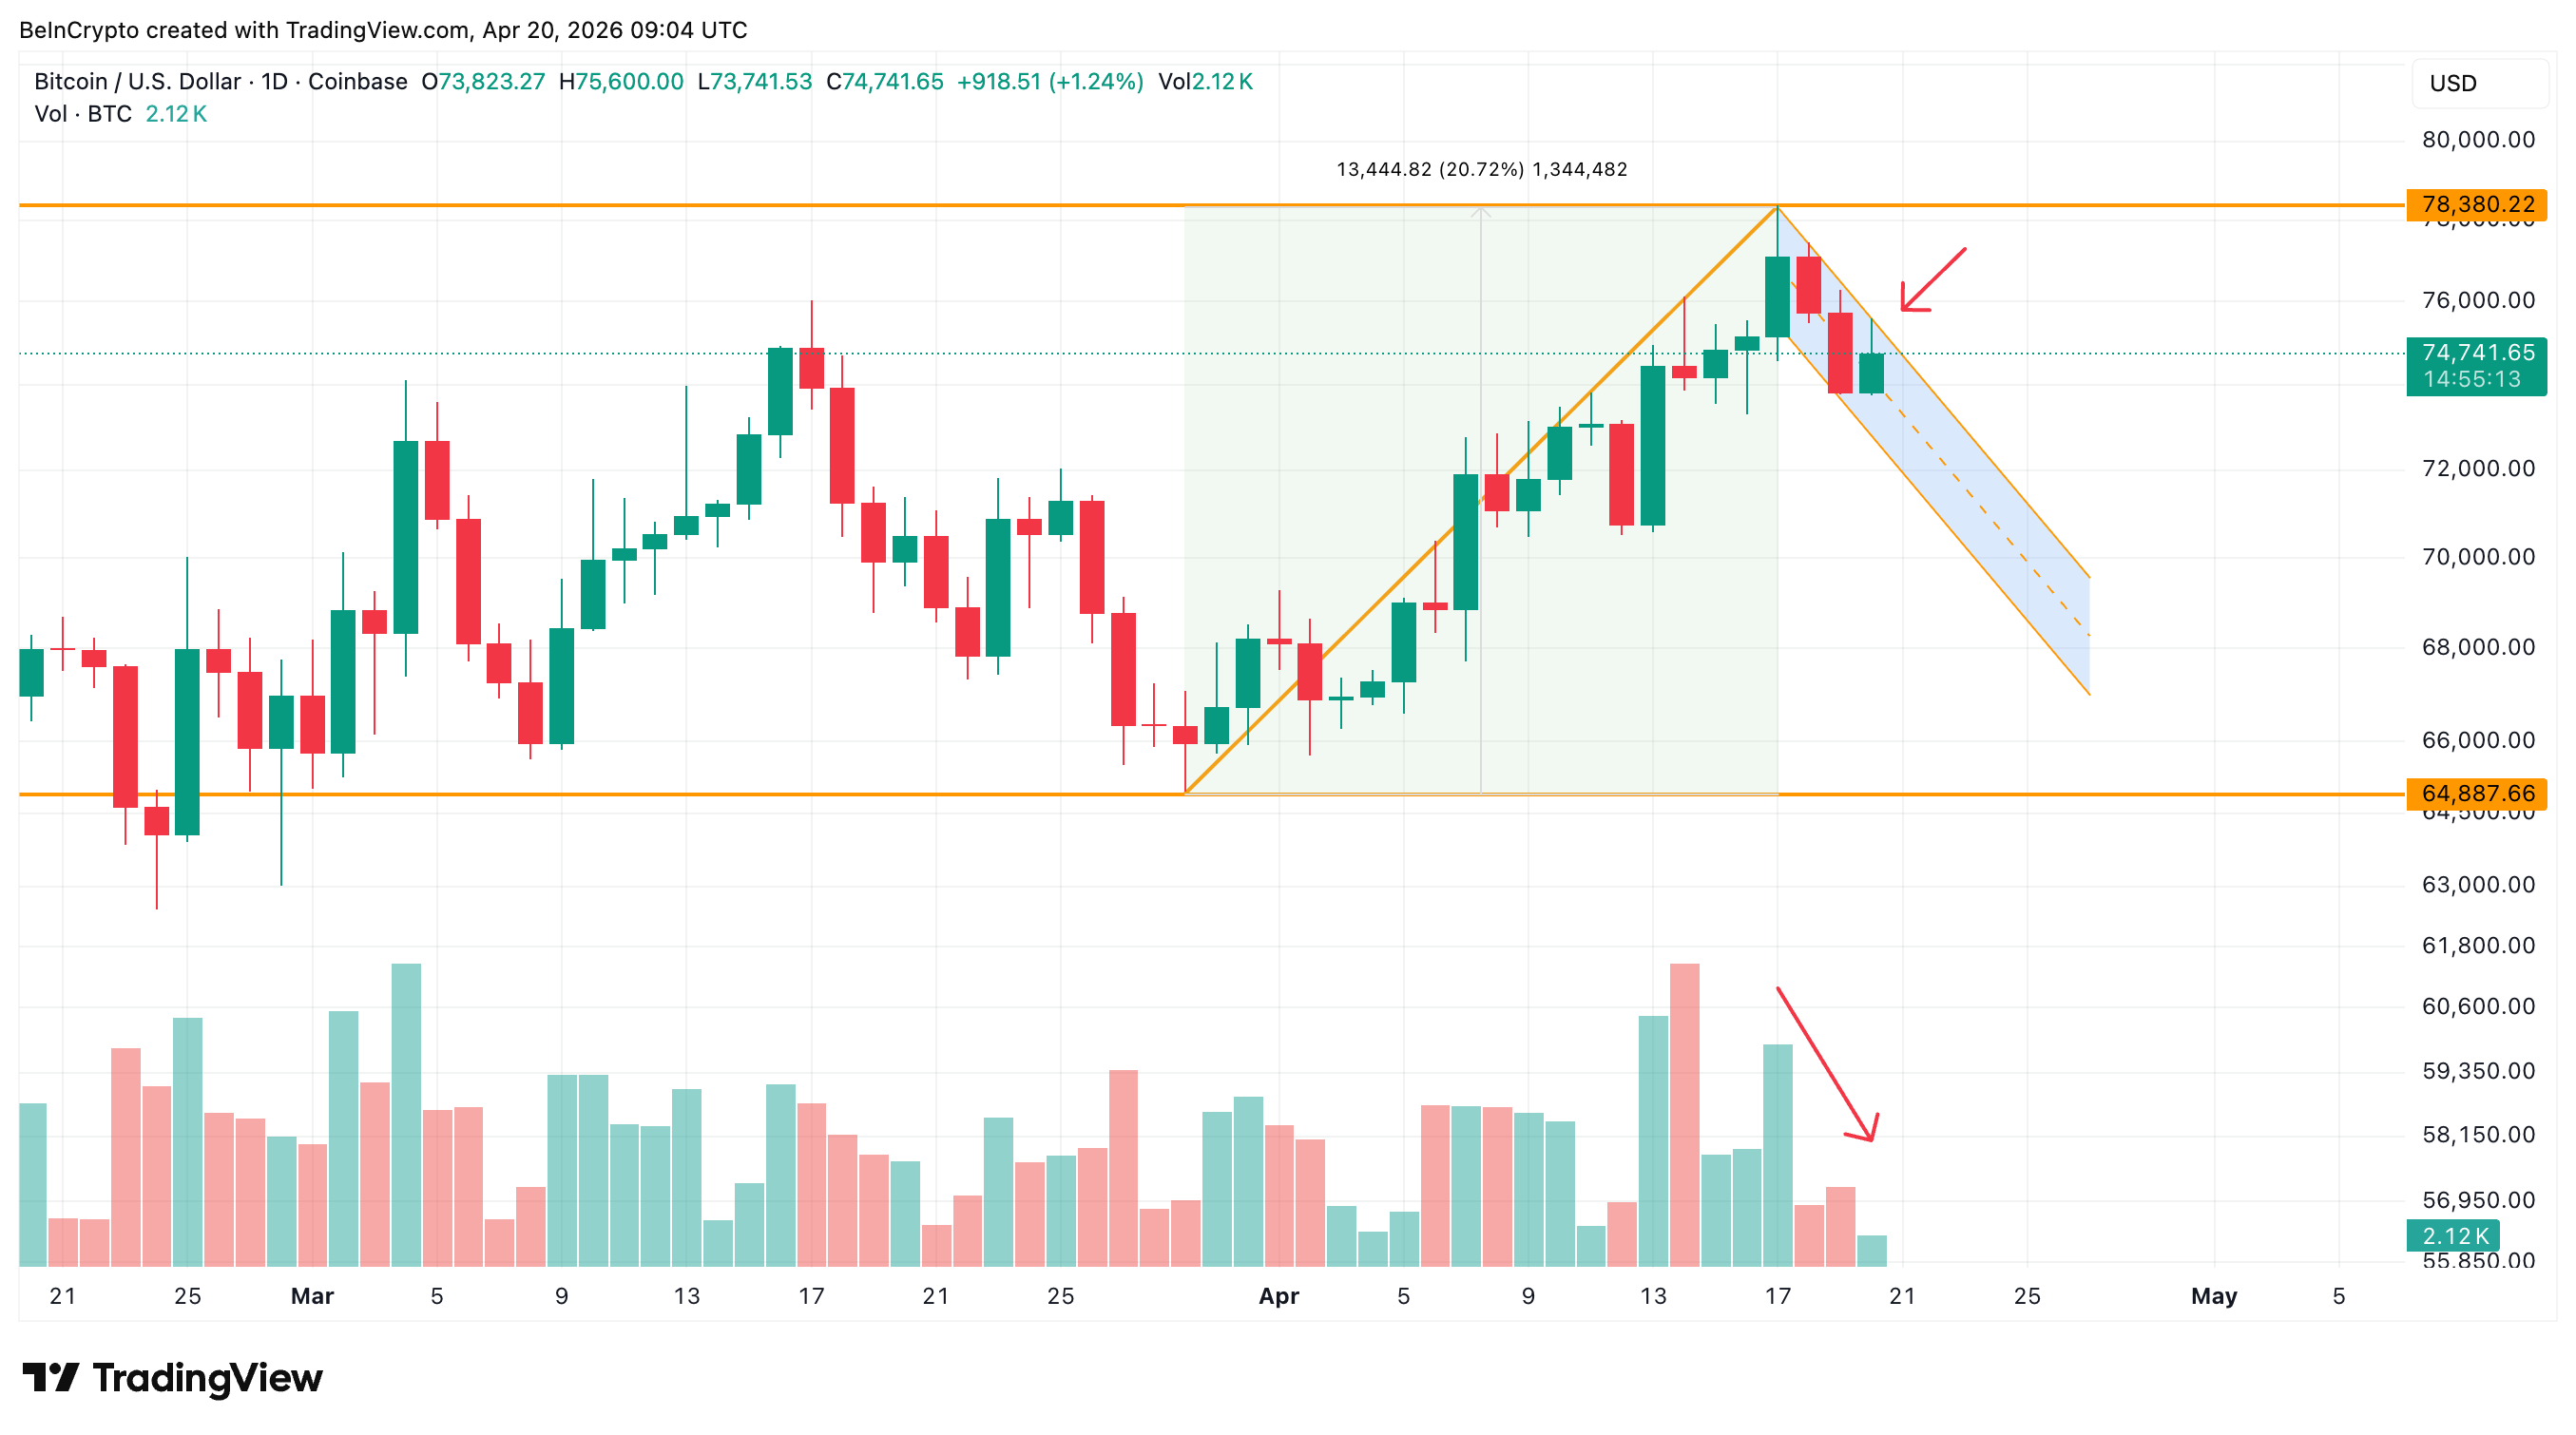
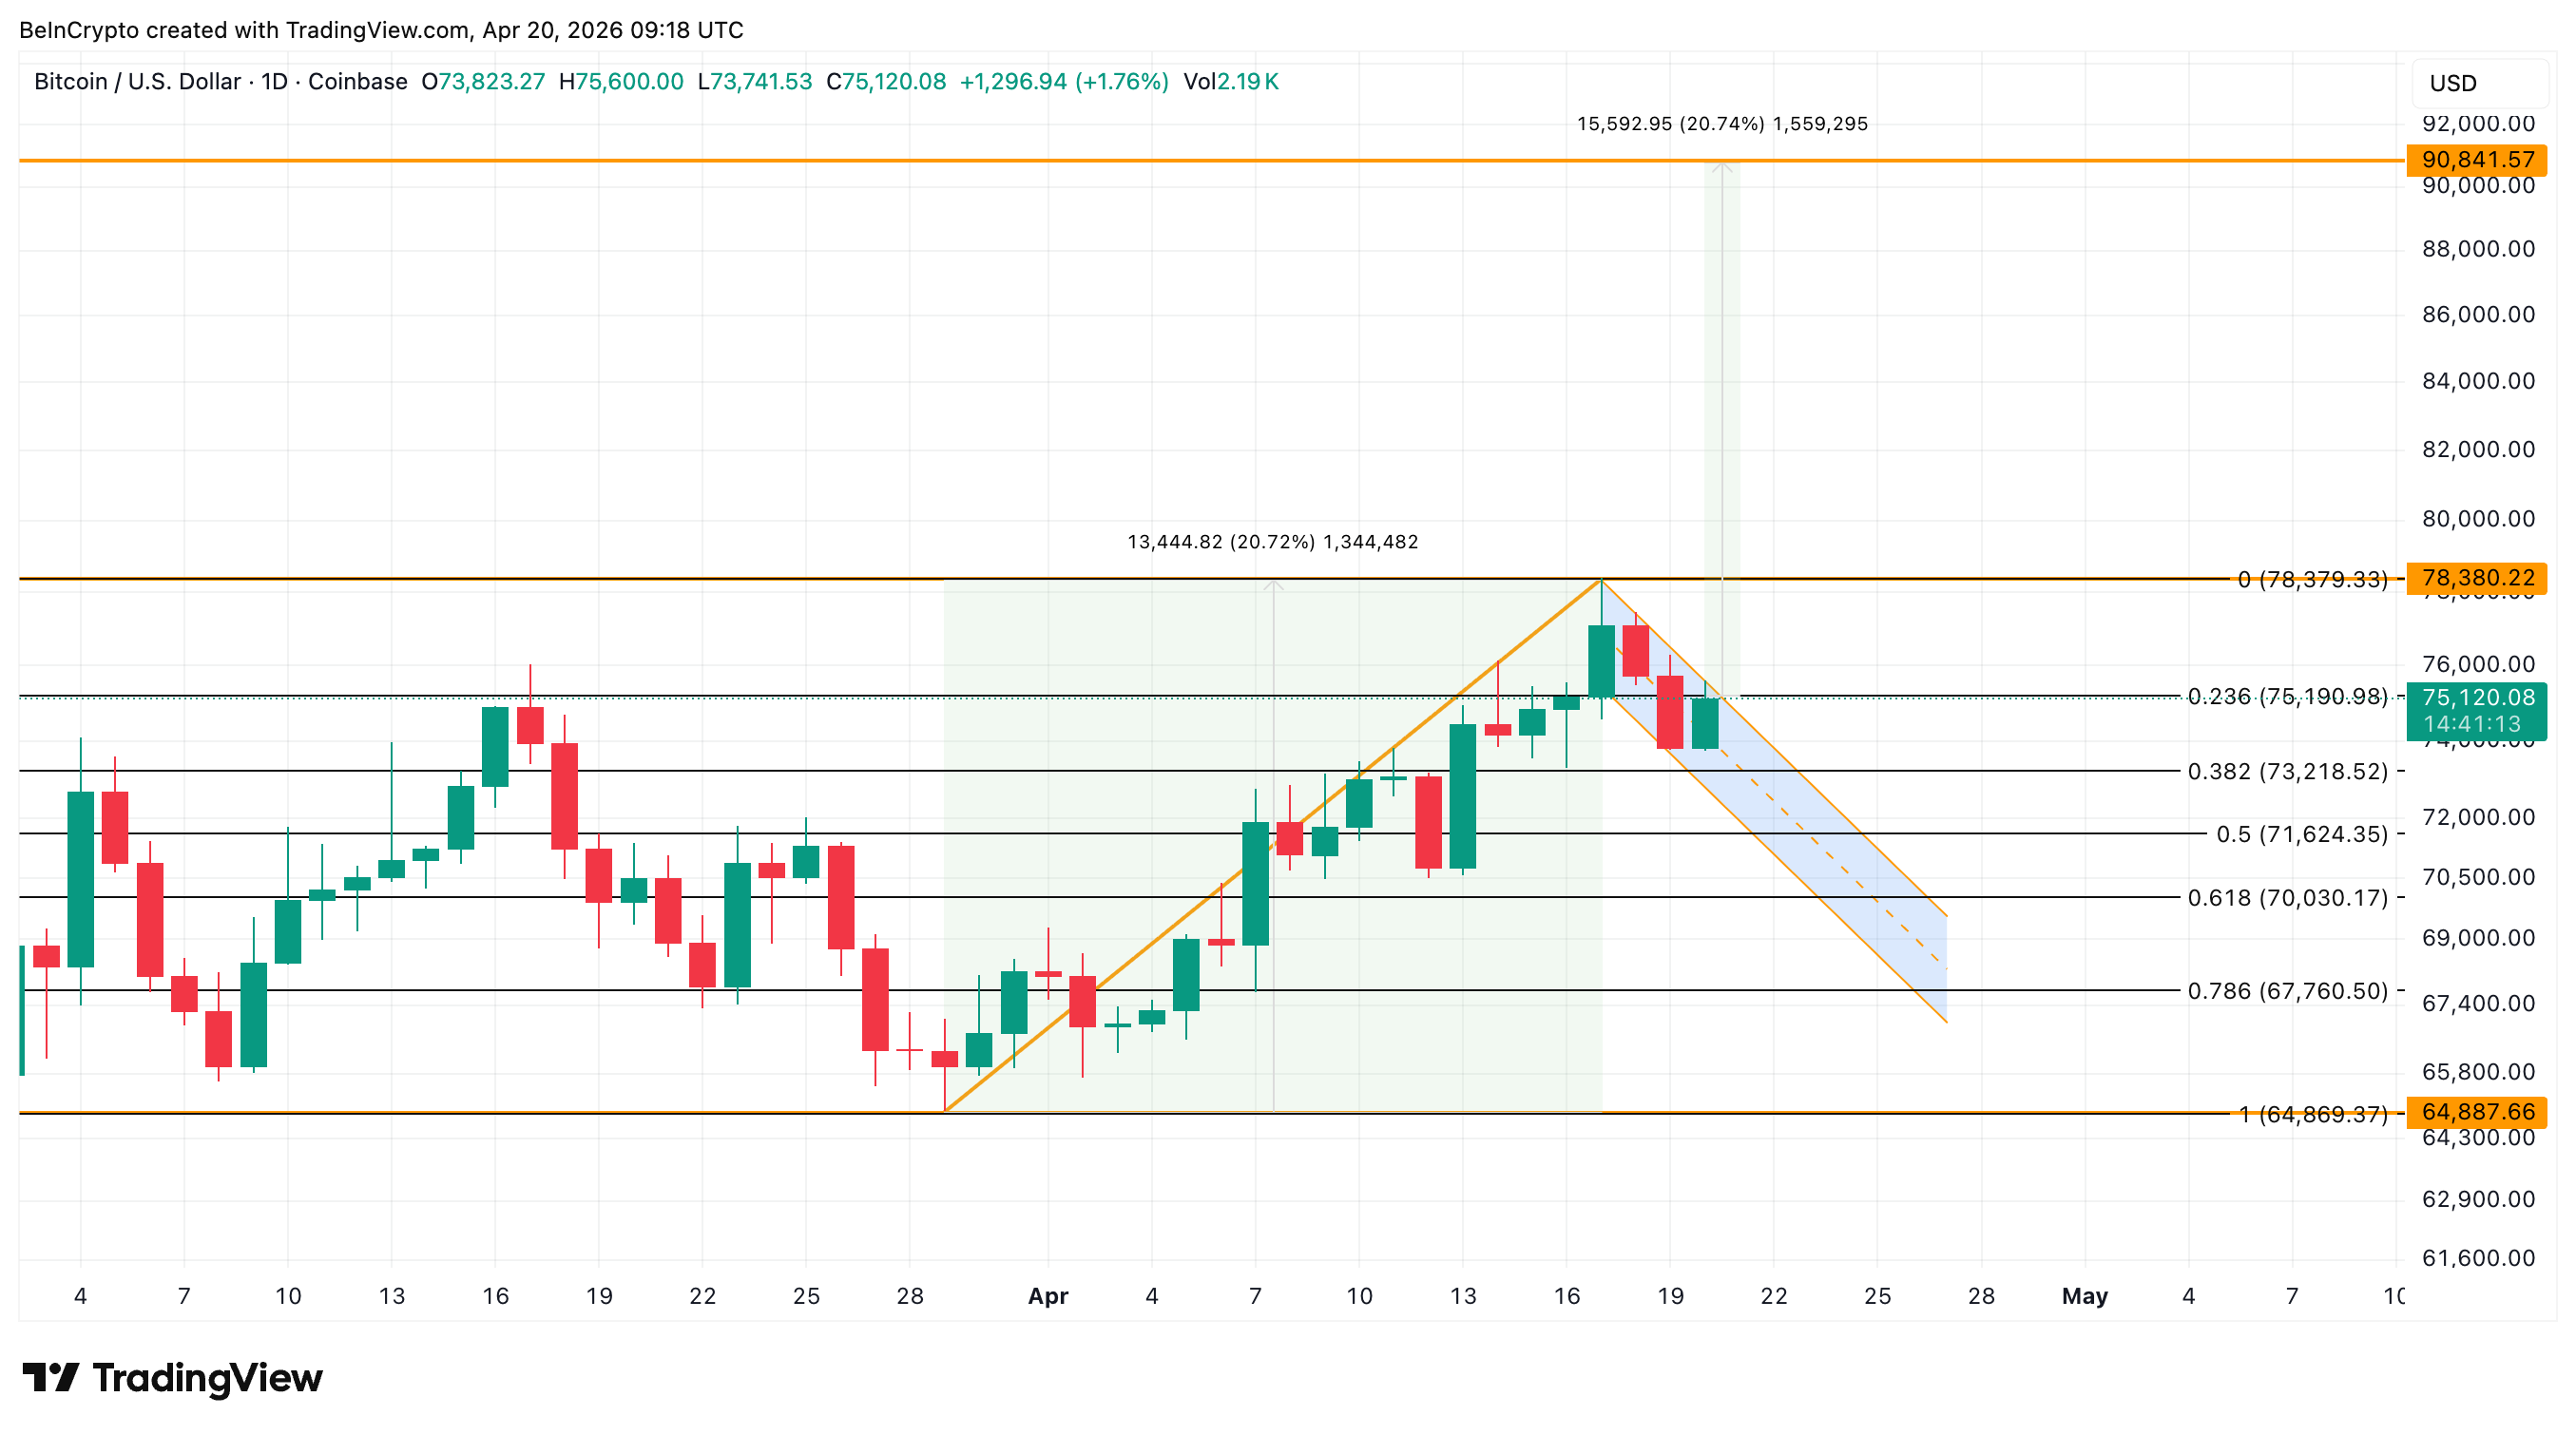
Bitcoin rallied 20.72% from its March 29 low to the April 17 peak at $78,380, a 13,444-point pole move in roughly three weeks. Since the peak, price has traded inside a descending parallel channel, the bull flag structure that typically signals continuation after a sharp advance.
The flag’s upper trendline has been tested twice in recent sessions, on April 18 and again on April 20. The last attempt printed a long upper wick. That wick marks the session where buyers pushed price into resistance and sellers took some control before the close.
Volume quality tells the same story. Buy-session volume inside the flag has come in below the prior sell-session volume, an asymmetry that reverses the usual bullish read. Volume compression inside a flag is normal. Volume compression where sellers keep outweighing buyers is a weaker signal.
 Bull Flag Pattern: TradingView
Want more token insights like this? Sign up for Editor Harsh Notariya’s Daily Crypto Newsletter here.
The pattern itself is still intact. The execution against the ceiling, however, has not delivered the conviction bulls need for a first-attempt breakout. With spot volume sending mixed signals, the next question is whether derivatives positioning is filling the gap.
Open Interest Has Shed Nearly 10% Since the Flag Formed
Since the April 17 peak, Bitcoin open interest, the total dollar value of outstanding perpetual futures positions, has dropped from $30.46 billion to $27.44 billion. That is roughly a 10% reduction across three trading sessions.
The funding rate, the periodic payment between long and short positions in perpetual contracts, has moved from -0.014% on April 17 to -0.002% today. Negative funding means shorts pay longs. The shift toward zero suggests short positioning has been closing out or getting forced out.
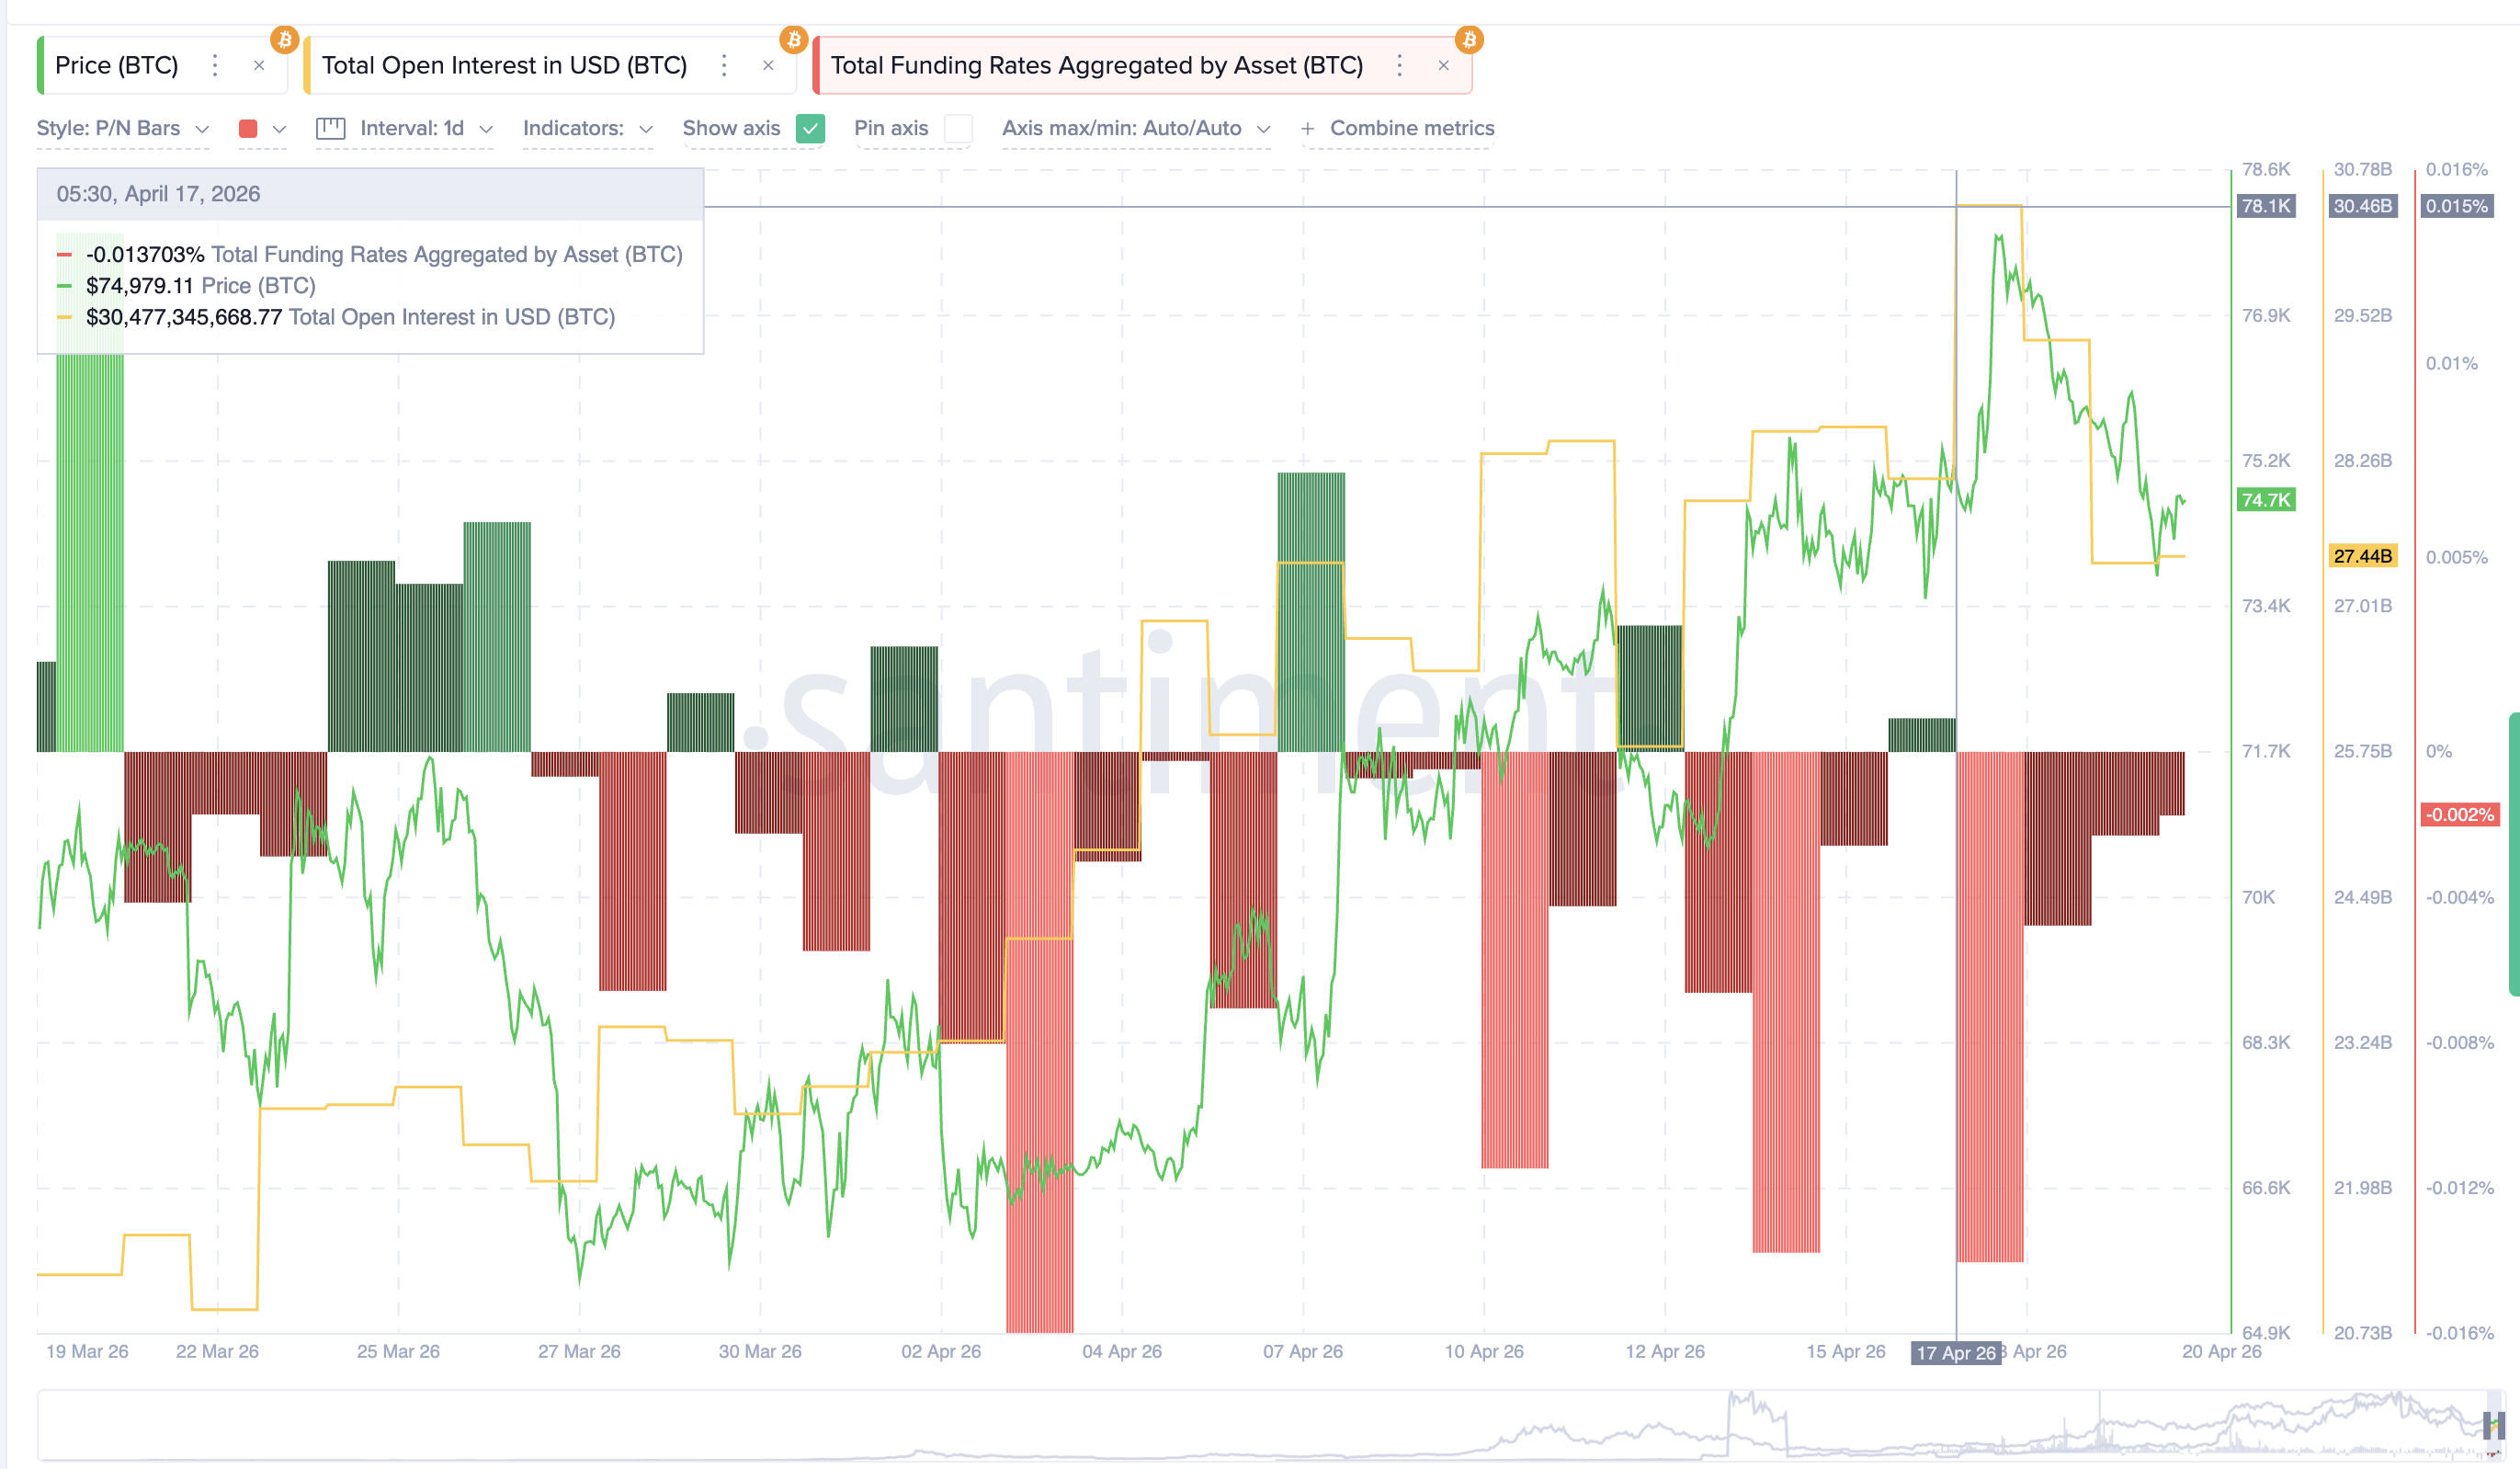 Bitcoin Open Interest and Funding: Santiment
The bullish contrarian setup would pair rising open interest with deeply negative funding, a sign of shorts stacking into the rally. This chart shows the opposite. Open interest is shrinking while funding normalizes toward zero. New Bitcoin longs are not stepping in to replace the exiting shorts. And even new shorts are waiting on the sidelines.
Interpreted carefully, the derivatives market is not voting in either direction. It is resetting. Clean decks sometimes precede sustainable moves, but a reset alone does not supply the demand a breakout needs. With leverage neutralized, spot positioning becomes the decider.
Long-Term Holders Added More Than 10% Since the Rejection
The Hodler Net Position Change, a Glassnode metric that measures how much long-term holders are accumulating each day, has climbed from 32,942 BTC on April 17 to 36,482 BTC on April 19. That marks a 10.75% jump in hodler accumulation over three sessions, a large swing by Bitcoin’s scale.
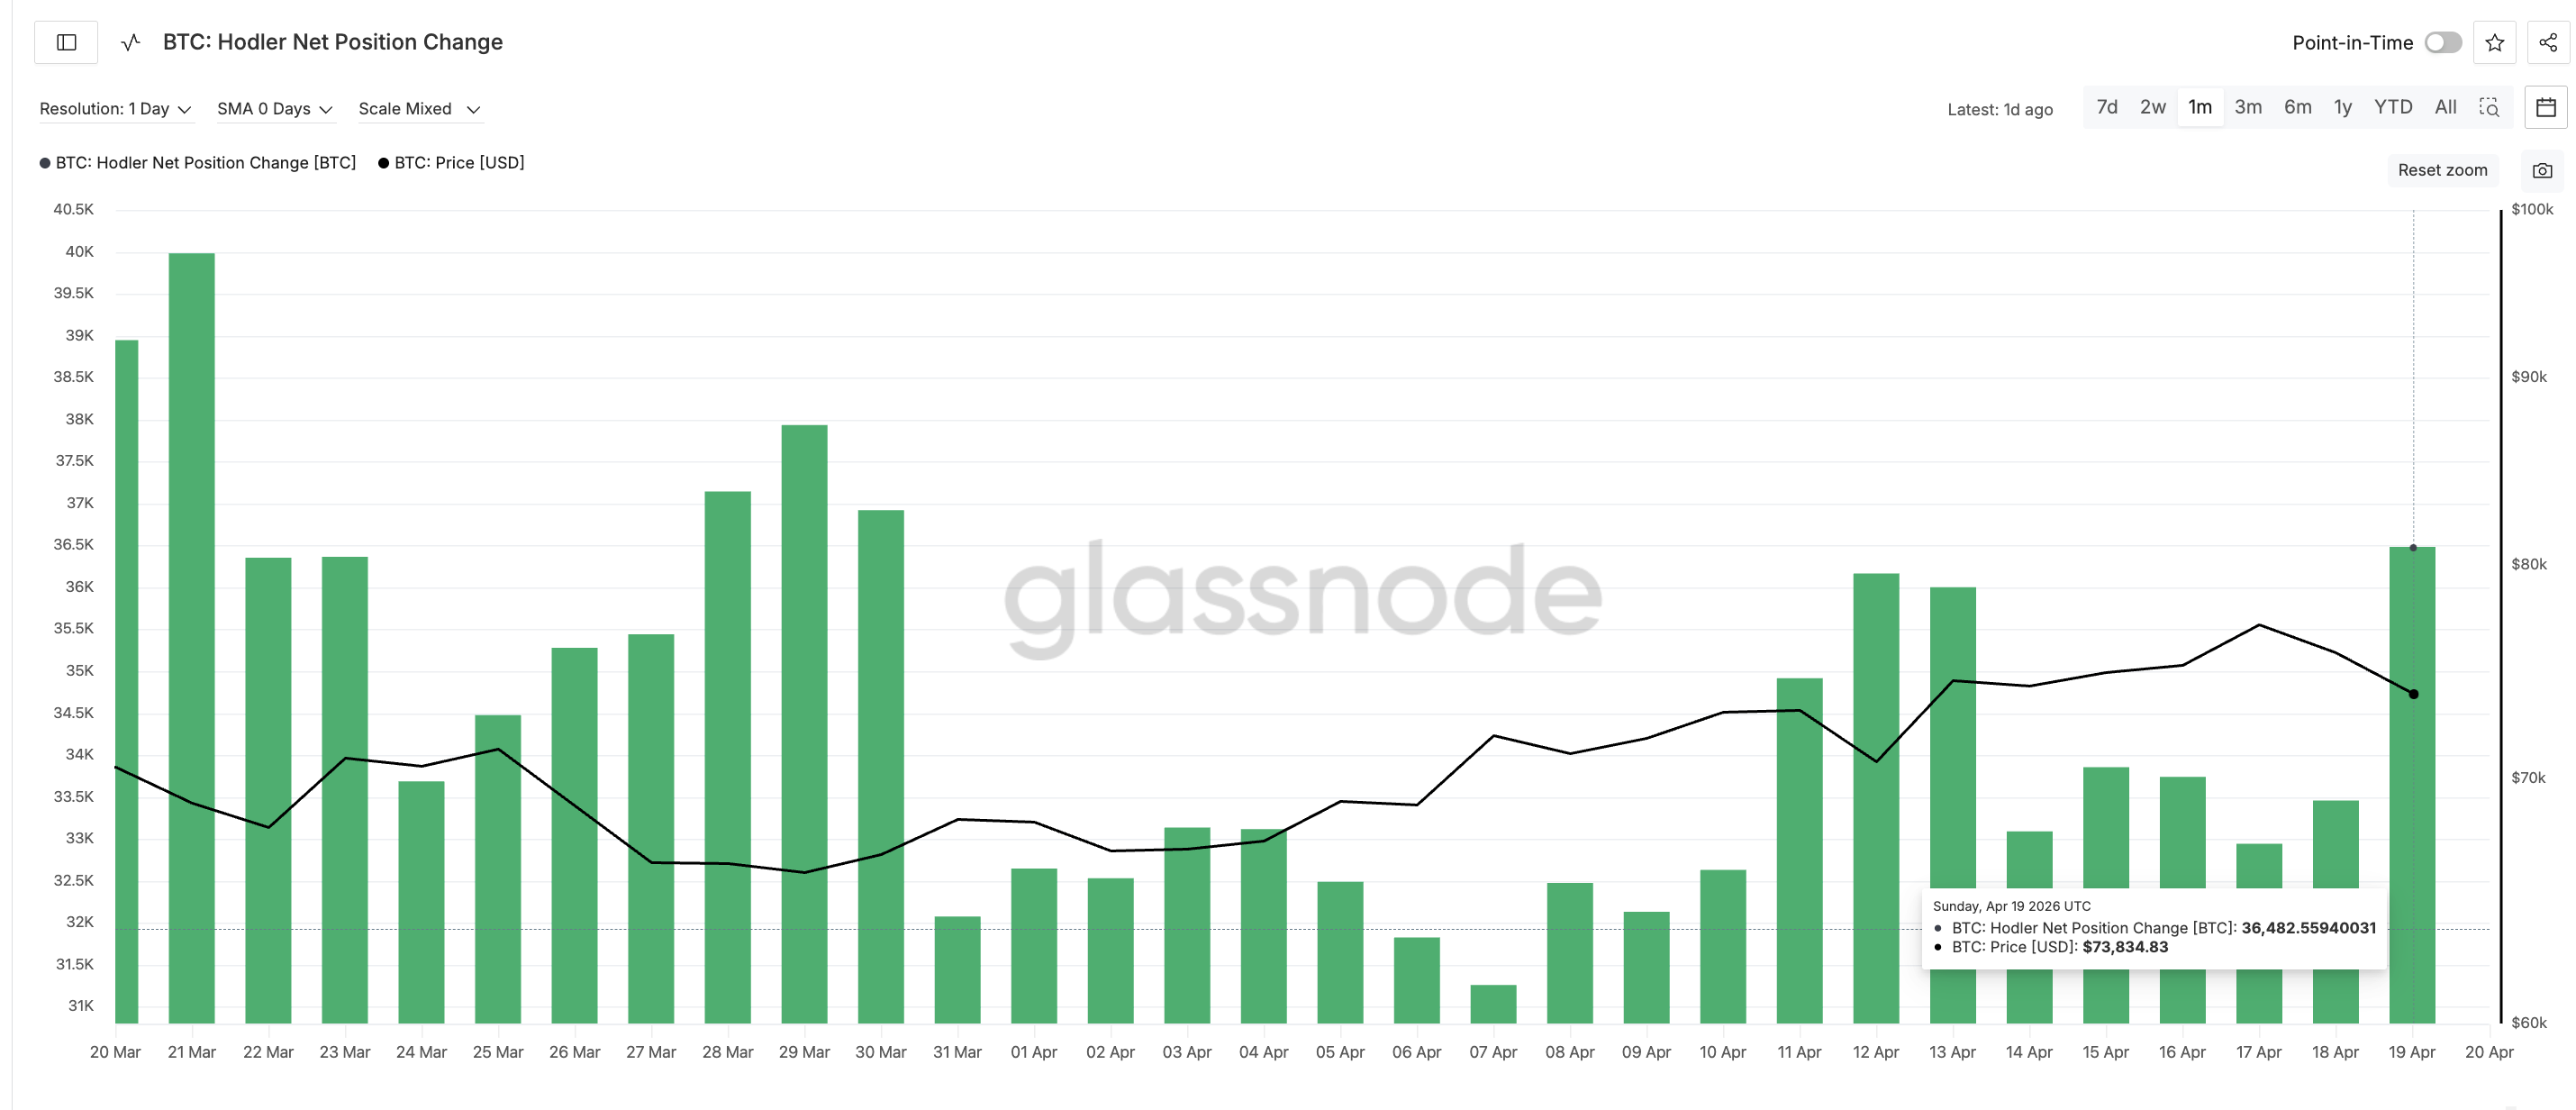 Hodler Net Position Change: Glassnode
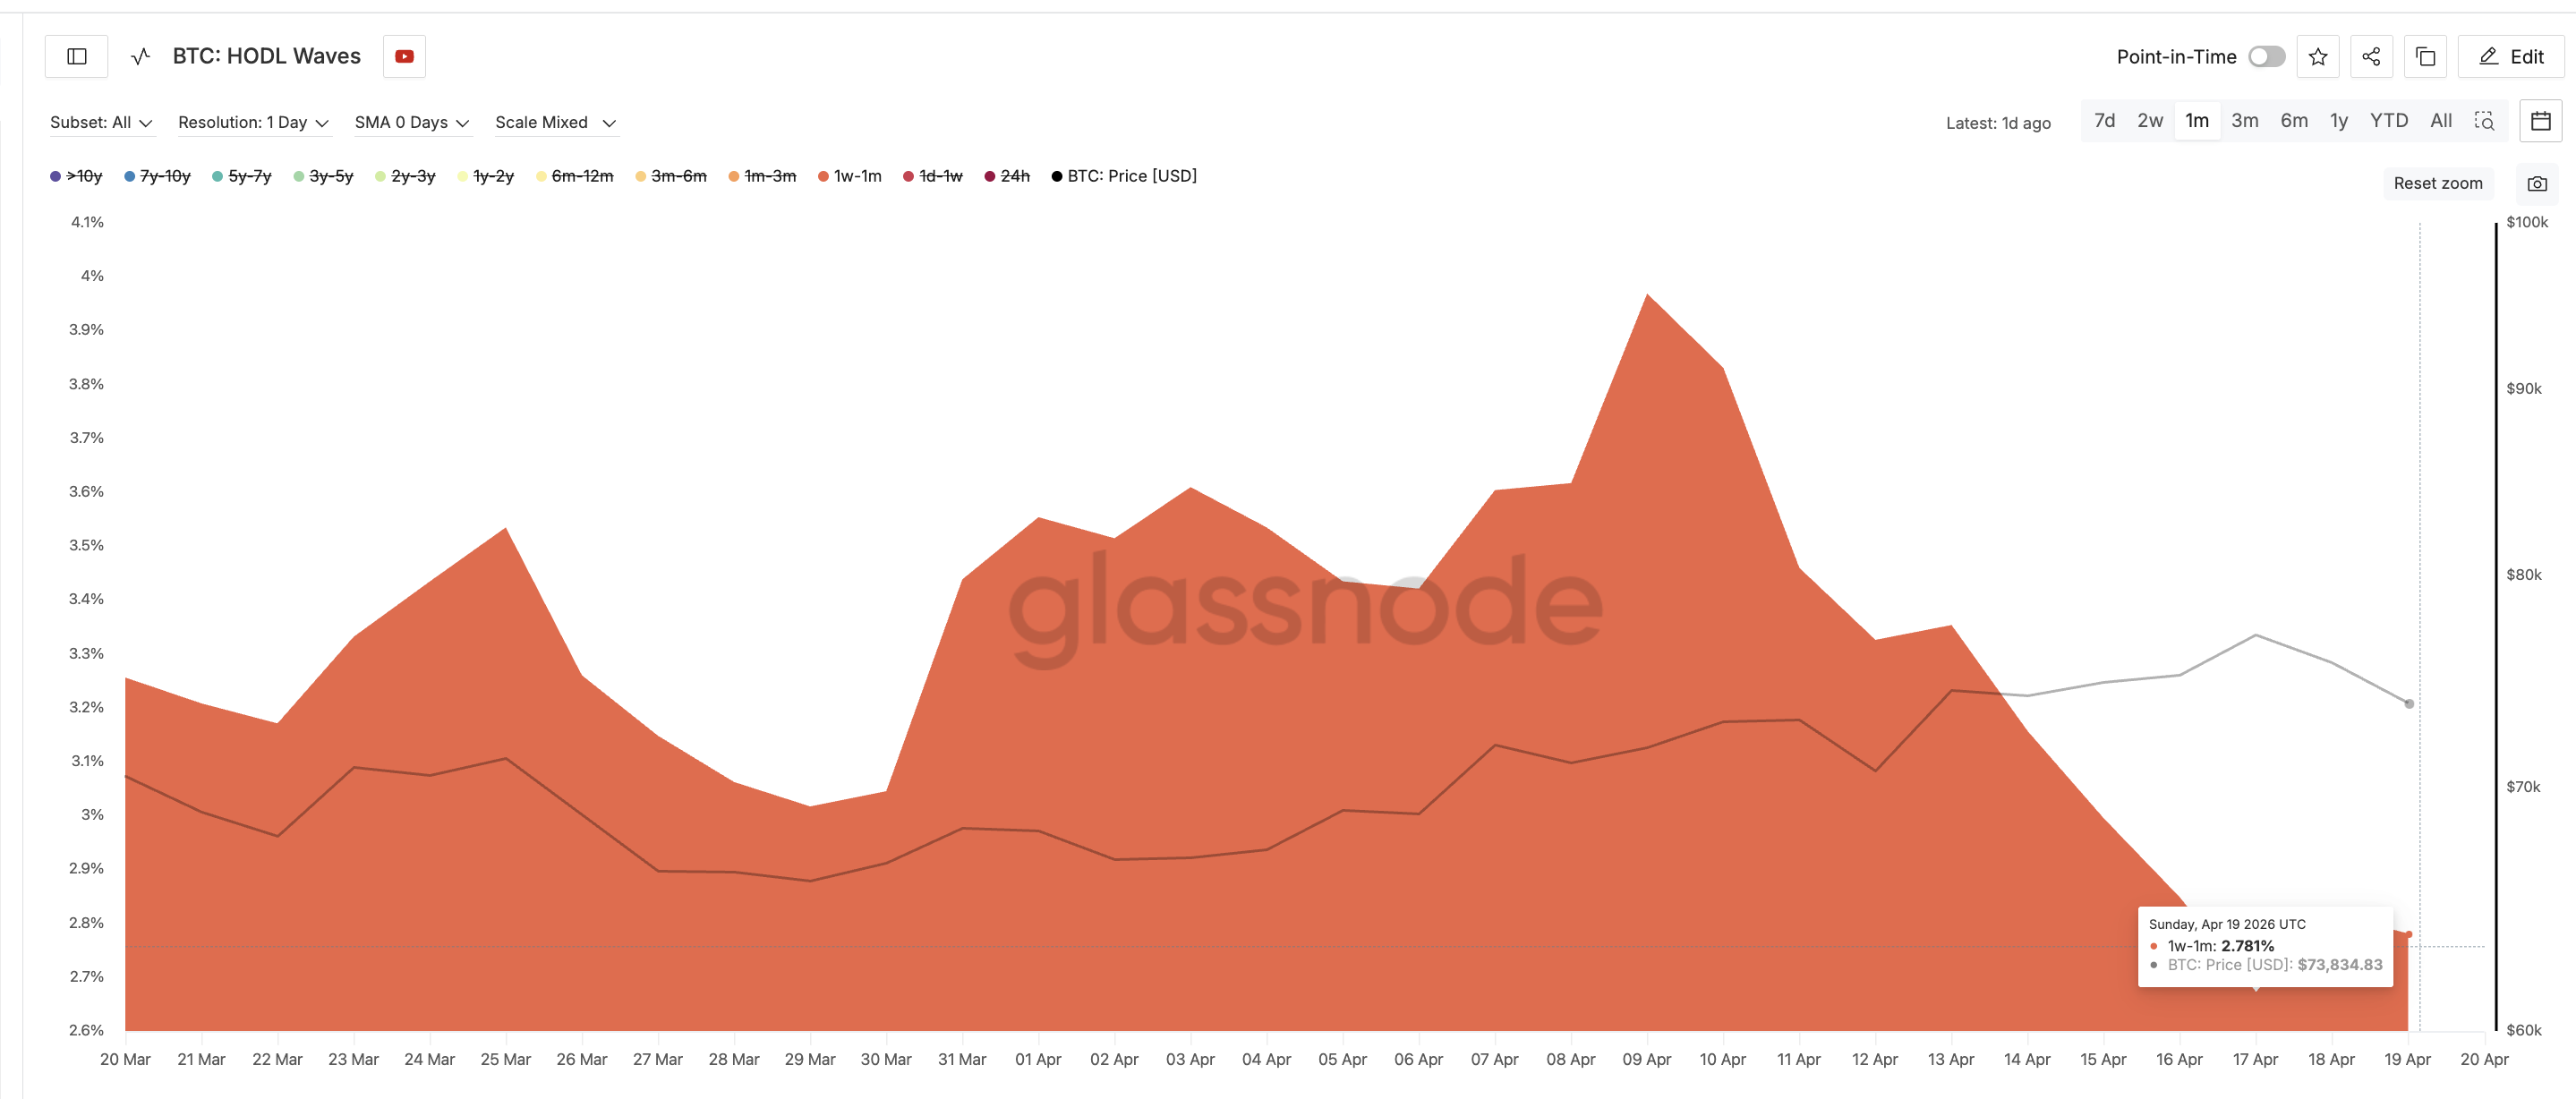
The identity of the sellers becomes clearer when cross-referencing the HODL Waves, a Glassnode distribution that splits circulating supply by wallet age band. The 1-week to 1-month cohort, which captures the most recent speculative buyers, peaked near 4% on April 9 and has since dropped to 2.781% on April 19.
 BTC HODL Waves 1w-1m: Glassnode
That cohort has compressed by roughly 30% in ten days. The pattern is consistent with recent speculative buyers booking profits into the rally, while longer-term holders absorb the supply on the dip.
The rotation from weak to strong hands is happening quietly inside the flag consolidation. The hodler behavior answers the question derivatives could not. Leverage is neutral because spot is doing the buying, and the flag’s next move now hangs on a single price trigger.
Bitcoin Price Levels That Decide the $90,000 Path
Bitcoin price needs a daily close above $75,190.98, the 0.236 Fibonacci level drawn from the $64,869 pole base to the $78,379 peak. That level was tested and rejected on April 20, keeping the flag’s resistance cluster intact.
A decisive close above $75,190 opens the path for the flag to resolve higher. The pole projection, measured by extending the 20.72% pole move from the breakout point, targets $90,841.57 on the chart. That is roughly a 21% advance from the current zone if the breakout confirms with volume.
 Bitcoin Price Analysis: TradingView
Today’s green candle has not been accompanied by a leverage buildup in derivatives. That is a healthy sign, because the move has room to extend without being immediately exposed to a long squeeze. A confirming breakout would turn the leverage reset from a neutral condition into a loaded spring.
The pattern nuance is the two failed probes at the ceiling. A deeper retest toward the 0.382 level at $73,218 or the 0.5 level at $71,624 could precede a cleaner second attempt. A loss of the 0.618 level at $70,030 would mostly invalidate the bullish pattern.
For now, $75,190 separates the continuation case that targets $90,000 from a deeper retest that could drain the bull flag’s upside.
The post Bitcoin Hodlers Add 10% as BTC Lines Up a Run to $90,000 appeared first on BeInCrypto.


 English (US) ·