
 1 day ago
15
1 day ago
15
Bitcoin is showing signs of recovery after finding support at the 200-day moving average.
However, the bullish momentum appears weak, suggesting that this rebound could be a temporary correction rather than the start of a sustained uptrend.
Technical Analysis
By Shayan
The Daily Chart
Bitcoin is showing early signs of a recovery after bouncing off the crucial $80K support level. This region aligns with the ascending channel’s lower boundary, the 200-day moving average, and the key 0.5-0.618 Fibonacci retracement zone, making it a formidable support level that sellers have struggled to break. As long as this support is in place, the overall trend will remain intact.
However, bullish momentum appears weak, suggesting that the recent rebound could be a temporary correction rather than the start of a strong uptrend. If BTC continues its recovery, the following key resistance lies at $92K, where the 100-day moving average could act as a barrier.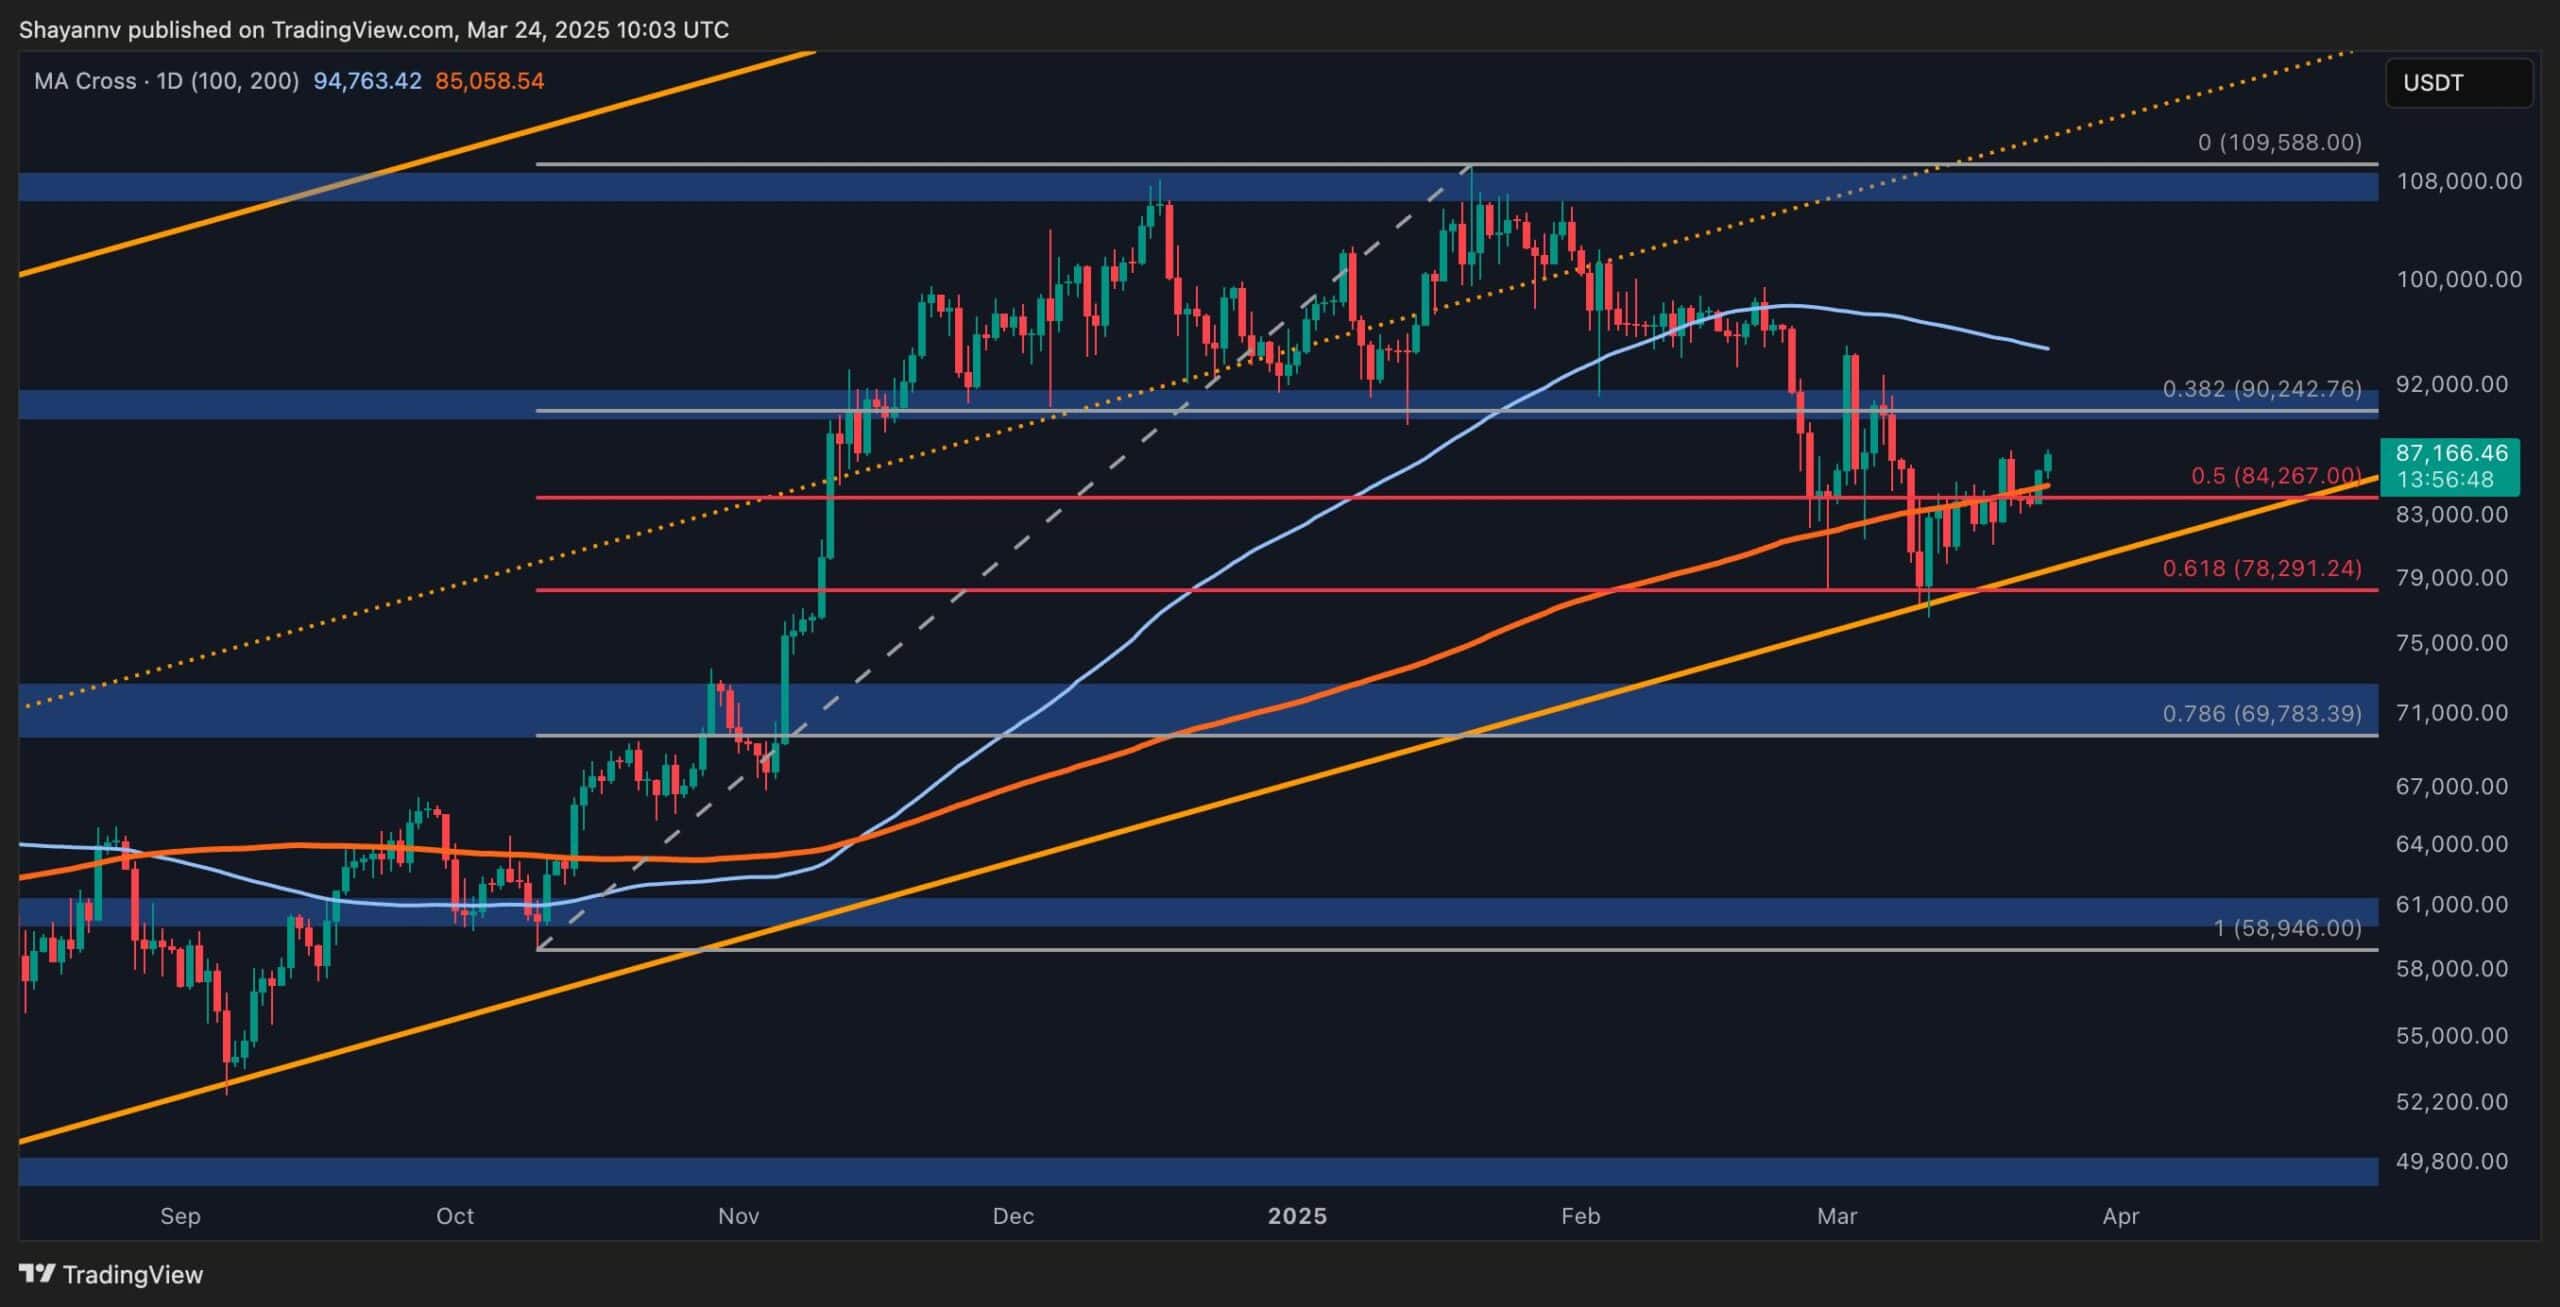
The 4-Hour Chart
In the lower timeframe, Bitcoin successfully broke out of its descending wedge pattern and formed a pullback, signaling a bullish move. Following this breakout, the price has seen a moderate surge, indicating increased buying interest.
Despite this, Bitcoin still faces a significant test at the $92K resistance zone, where notable selling pressure is expected. The price action at this level will likely determine BTC’s mid-term direction. In the short term, buyers seem poised to push the price toward $92K, with potential consolidation before the next decisive move.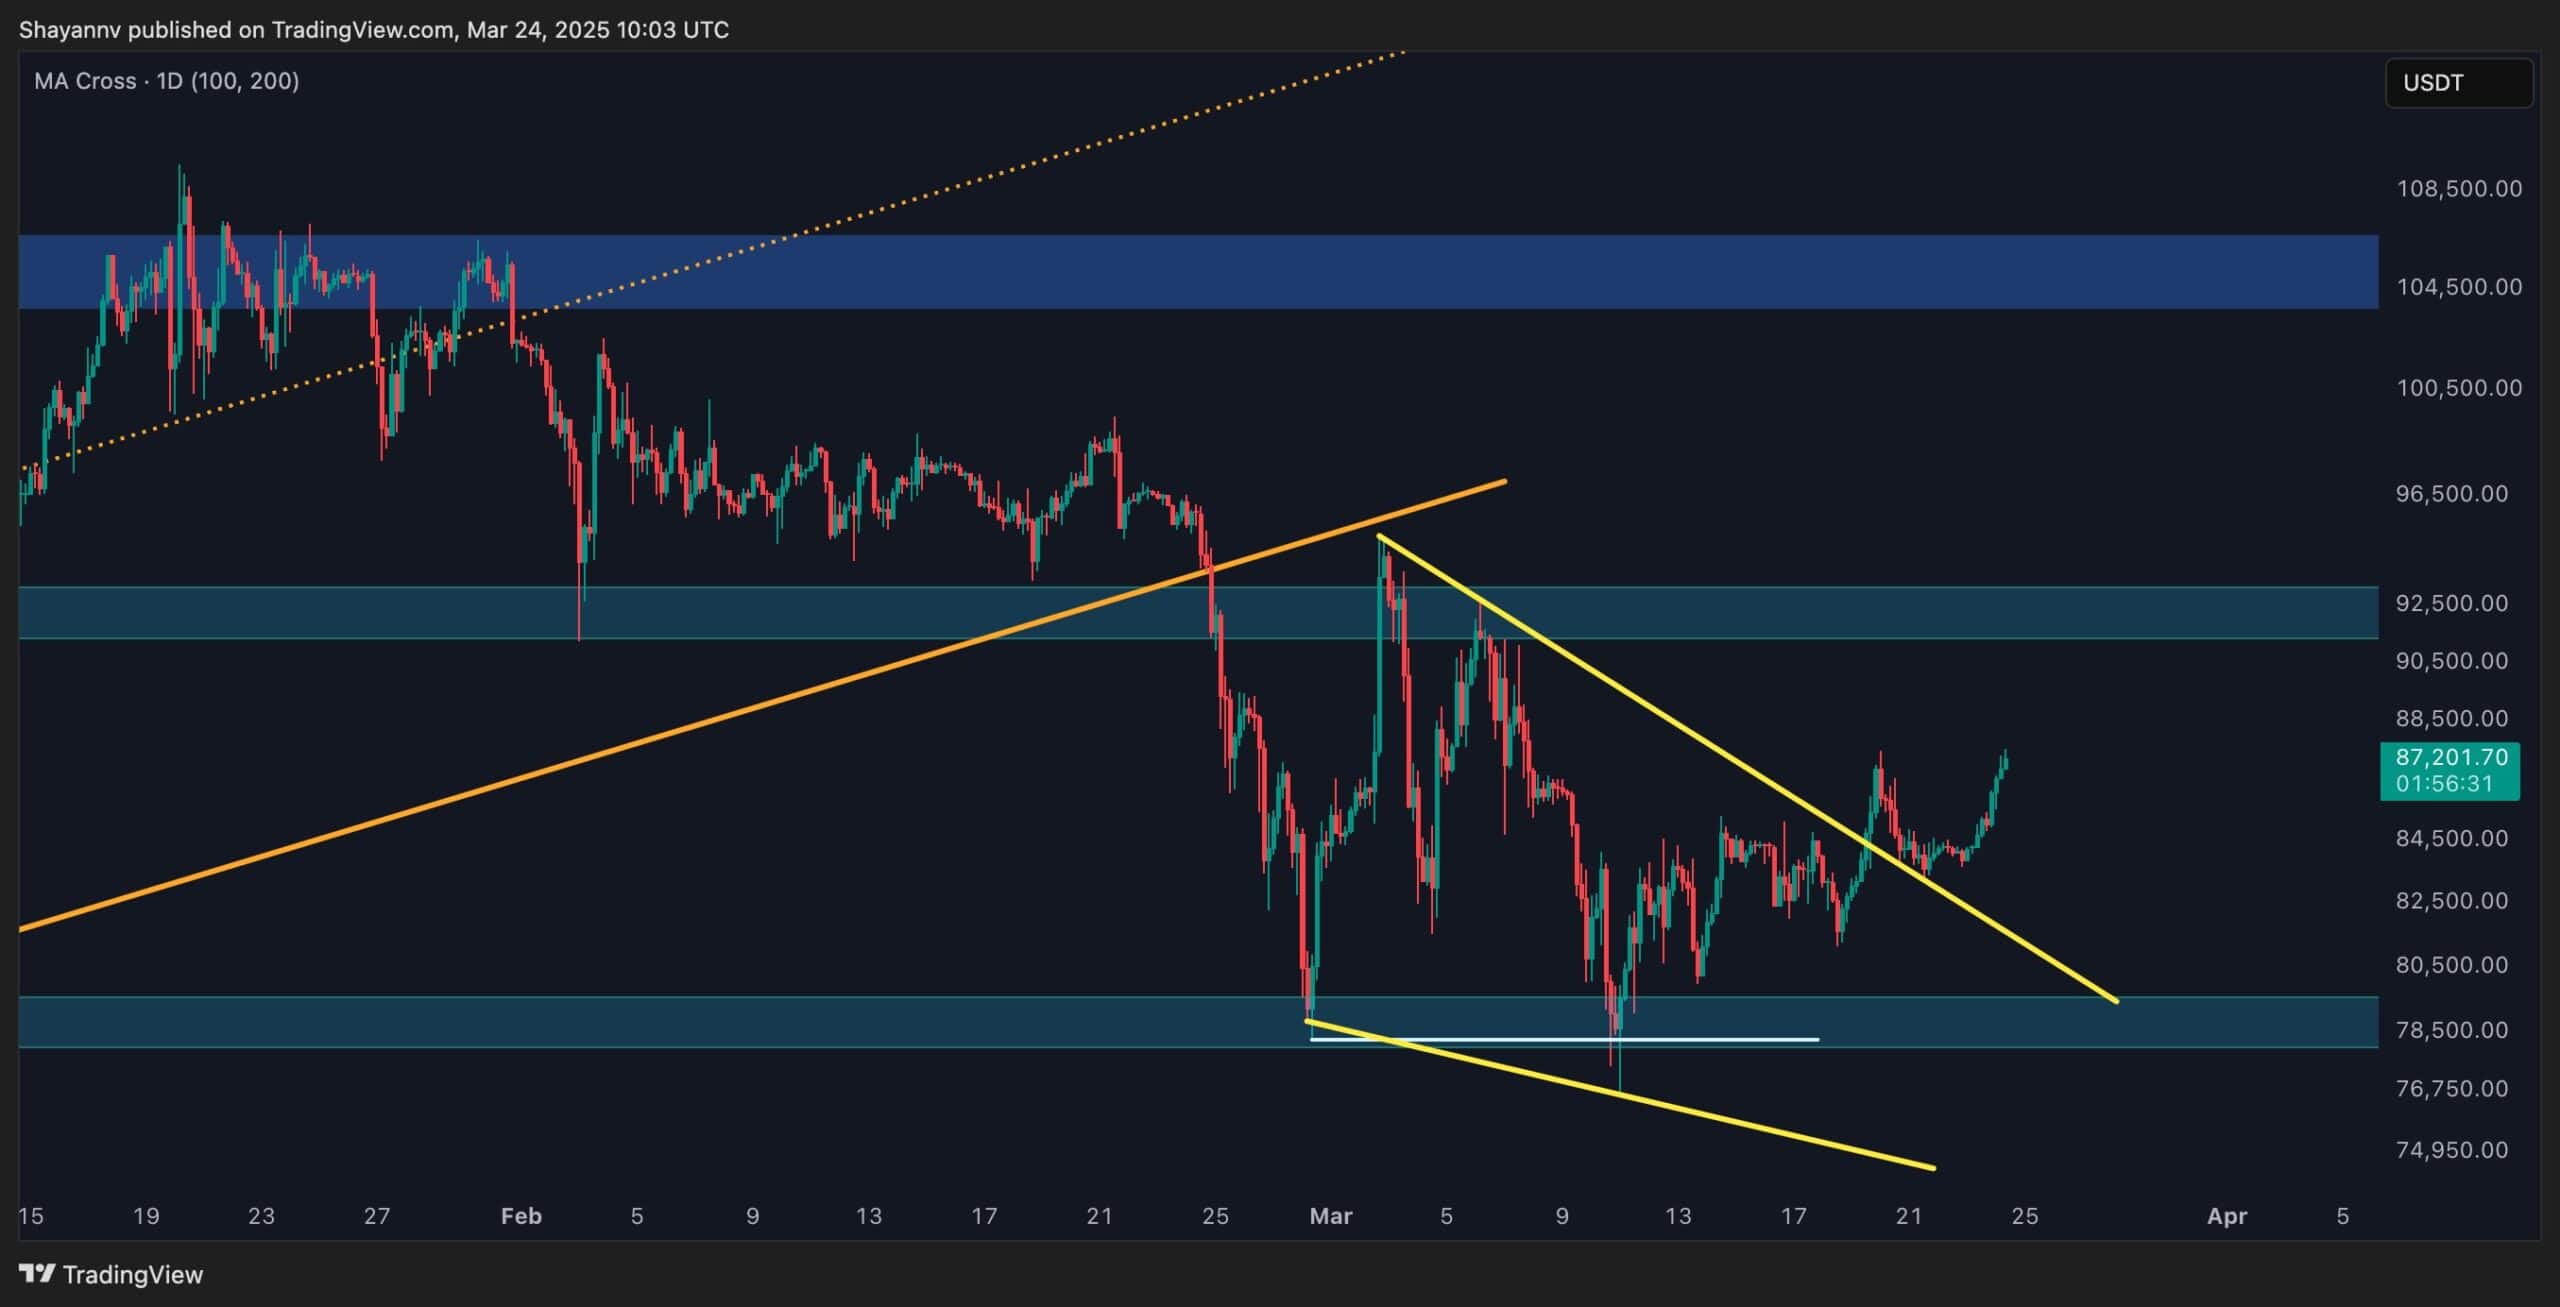
Sentiment Analysis
By Shayan
The Binance liquidation heatmap provides key insights into potential price targets, as liquidity levels often act as magnets for market movements. Recent market consolidation has led to the formation of a significant cluster of liquidation levels just above the $92K resistance.
These levels correspond to short-position liquidations, making them attractive targets for bulls and institutional buyers. As a result, Bitcoin’s price could be drawn toward this liquidity pocket, increasing the likelihood of a breakout above $92K in the mid-term.
Despite the current lack of strong bullish momentum, the $92K level remains a critical battleground. A decisive move above this resistance could lead to a sustained bullish trend. However, given the overall market conditions, Bitcoin could still experience lower price levels before a decisive breakout.
This potential downside would offer an excellent accumulation opportunity for smart money investors, positioning them ahead of the next major move.
The post Bitcoin Price Analysis: BTC Eyes $90K, but Momentum Shows Signs of Weakness appeared first on CryptoPotato.


 English (US) ·