
 1 month ago
17
1 month ago
17
Bitcoin price is holding gains above the $70,000 resistance. BTC is now showing positive signs and might aim for a move above the $73,000 level.
- Bitcoin price extended its increase and tested the $73,000 zone.
- The price is trading above $71,500 and the 100 hourly Simple moving average.
- There is a connecting bullish trend line forming with support at $71,300 on the hourly chart of the BTC/USD pair (data feed from Kraken).
- The pair could continue to move up if it clears the $72,850 and $73,000 resistance levels.
Bitcoin Price Sets New ATH
Bitcoin price remained stable above the $70,000 level. BTC gained pace and was able to extend its increase above the $72,500 level. It even spiked above the $72,850 resistance but the upsides were limited.
The price traded to a new all-time high at $73,000 before there was a downside correction. The price declined below the $72,000 and $71,500 levels. A low was formed near $68,660 and the price is again rising. There was a move above the $71,000 level.
The price cleared the 50% Fib retracement level of the downward move from the $73,000 swing high to the $68,660 low. There is also a connecting bullish trend line forming with support at $71,300 on the hourly chart of the BTC/USD pair.
Bitcoin is now trading above $71,500 and the 100 hourly Simple moving average. Immediate resistance is near the $72,000 level and the 76.4% Fib retracement level of the downward move from the $73,000 swing high to the $68,660 low.
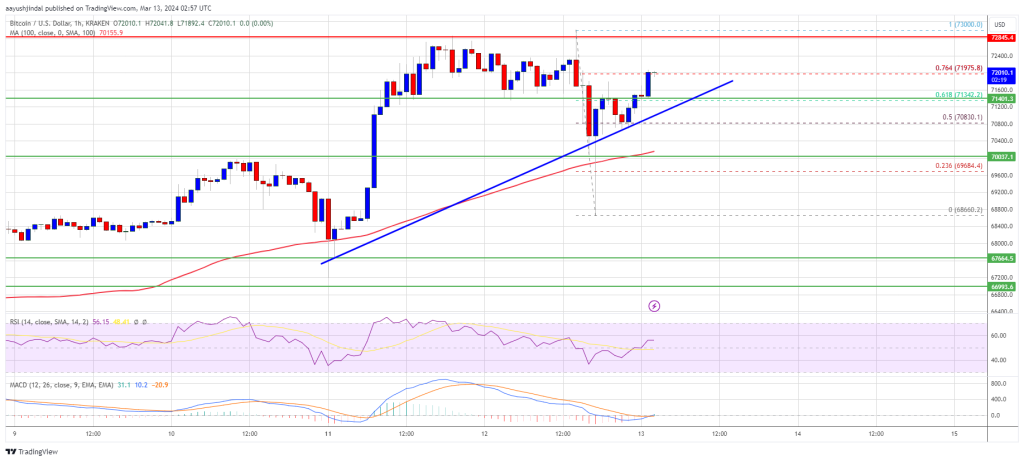
Source: BTCUSD on TradingView.com
The next key resistance could be $72,850, above which the price could rise toward the $73,000 resistance zone. If there is a clear move above the $73,000 resistance zone, the price could even attempt a move above the $74,000 resistance zone. Any more gains might send the price toward the $75,000 level.
Another Downside Correction In BTC?
If Bitcoin fails to rise above the $72,000 resistance zone, it could start a downside correction. Immediate support on the downside is near the $71,300 level and the trend line.
The first major support is $70,000 or 100 hourly SMA. If there is a close below $70,000, the price could start a decent pullback toward the $68,650 level. Any more losses might send the price toward the $66,500 support zone.
Technical indicators:
Hourly MACD – The MACD is now gaining pace in the bullish zone.
Hourly RSI (Relative Strength Index) – The RSI for BTC/USD is now above the 50 level.
Major Support Levels – $71,300, followed by $70,000.
Major Resistance Levels – $72,000, $72,850, and $73,000.


 English (US) ·