
 8 months ago
75
8 months ago
75
Bitcoin is trading below the $100K mark after a rollercoaster of a week, marked by intense volatility and sustained selling pressure. Last Sunday, the cryptocurrency faced extreme market turbulence, dropping over 9% in less than 24 hours. While BTC managed a recovery bounce on Monday, the selling pressure has not subsided, leaving the market uncertain about its next direction.
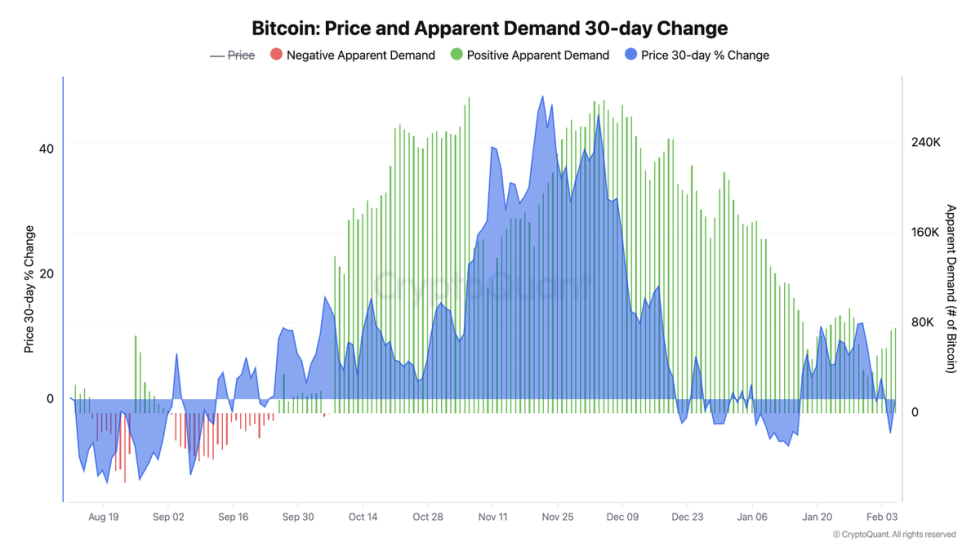
Amid this turbulent price action, key metrics highlight a critical relationship between Bitcoin’s performance and demand growth. CryptoQuant’s Head of Research, Julio Moreno, shared insights on X, revealing that Bitcoin’s price return is closely tied to its demand growth. Moreno emphasized that slowing demand since early December has directly correlated with diminished returns, underscoring the crucial role of market participation in sustaining bullish momentum.
This observation sheds light on the current state of the market, where declining speculative appetite and weakening leveraged positions are contributing to choppy price action. As Bitcoin hovers below the $100K mark, both bulls and bears are locked in a battle for control, with demand growth serving as a pivotal factor in determining the cryptocurrency’s trajectory. With market participants closely monitoring these dynamics, the coming days could prove decisive for BTC’s short-term and long-term outlook.
Bitcoin Demand Declines As Investors Fear A Correction
Bitcoin has faced significant volatility and selling pressure since the start of February, sending ripples through the broader crypto market. Altcoins and meme coins, often more vulnerable during bearish trends, have experienced even sharper price drops, amplifying uncertainty among investors. Analysts are increasingly signaling a potential correction, citing tired bulls and bearish price action that hints at further declines.
Moreno provided key insights on X, linking Bitcoin’s price performance directly to demand growth. According to Moreno, Bitcoin’s price return closely follows the trajectory of its demand growth.
Since early December, demand growth has been slowing, which aligns with the weakening momentum in Bitcoin’s gains. Moreno emphasizes the importance of monitoring demand growth as a critical indicator to predict Bitcoin’s next rally.
Currently, Bitcoin’s price is hovering around $96K as bulls struggle to reclaim and hold the psychological $100K mark. This level is not only a critical point of resistance but also a major factor in determining short-term market sentiment.
Without a breakout above $100K, BTC remains vulnerable to additional selling pressure and a potential drop to lower demand zones. However, reclaiming this level and holding it as support would signal a shift in momentum, paving the way for a potential rally.
BTC Price Showing Indecision
Bitcoin is currently trading at $96,700 after several days of sideways price action between $100,000 and $95,600. The market appears stuck in a range, with no clear short-term direction as both bulls and bears struggle for control. Bulls lost their grip on momentum after the price fell below the crucial $100K level last Tuesday, and they have been unable to reclaim it since.
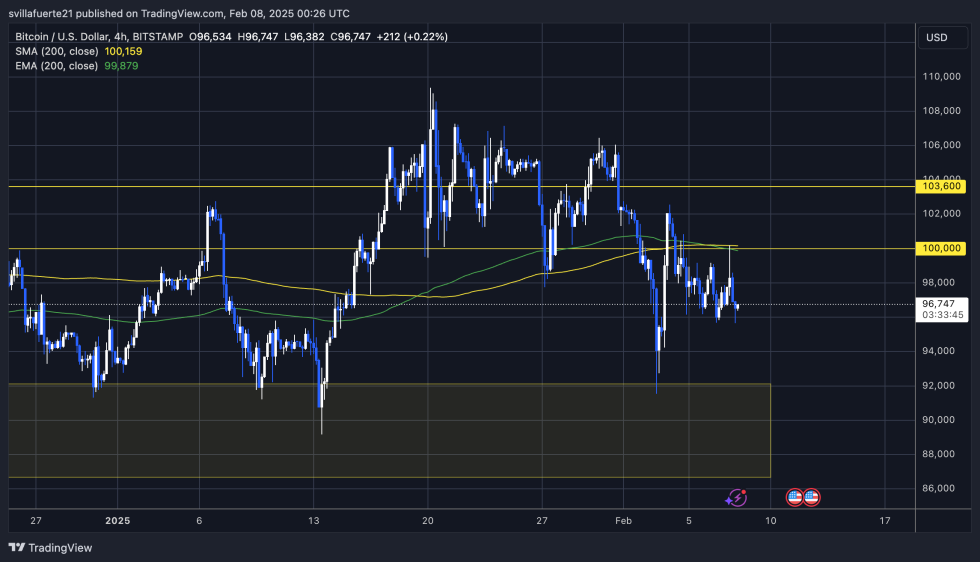
The lack of upward movement has raised concerns among investors, as Bitcoin’s inability to break above $100K could signal growing weakness in the market. Meanwhile, bears have been applying consistent pressure, but they have yet to force the price below the critical $95K support level.
If Bitcoin drops below $95K in the coming days, a further decline into the $90K demand zone is likely. This would mark a significant bearish move and could lead to increased selling pressure as investors grow wary of a deeper correction.
However, if BTC can maintain its position above $95K, there is still potential for bulls to regain strength and push the price back toward the $100K mark. For now, the market remains uncertain, and traders are closely monitoring these key levels for signs of the next major move.
Featured image from Dall-E, chart from TradingView


 English (US) ·