Feb 17, 2025 at 13:27 // Price
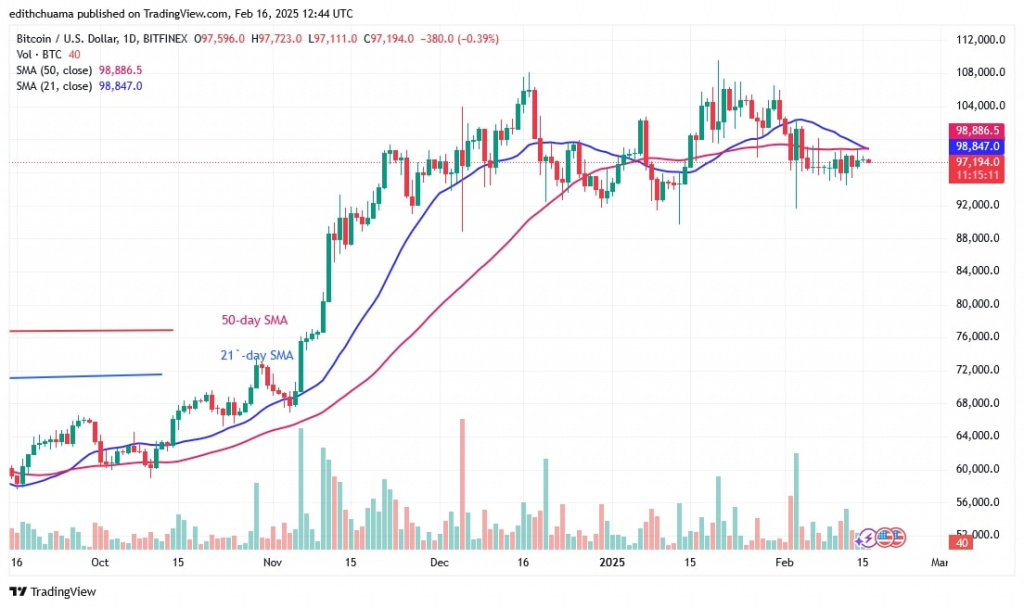
Bitcoin (BTC) price has been trading above the $94,000 support but below the moving average lines since February 3.
Bitcoin price long-term forecast: bearish
The moving average lines have hindered the upside moves. The price has not been able to sustain above the moving average lines by buyers.
The cryptocurrency would reach its high of $104,000 if the moving average lines are broken. The negative trend has stalled above the $94,000 support on the downside. The bears have failed to push the price to $90,000.
On the downside, the selling pressure ends at lower price points. The Bitcoin price is currently at $96,951.
Analysis of the Bitcoin price indicators
Bitcoin is consolidating above the $94,000 support, but the 50-day SMA is rejecting the uptrend. There is a possibility that the 21-day SMA will fall below the 50-day SMA.
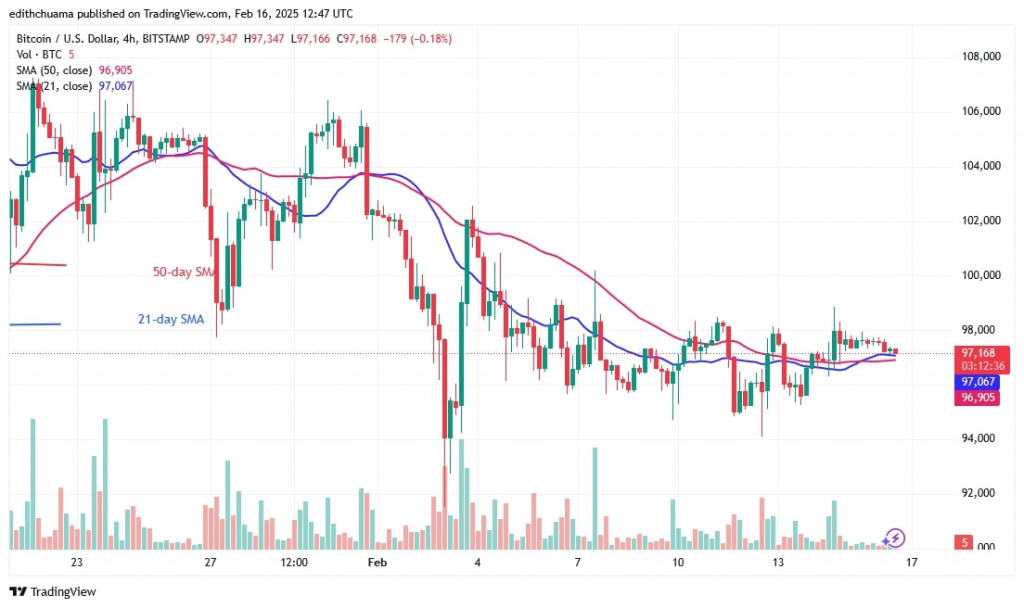
Consequently, BTC will experience renewed selling pressure. Doji candlesticks have appeared on the 4-hour chart as Bitcoin consolidates.
Technical indicators
Key supply zones: $108,000, $109,000, $110,000
Key demand zones: $90,000, $80,000, $70,000

What is the next move for Bitcoin?
Bitcoin is trading in a small range between $94,000 and $98,000 on the 4-hour chart. The price movement has remained steady due to the presence of doji candlesticks.
According to the price analysis by Coinidol.com, Bitcoin price is moving both above and below the moving average lines. While the upside moves consolidate above the moving average lines, they are rejected at the $98,000 high.

Disclaimer. This analysis and forecast are the personal opinions of the author. They are not a recommendation to buy or sell cryptocurrency and should not be viewed as an endorsement by CoinIdol.com. Readers should do their research before investing in funds.

 8 months ago
52


 English (US) ·