
 1 week ago
24
1 week ago
24
Bitcoin price extended its increase above the $64,000 resistance. BTC is now holding gains above $62,800 and might aim for more upsides.
- Bitcoin traded to a new weekly high at $65,500 before there was a downside correction.
- The price is trading above $63,500 and the 100 hourly Simple moving average.
- There is a key bullish trend line forming with support at $63,350 on the hourly chart of the BTC/USD pair (data feed from Kraken).
- The pair could aim for more upsides if it clears the $64,500 and $65,500 resistance levels.
Bitcoin Price Aims Higher
Bitcoin price remained well-bid above the $62,500 support zone and extended its increase. BTC was able to clear the $64,500 resistance. It even cleared $65,000 and tested $65,500.
A high was formed at $65,550 and the price is now correcting gains. There was a minor decline below the $64,000 level. The price tested the 23.6% Fib retracement level of the upward move from the $56,380 swing low to the $65,550 high.
However, the bulls are active near the $63,000 zone. There is also a key bullish trend line forming with support at $63,350 on the hourly chart of the BTC/USD pair.
Bitcoin is now trading above $63,000 and the 100 hourly Simple moving average. Immediate resistance is near the $64,500 level. The first major resistance could be $65,000. The next key resistance could be $65,500.
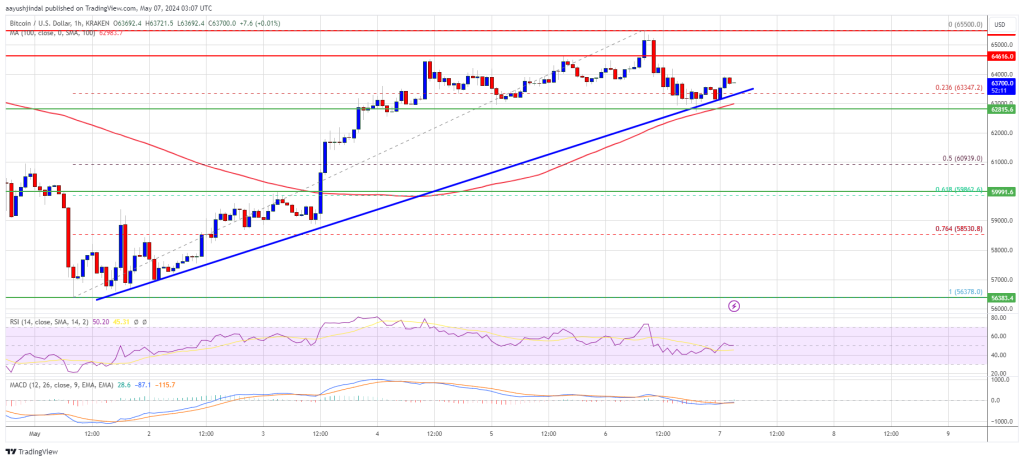
Source: BTCUSD on TradingView.com
A clear move above the $65,500 resistance might send the price higher. The next resistance now sits at $67,200. If there is a clear move above the $67,200 resistance zone, the price could continue to move up. In the stated case, the price could rise toward $68,800.
Another Drop In BTC?
If Bitcoin fails to rise above the $65,500 resistance zone, it could start another decline. Immediate support on the downside is near the $63,350 level and the trend line.
The first major support is $62,800. If there is a close below $62,800, the price could start to drop toward the 50% Fib retracement level of the upward move from the $56,380 swing low to the $65,550 high at $60,800. Any more losses might send the price toward the $60,000 support zone in the near term.
Technical indicators:
Hourly MACD – The MACD is now gaining pace in the bullish zone.
Hourly RSI (Relative Strength Index) – The RSI for BTC/USD is now near the 50 level.
Major Support Levels – $63,350, followed by $62,800.
Major Resistance Levels – $64,500, $65,000, and $65,500.


.png)


 English (US) ·