
 1 month ago
73
1 month ago
73
TLDR:
- Bitcoin price trades near $63,400, but a six-month decline of 78,000 BTC in exchange reserves points to continued withdrawal and quieter accumulation.
- The $59,800 to $61,400 demand zone remains the main defense, while a confirmed loss of $57,700 could expose $55,000, $52,000, and $50,000.
- Federal Reserve rate risks, weak technology shares, limited ETF demand, and the stalled Clarity Act continue to restrict near-term recovery momentum.
- A reclaim of $65,000 and a breakout above $67,000 would improve structure, while a sustained move over $70,000 could open the $74,000 to $76,000 range.
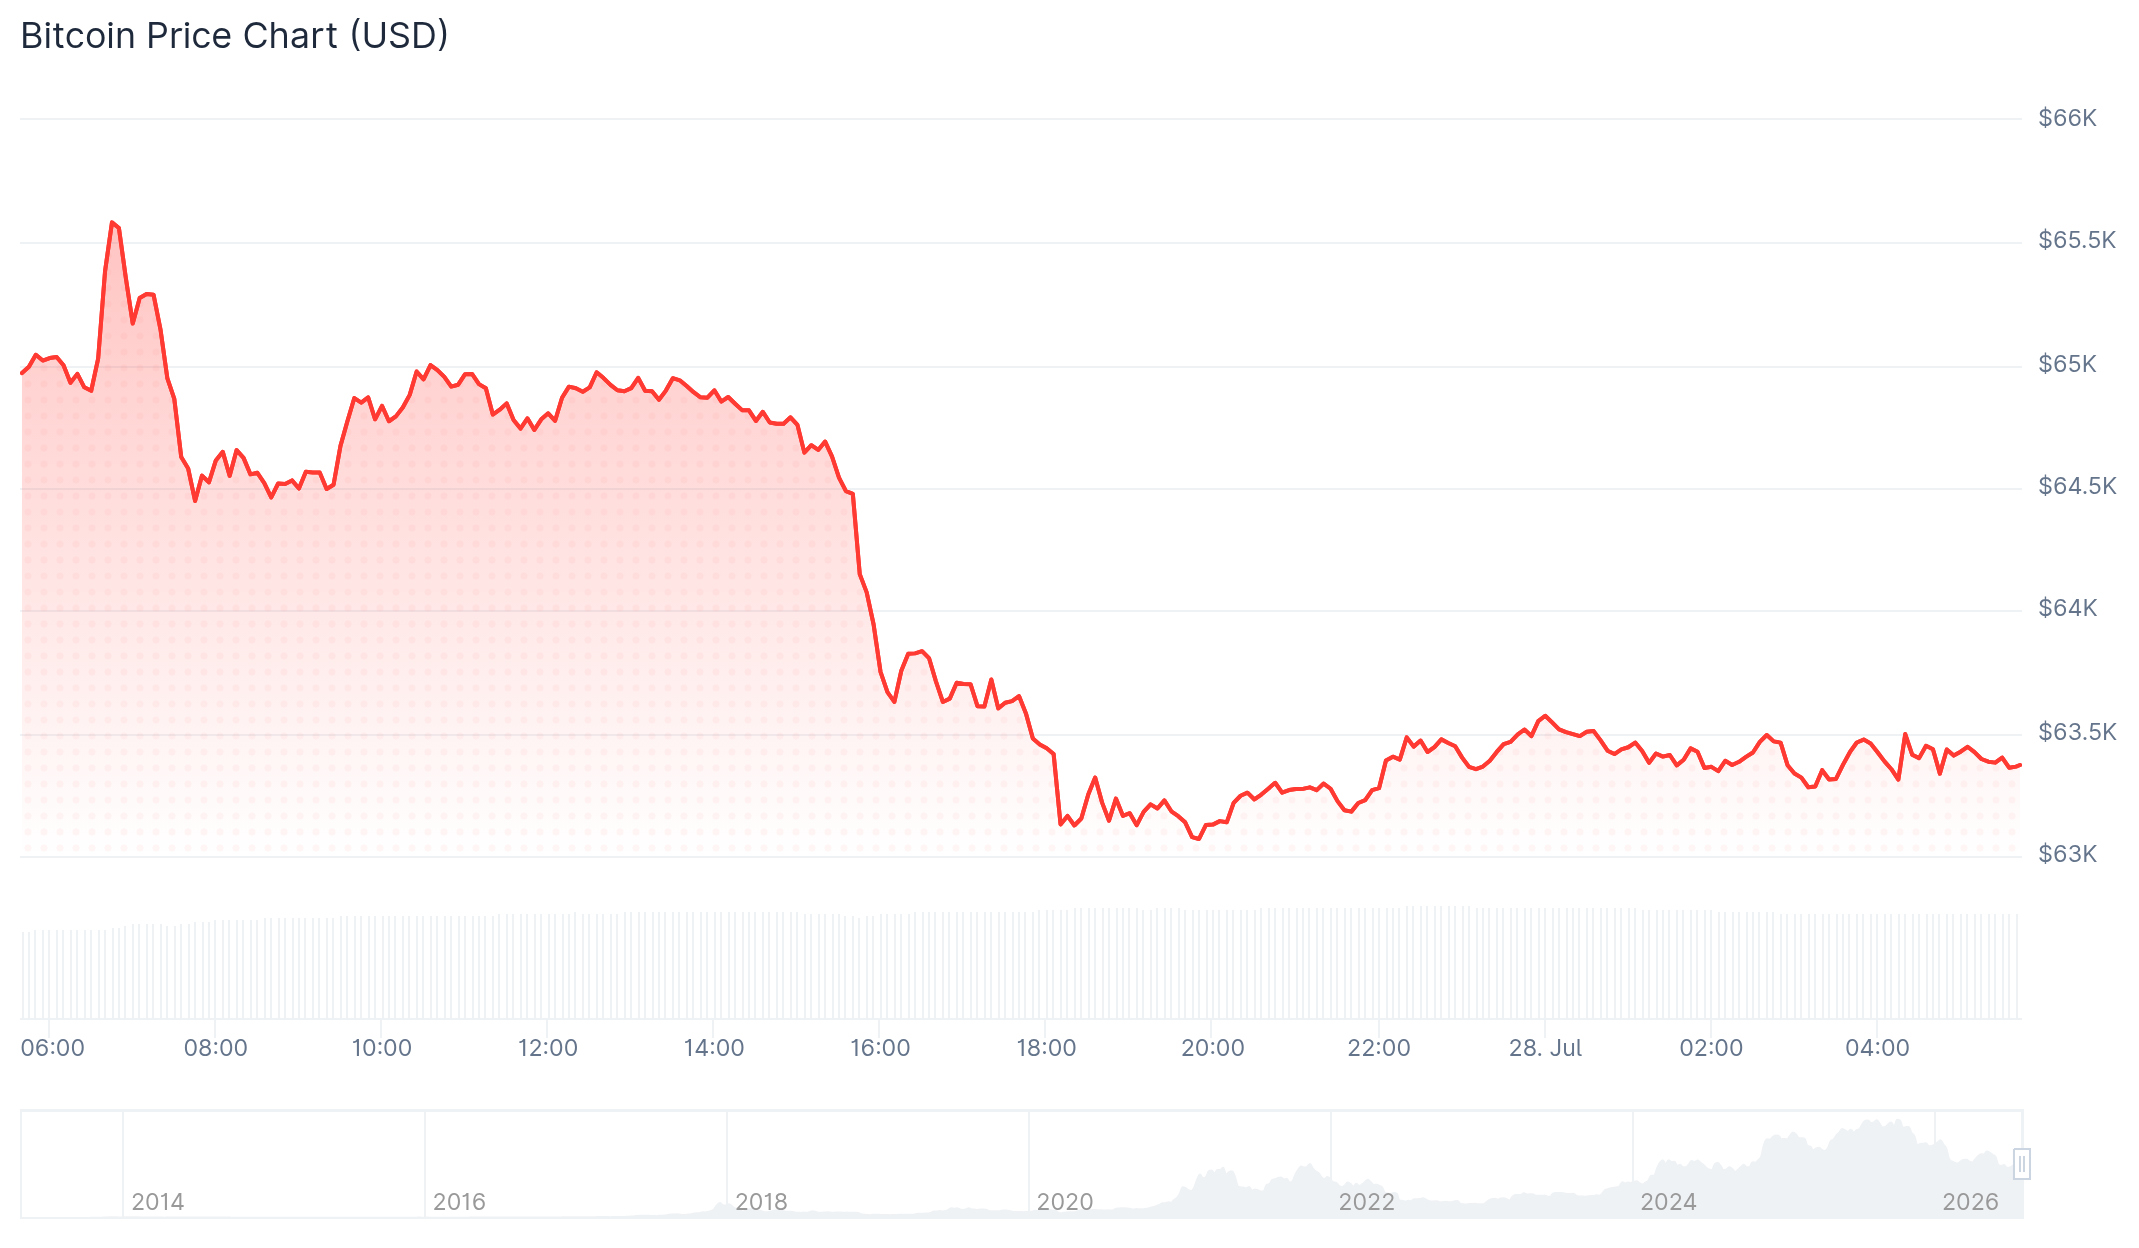
Bitcoin price trades near $63,400 on July 28. Fresh selling pushed the market beneath its 50-day exponential moving average. The decline reflects weaker risk appetite, rising rate concerns, cautious institutional demand, and uncertainty around the Clarity Act.
Yet the on-chain picture appears less bearish. Bitcoin exchange reserves have fallen by 78,000 BTC in six months, dropping from 2.783 million to 2.705 million BTC. Coins continue leaving trading platforms during the correction, suggesting holders prefer self-custody over immediate selling. That supply shift contrasts with typical capitulation, when investors transfer assets onto exchanges and increase available sell-side liquidity quickly.
 Bitcoin price (BTC)
Bitcoin Price Faces Macro Pressure Near Critical Support
Bitcoin price weakness now follows a wider retreat across global risk markets. Total crypto capitalization has fallen about 2.8% to $2.17 trillion, while altcoins continue recording steeper losses.
Technology shares are adding pressure. South Korea’s Kospi has dropped almost 11%, while Japan’s Nikkei has fallen about 4%. Nasdaq futures have also weakened before earnings from Meta, Microsoft, Apple, and Amazon. Investors question whether heavy artificial intelligence spending can produce returns quickly enough.
Federal Reserve expectations further weigh on sentiment. Markets assign roughly a 38% chance to a 25-basis-point increase this week, compared with about 12% ten days earlier. September tightening odds have moved near 80%, keeping liquidity-sensitive assets under pressure.
Institutional demand has not provided a firm counterweight. United States spot Bitcoin funds recorded late-Week outflows after a seven-session inflow streak. However, the products still completed a third consecutive positive-Week. The modest gain shows demand has returned, though not with typical bull-market strength.
The Clarity Act has also lost momentum in the Senate. Lawmakers are prioritizing federal nominations and a Russia sanctions package before the August recess. That schedule narrows the window for a floor vote and removes a possible near-term policy catalyst.
Technically, the Bitcoin price failed near $67,000, where the June high, 100-day average, and falling trendline converge. It then moved below the 50-day average near $65,000, while the relative strength index stayed under 50.
Bitcoin Price On-Chain Supply Signals Quiet Accumulation
Bitcoin exchange reserves now sit near cycle lows despite the sharp drawdown from the October 2025 peak of $126,200. That divergence matters since capitulation usually sends more coins toward exchanges, where holders can sell them.
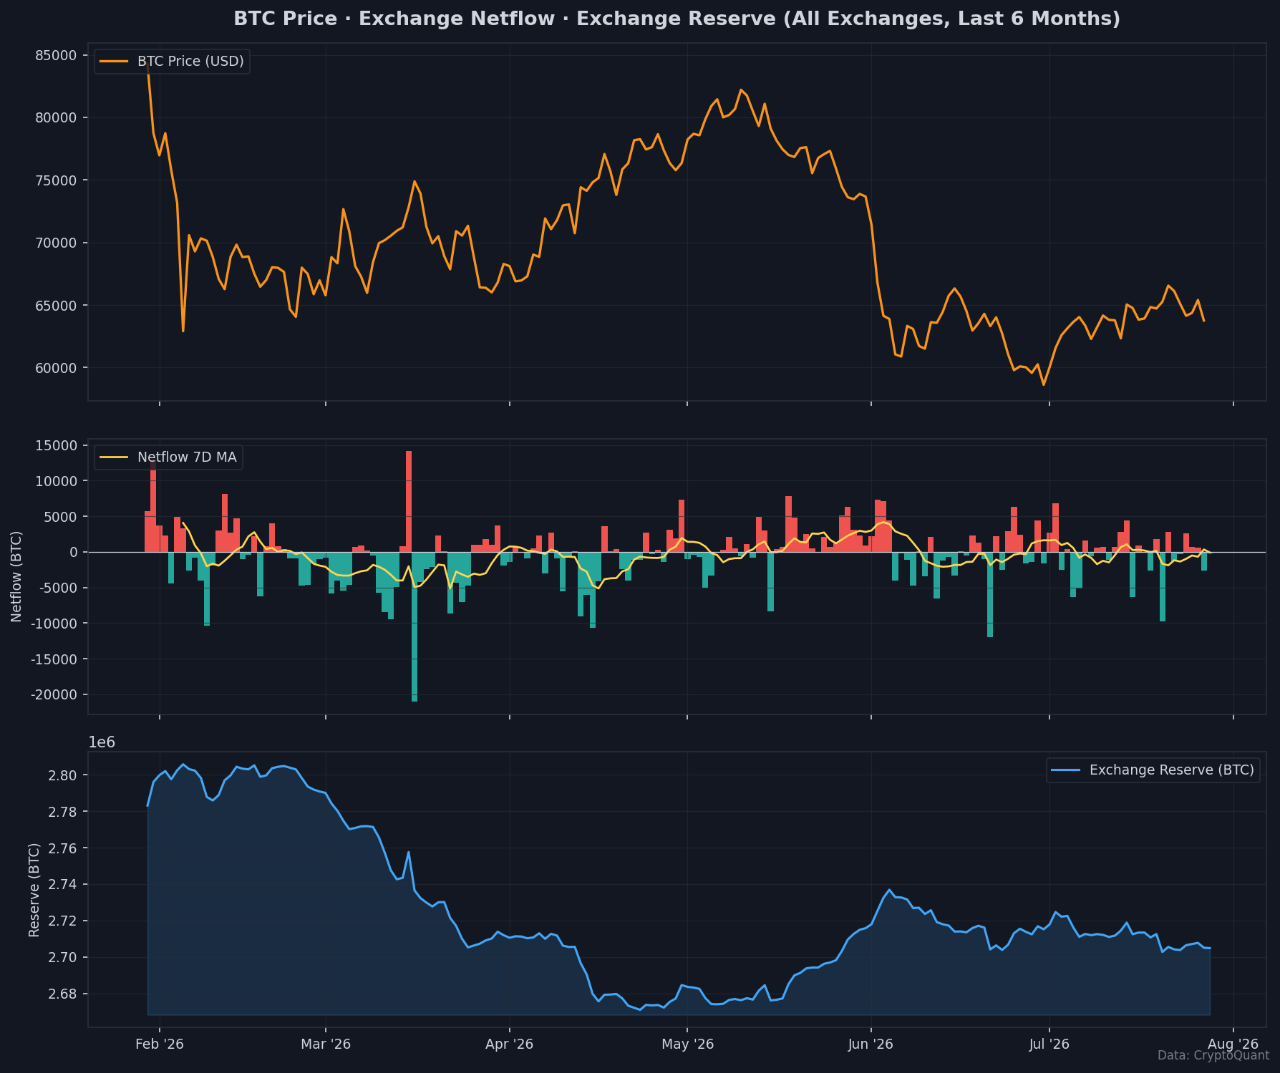 Source: CryptoQuant data
Instead, withdrawals have dominated. Analyst Woo Minkyu describes the pattern as quiet accumulation, with long-term holders moving supply into self-custody. Falling available inventory can reduce sell-side liquidity and amplify a recovery when spot demand improves.
Initial support sits at $60,000, followed by the 2026 low near $57,700. A confirmed break below that floor would expose $55,000, $52,000, and potentially $50,000.
Ted Pillows presents two policy-linked scenarios around the Clarity Act. Holding the $59,800 to $61,400 demand zone could support a recovery through $66,000 and $70,000. A clean move above $70,000 would strengthen a run toward $74,000 to $76,000.
Rejection or prolonged delay could pressure sentiment further. Losing $60,000 and failing to reclaim it would strengthen the bearish case toward $50,000.
EGRAG Crypto also points to previous cycle timing. Earlier macro lows arrived roughly 800 to 1,000 days after each halving. The last three cycles took 1,003, 973, and 914 days, keeping late 2026 in focus.
#BTC – “This Time Is Different” Is the Most Dangerous Phrase  :$BTC previous macro bottoms arrived roughly 800–1,000 days after each halving:
1⃣2012 → 1,003 days
2⃣2016 → 973 days
3⃣2020 → 914 days
If history rhymes again, late 2026 remains a major bottoming window.… pic.twitter.com/mQqTVlbB85
— EGRAG CRYPTO (@egragcrypto) July 28, 2026
The Bitcoin price is also approaching the monthly 50-period and 88-period moving-average zone, where earlier cycle bottoms developed. Meanwhile, the seven-day netflow average remains the key supply signal. A sustained turn would suggest renewed distribution as exchange inflows begin rising. Another test near $58,000 could follow during coming sessions.
The post Bitcoin Price Tests $60K as Exchange Reserves Signal Accumulation appeared first on Blockonomi.



 English (US) ·