
 3 months ago
40
3 months ago
40
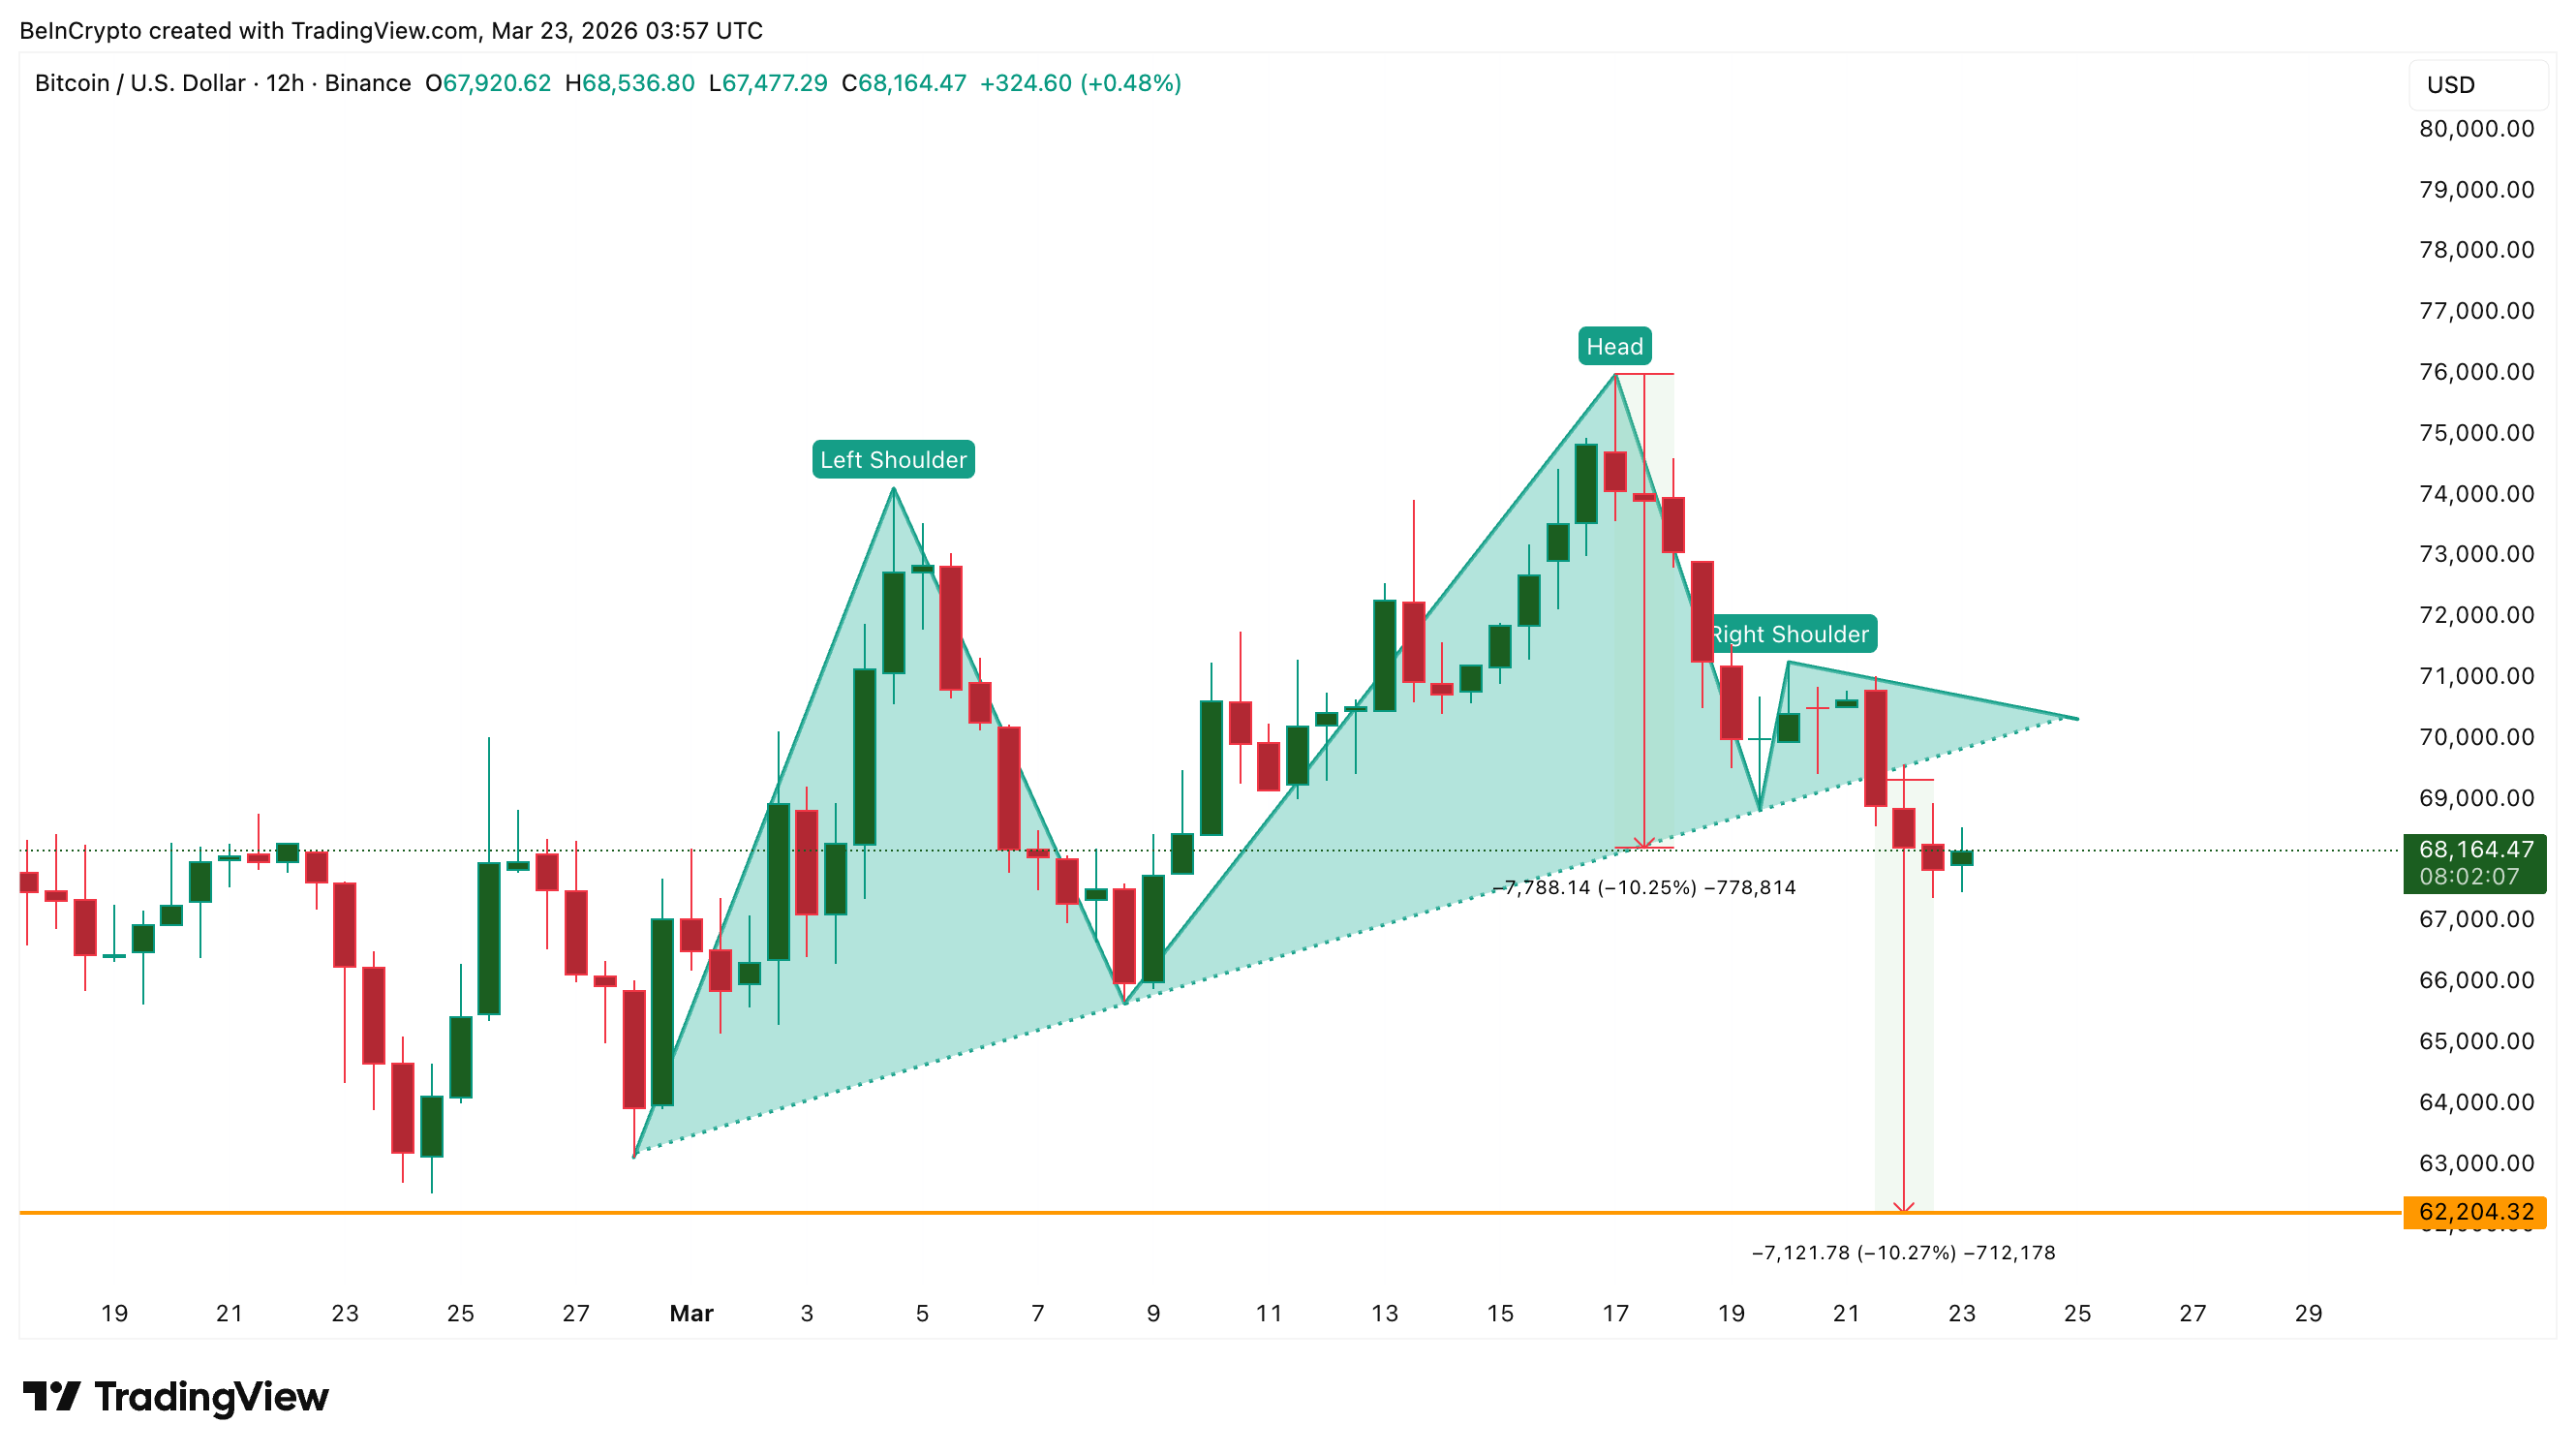
Bitcoin (BTC) price dropped 6% over the past week to trade near $68,100 after breaking a head-and-shoulders neckline on March 21.
The breakdown activated a measured move target near $62,200, roughly 10% below the neckline. However, on-chain data shows whales and long-term holders are accumulating aggressively, setting up a tug-of-war between technical weakness and conviction-driven buying.
Head-and-Shoulders Breakdown Puts $62,200 in Play
Bitcoin completed a head-and-shoulders pattern on the 12-hour chart that had been forming since late February. The neckline of this bearish pattern finally gave way on March 21.
The neckline was upsloping, which typically reflects steady buying pressure underneath. When that kind of support fails, the resulting selloff tends to be sharper because it removes the very floor that dip buyers were leaning on. The measured move from the neckline points to approximately $62,200, a 10.25% decline from the breakdown level.
Want more token insights like this? Sign up for Editor Harsh Notariya’s Daily Crypto Newsletter here.
 BTC Head-and-Shoulders Breakdown: TradingView
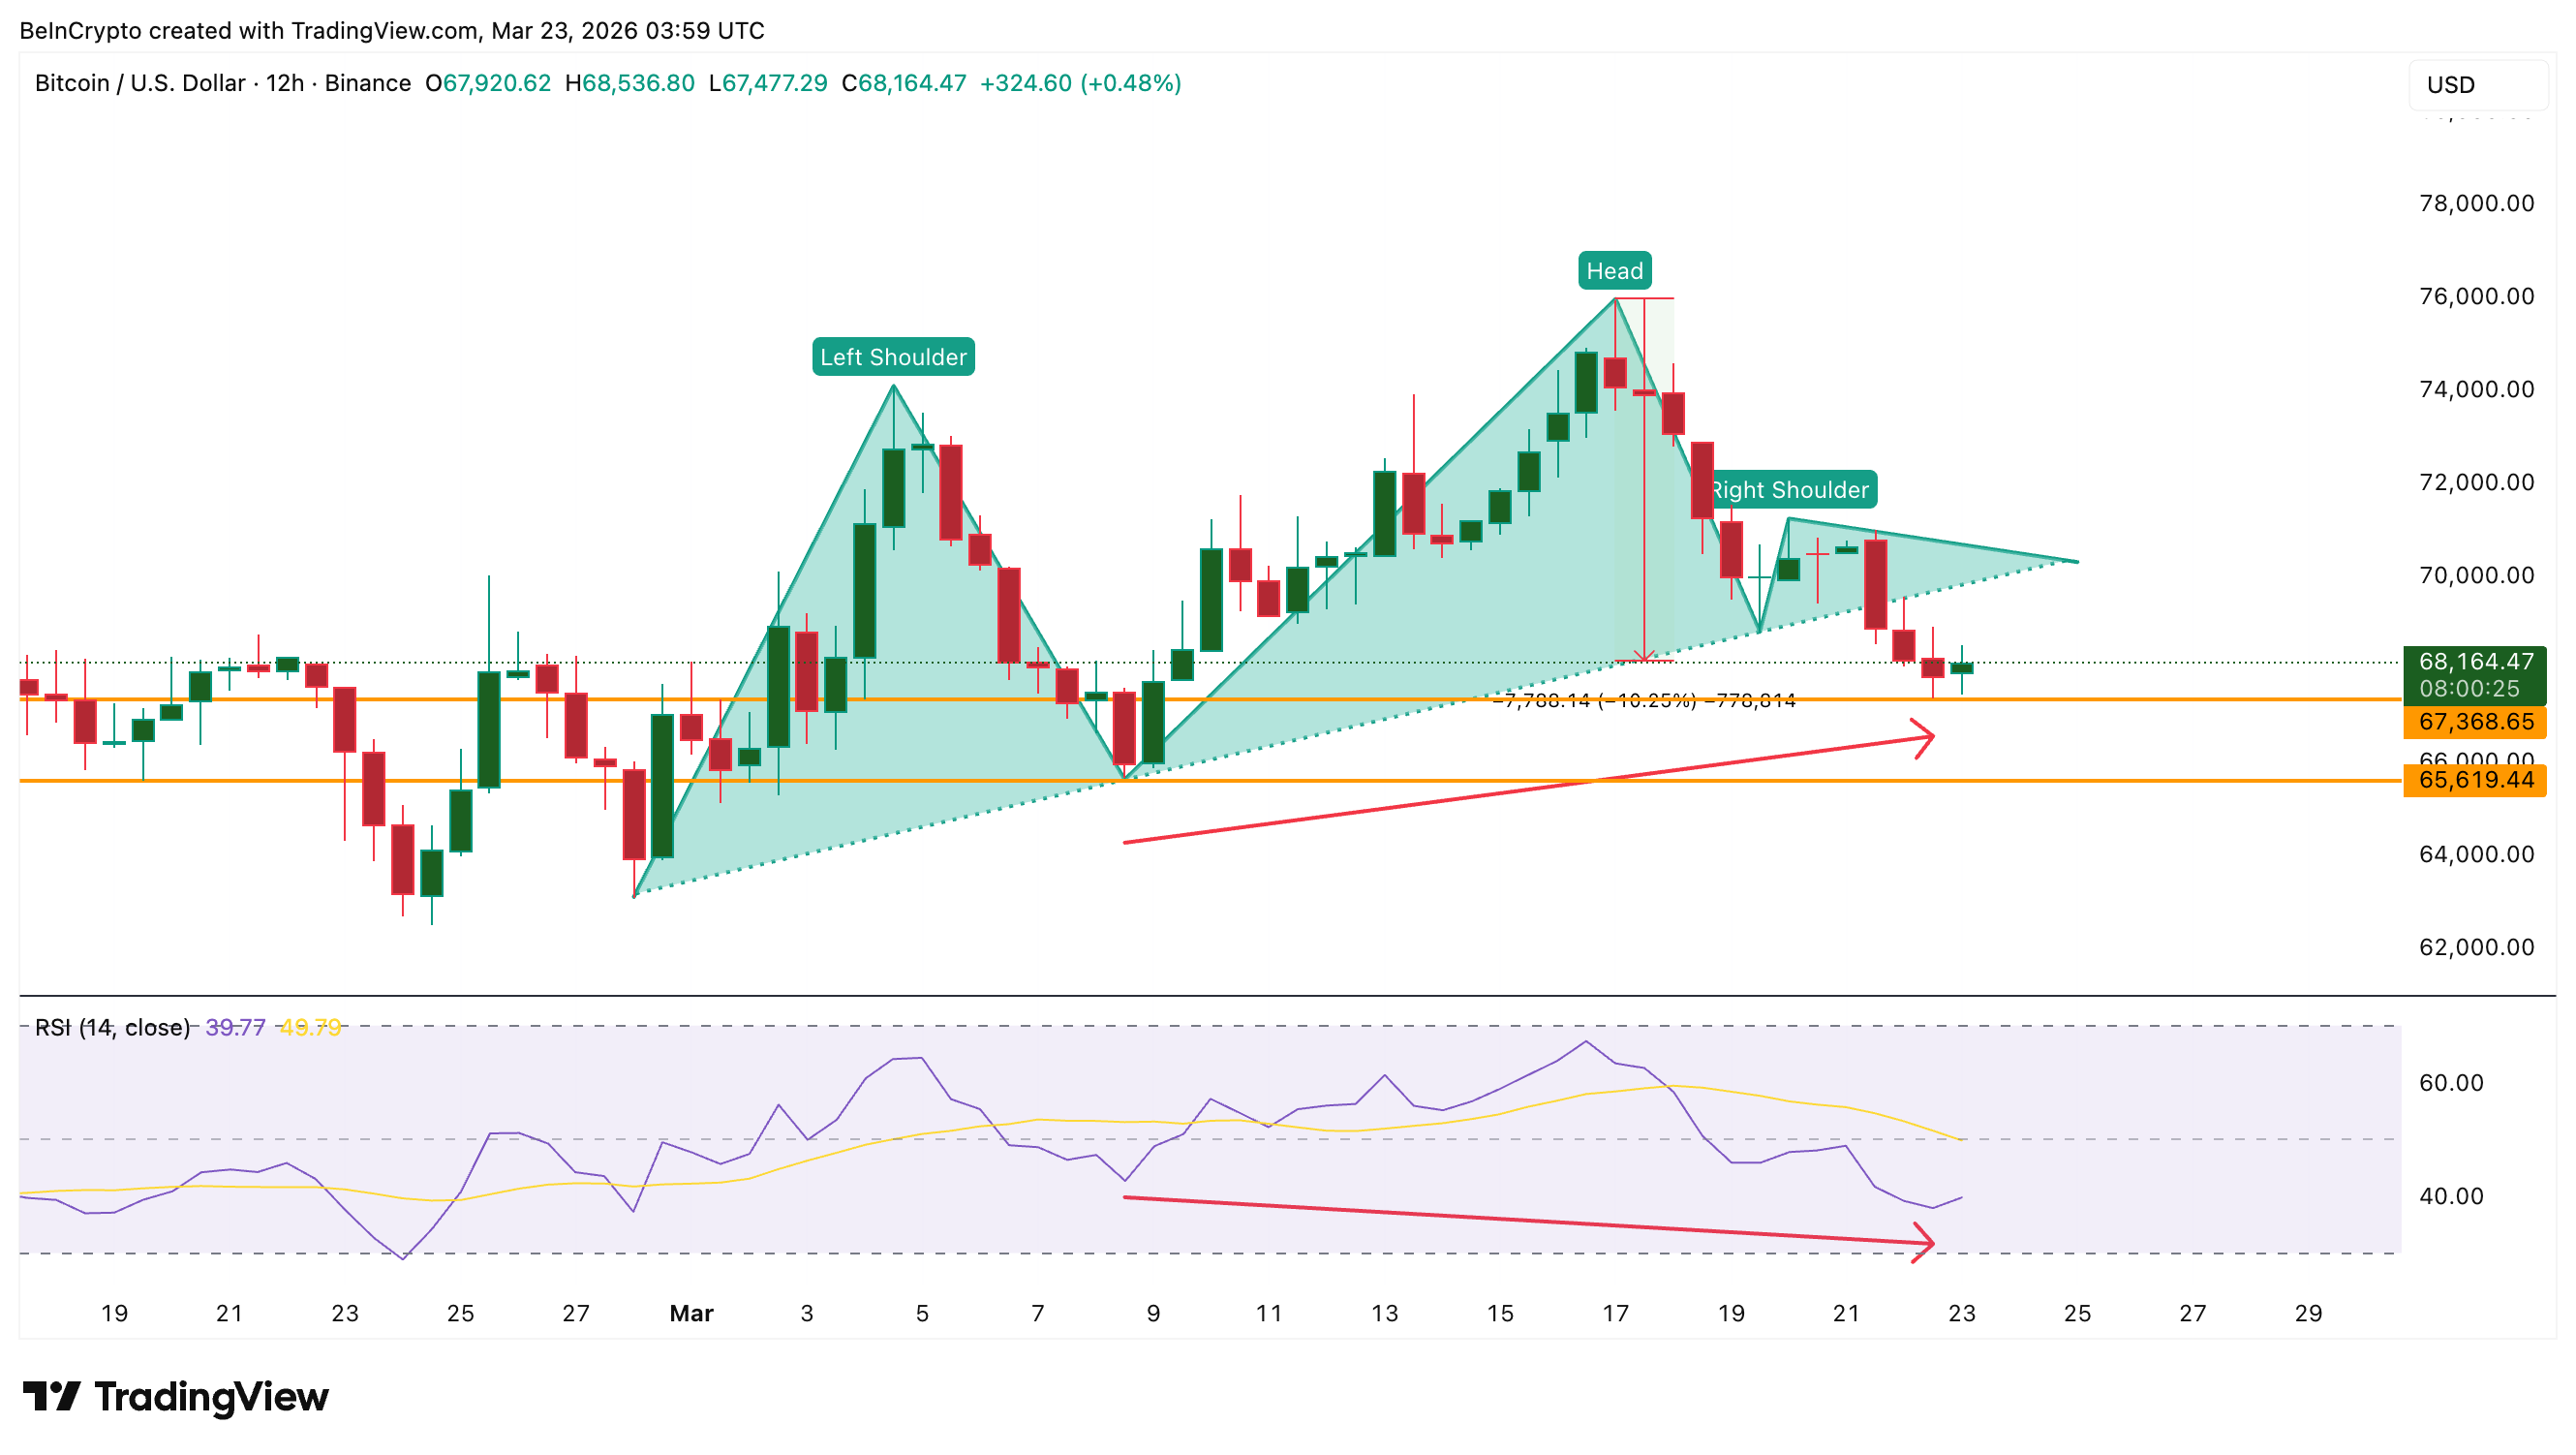
One potential offset exists on the same chart. Between March 8 and March 22, Bitcoin price carved a higher low on the candles while the Relative Strength Index (RSI), a momentum indicator, printed a lower low. This hidden bullish divergence suggests momentum may be slightly overstating the weakness, leaving room for a short-term bounce.
 BTC RSI Hidden Bullish Divergence: TradingView
The RSI currently reads 39.77, below the neutral 50 line but not yet in oversold territory. Whether that bounce has any staying power depends on who is buying and how much resistance sits above.
Whales and Long-Term Holders Turn Opportunistic
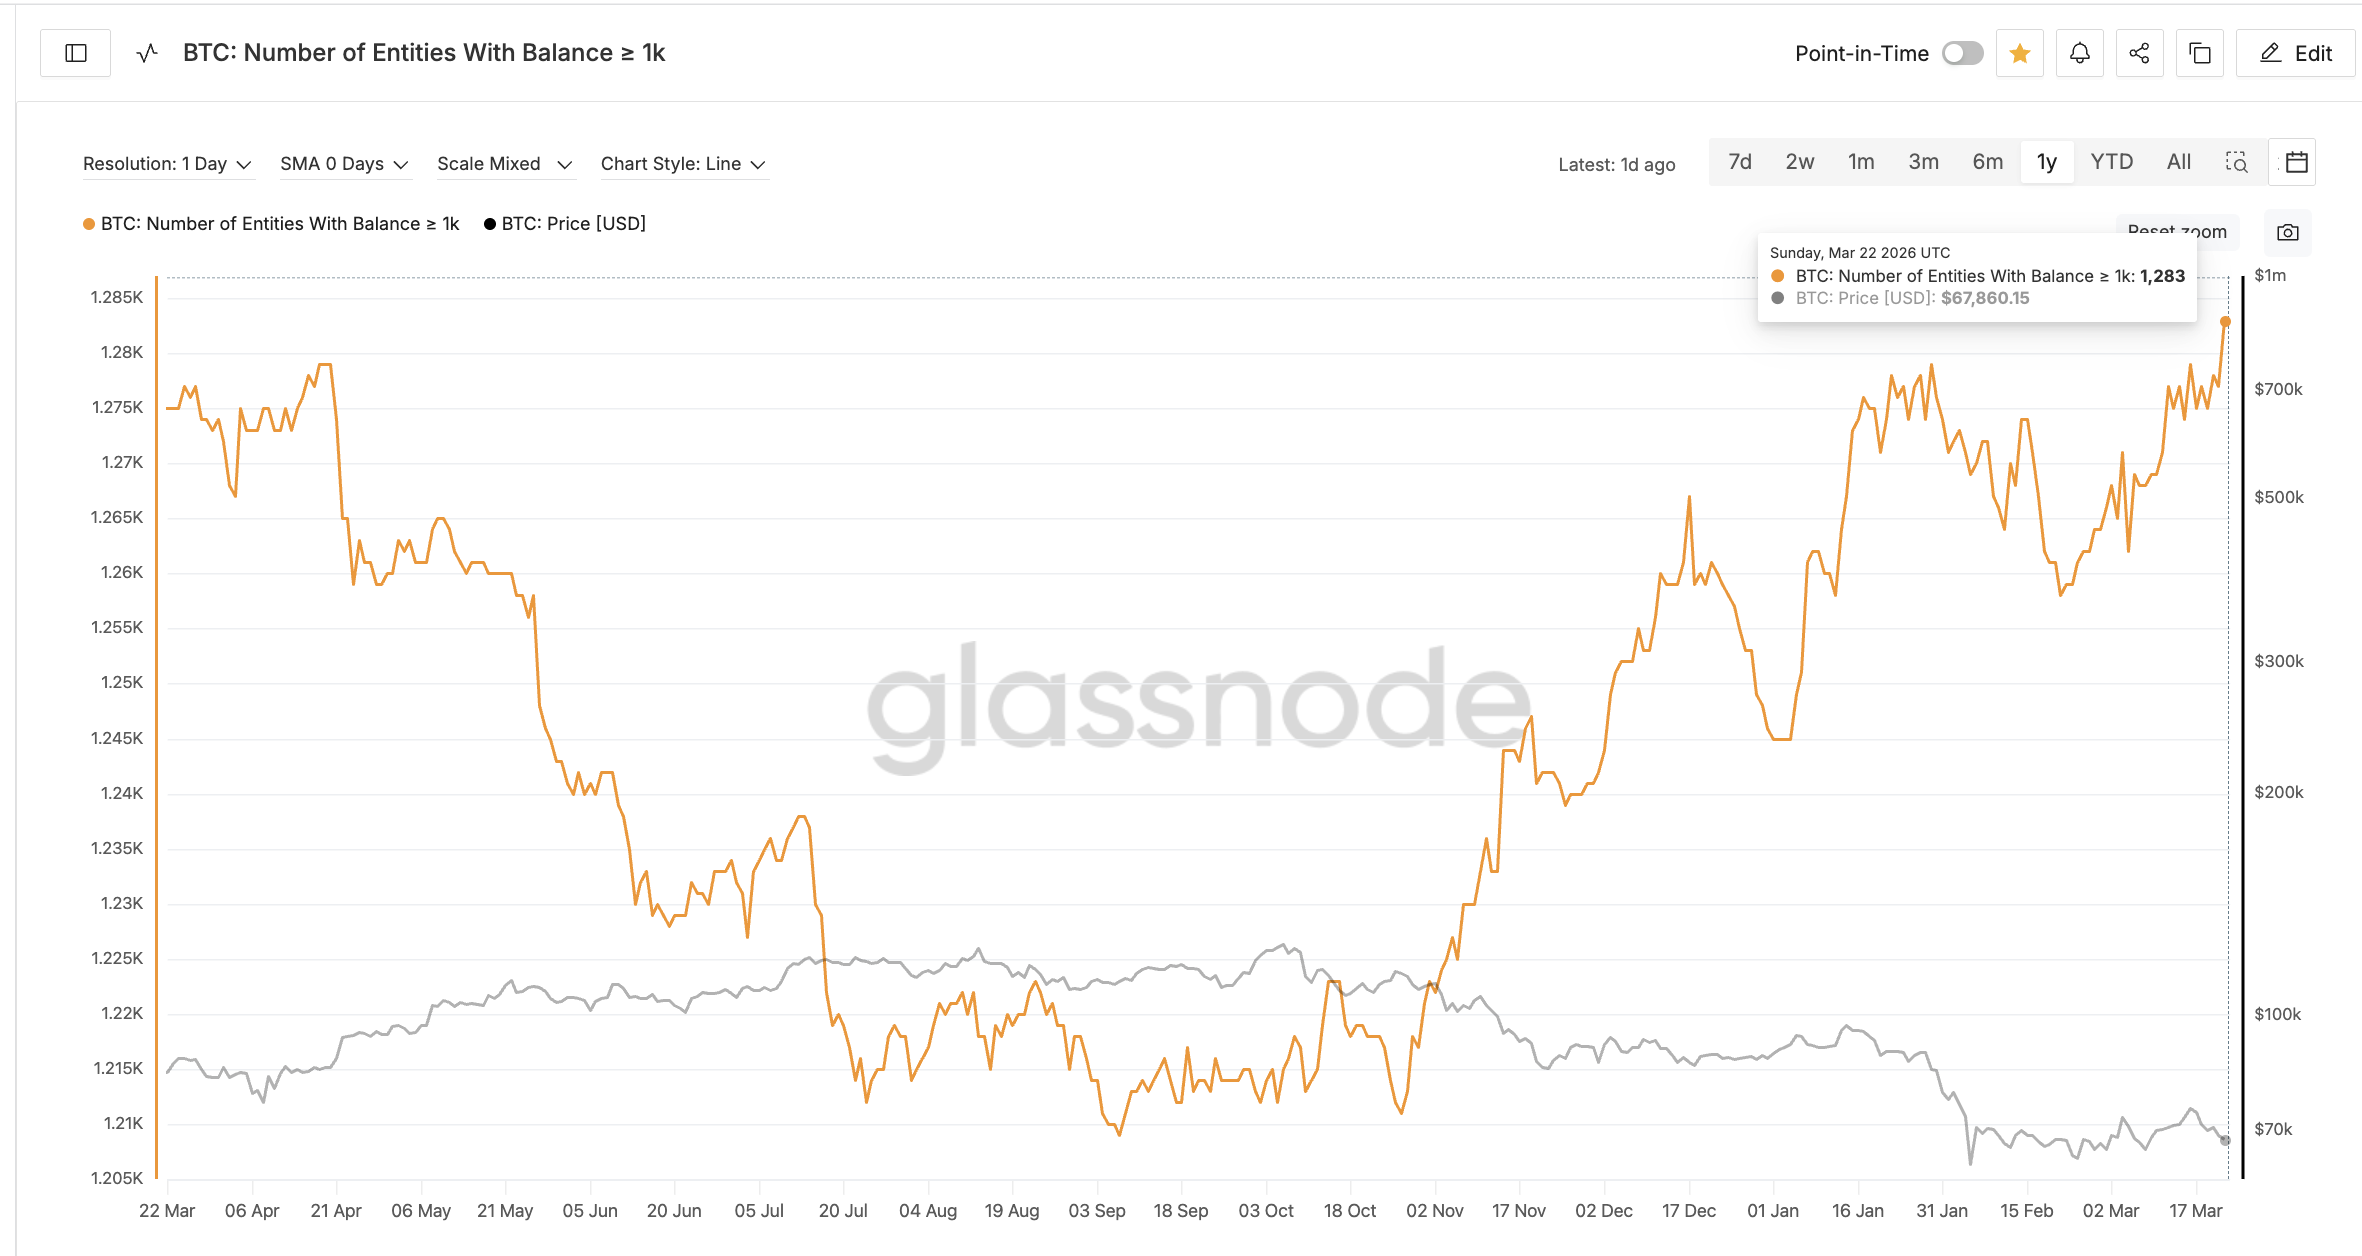
Despite the breakdown, Bitcoin whales are adding to their positions rather than exiting. The number of entities holding at least 1,000 BTC rose to 1,283 as of March 22, according to Glassnode data. That is the highest reading in one year. The climb has been steady since early March, but it accelerated after the neckline break on March 21, when the count jumped from roughly 1,277 to 1,283. At a minimum, that implies roughly 6,000 BTC were added in two days. Small yet notable as it shows whale optimism.
 BTC Whale Count One-Year High: Glassnode
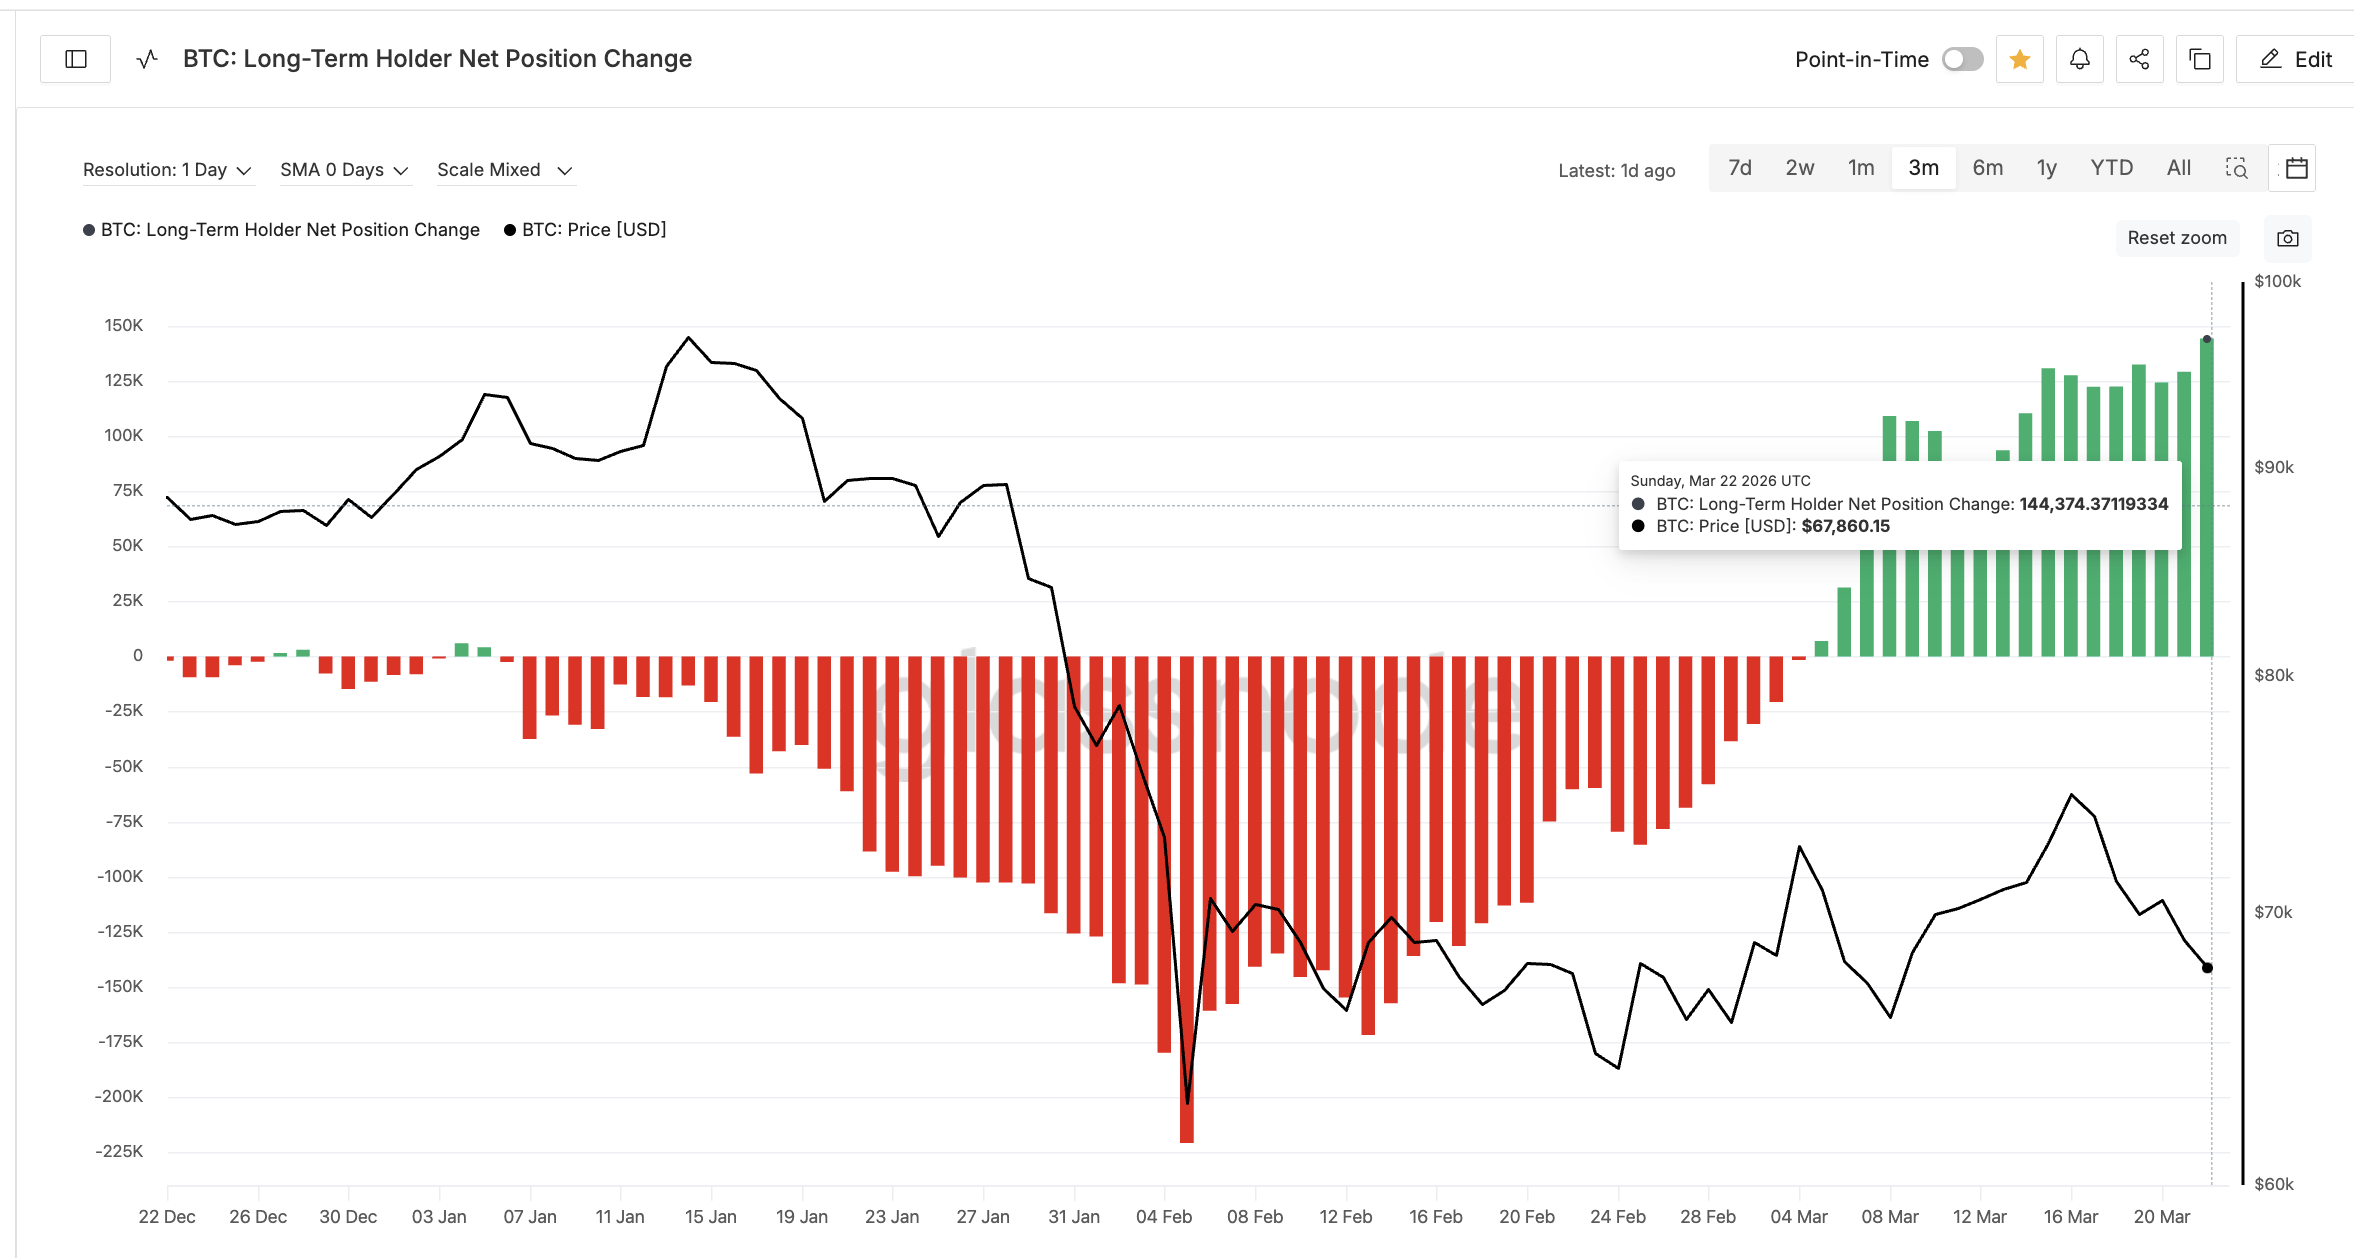
Long-term holders, those who have held for more than 365 days, are following the same playbook. The daily long-term holder net position change flipped positive in early March and reached 144,374 BTC by March 22, up from 129,262 BTC on March 21. That’s a near 12% increase in accumulation.
 BTC Long-Term Holder Net Position Change: Glassnode
The timing is notable. Whales began adding before the RSI divergence appeared on March 22, suggesting they anticipated the bounce rather than reacted to it. The long-term holders, however, waited for the momentum sign to flash.
It seems that they have effectively turned opportunistic, treating the breakdown as a buying window rather than a risk event. However, conviction alone does not guarantee prices move higher. The next section explains why.
Supply Clusters Could Cap the Possible Bitcoin Price Bounce
The UTXO Realized Price Distribution (URPD), a metric that maps where Bitcoin supply last moved on-chain, reveals two dense clusters sitting directly above the current price. At $69,400, roughly 411,953 BTC (2.06% of total supply) last changed hands. Just above that, at $70,600, another 261,694 BTC (1.31%) are concentrated.
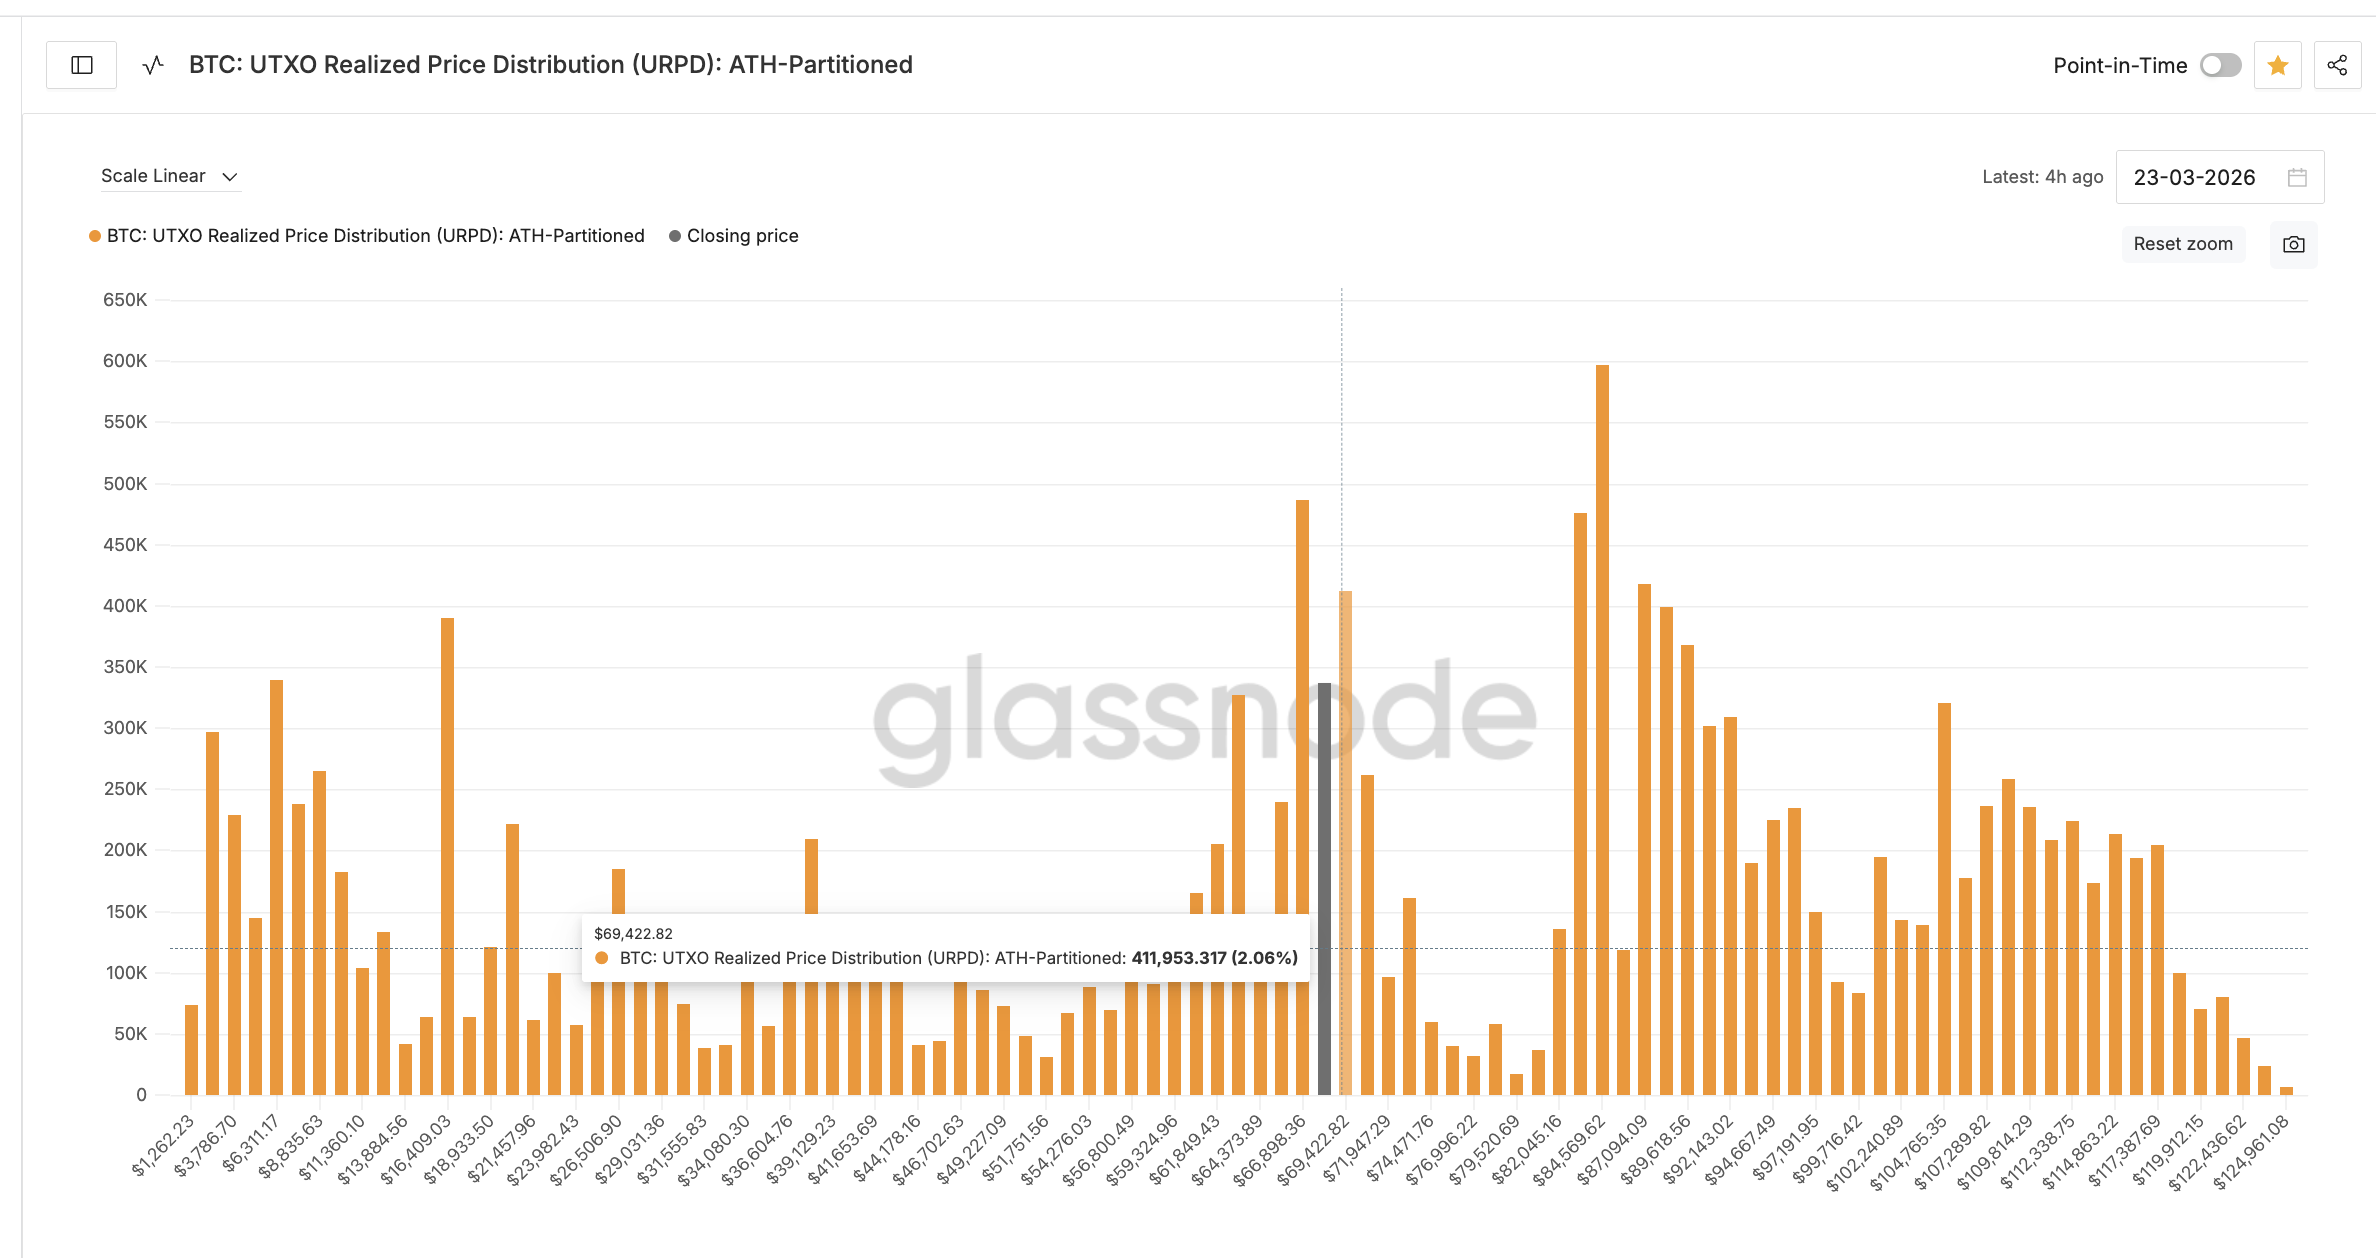 BTC URPD Supply Cluster 1: Glassnode
Together, these two levels hold over 3.3% of all circulating Bitcoin. Holders at these prices are currently underwater and have a strong incentive to sell into any relief rally to break even. Even with whales and long-term holders accumulating, their buying may not be enough to absorb sell pressure from 670,000+ BTC sitting between $69,400 and $70,700.
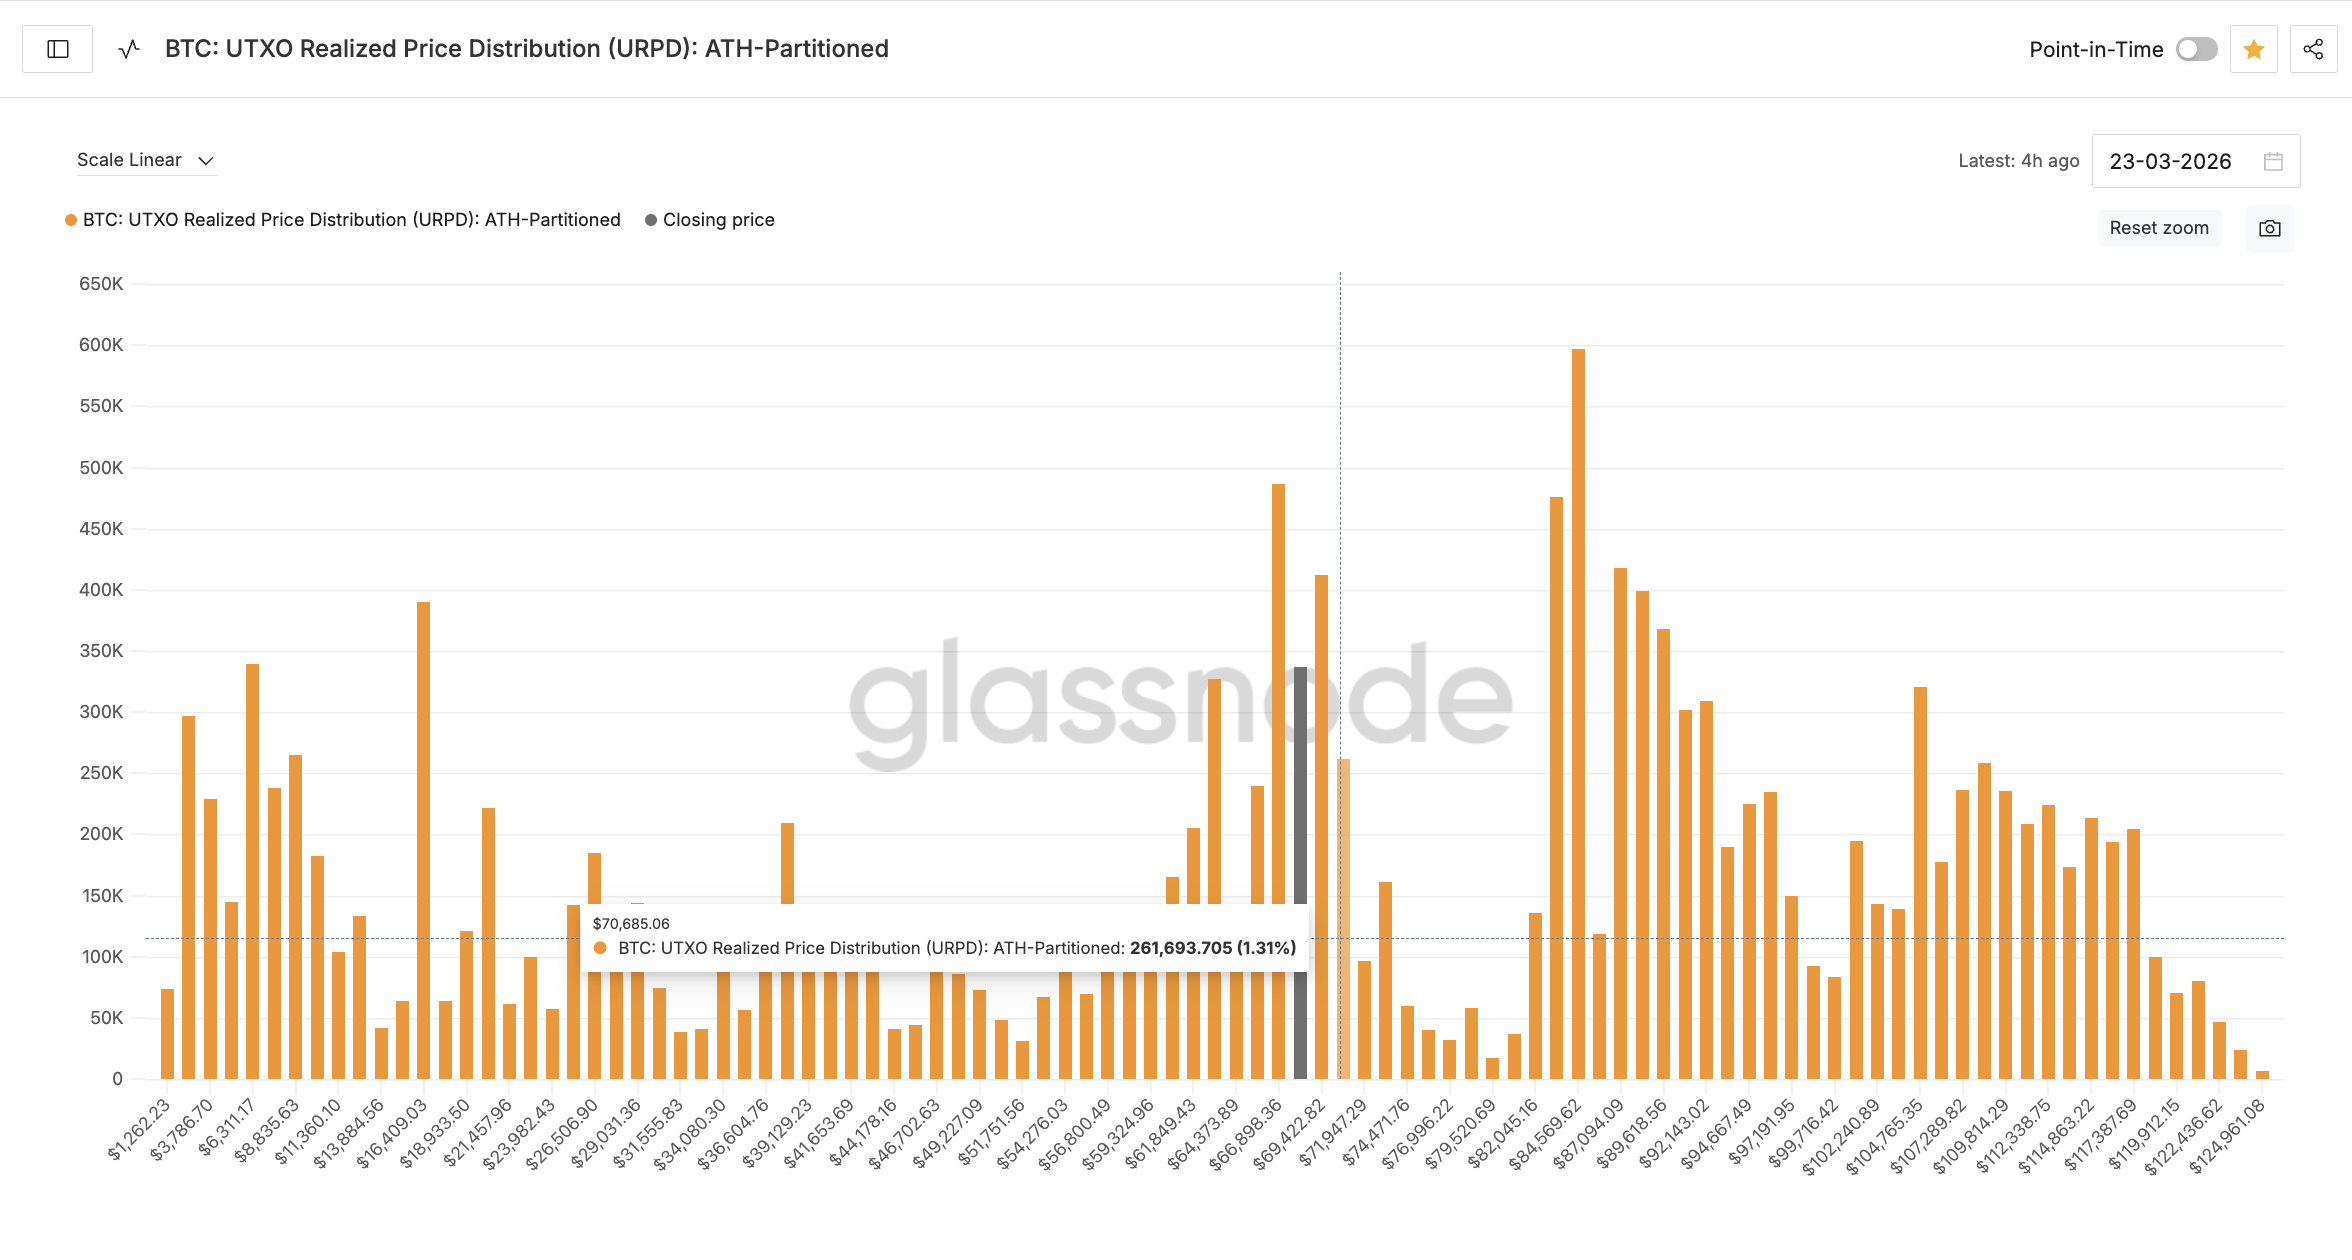 BTC URPD Supply Cluster 2: Glassnode
For the bounce triggered by the RSI divergence to gain traction, Bitcoin needs a 12-hour close above $69,500, which aligns with both the first URPD cluster and the 0.236 Fibonacci level. A push through $70,700 (a technical resistance), near the second supply cluster zone, would confirm that sellers have been absorbed. Post that, $71,200 becomes the key for the BTC price to turn slightly bullish.
Only a move above $75,900 would fully neutralize the head-and-shoulders’ bearishness.
On the downside, a loss of $67,600 opens a path toward $64,000, which then leads to the $62,000 zone mentioned earlier. The $59,600 zone at the 1.618 extension sits as a worst-case scenario if selling accelerates.
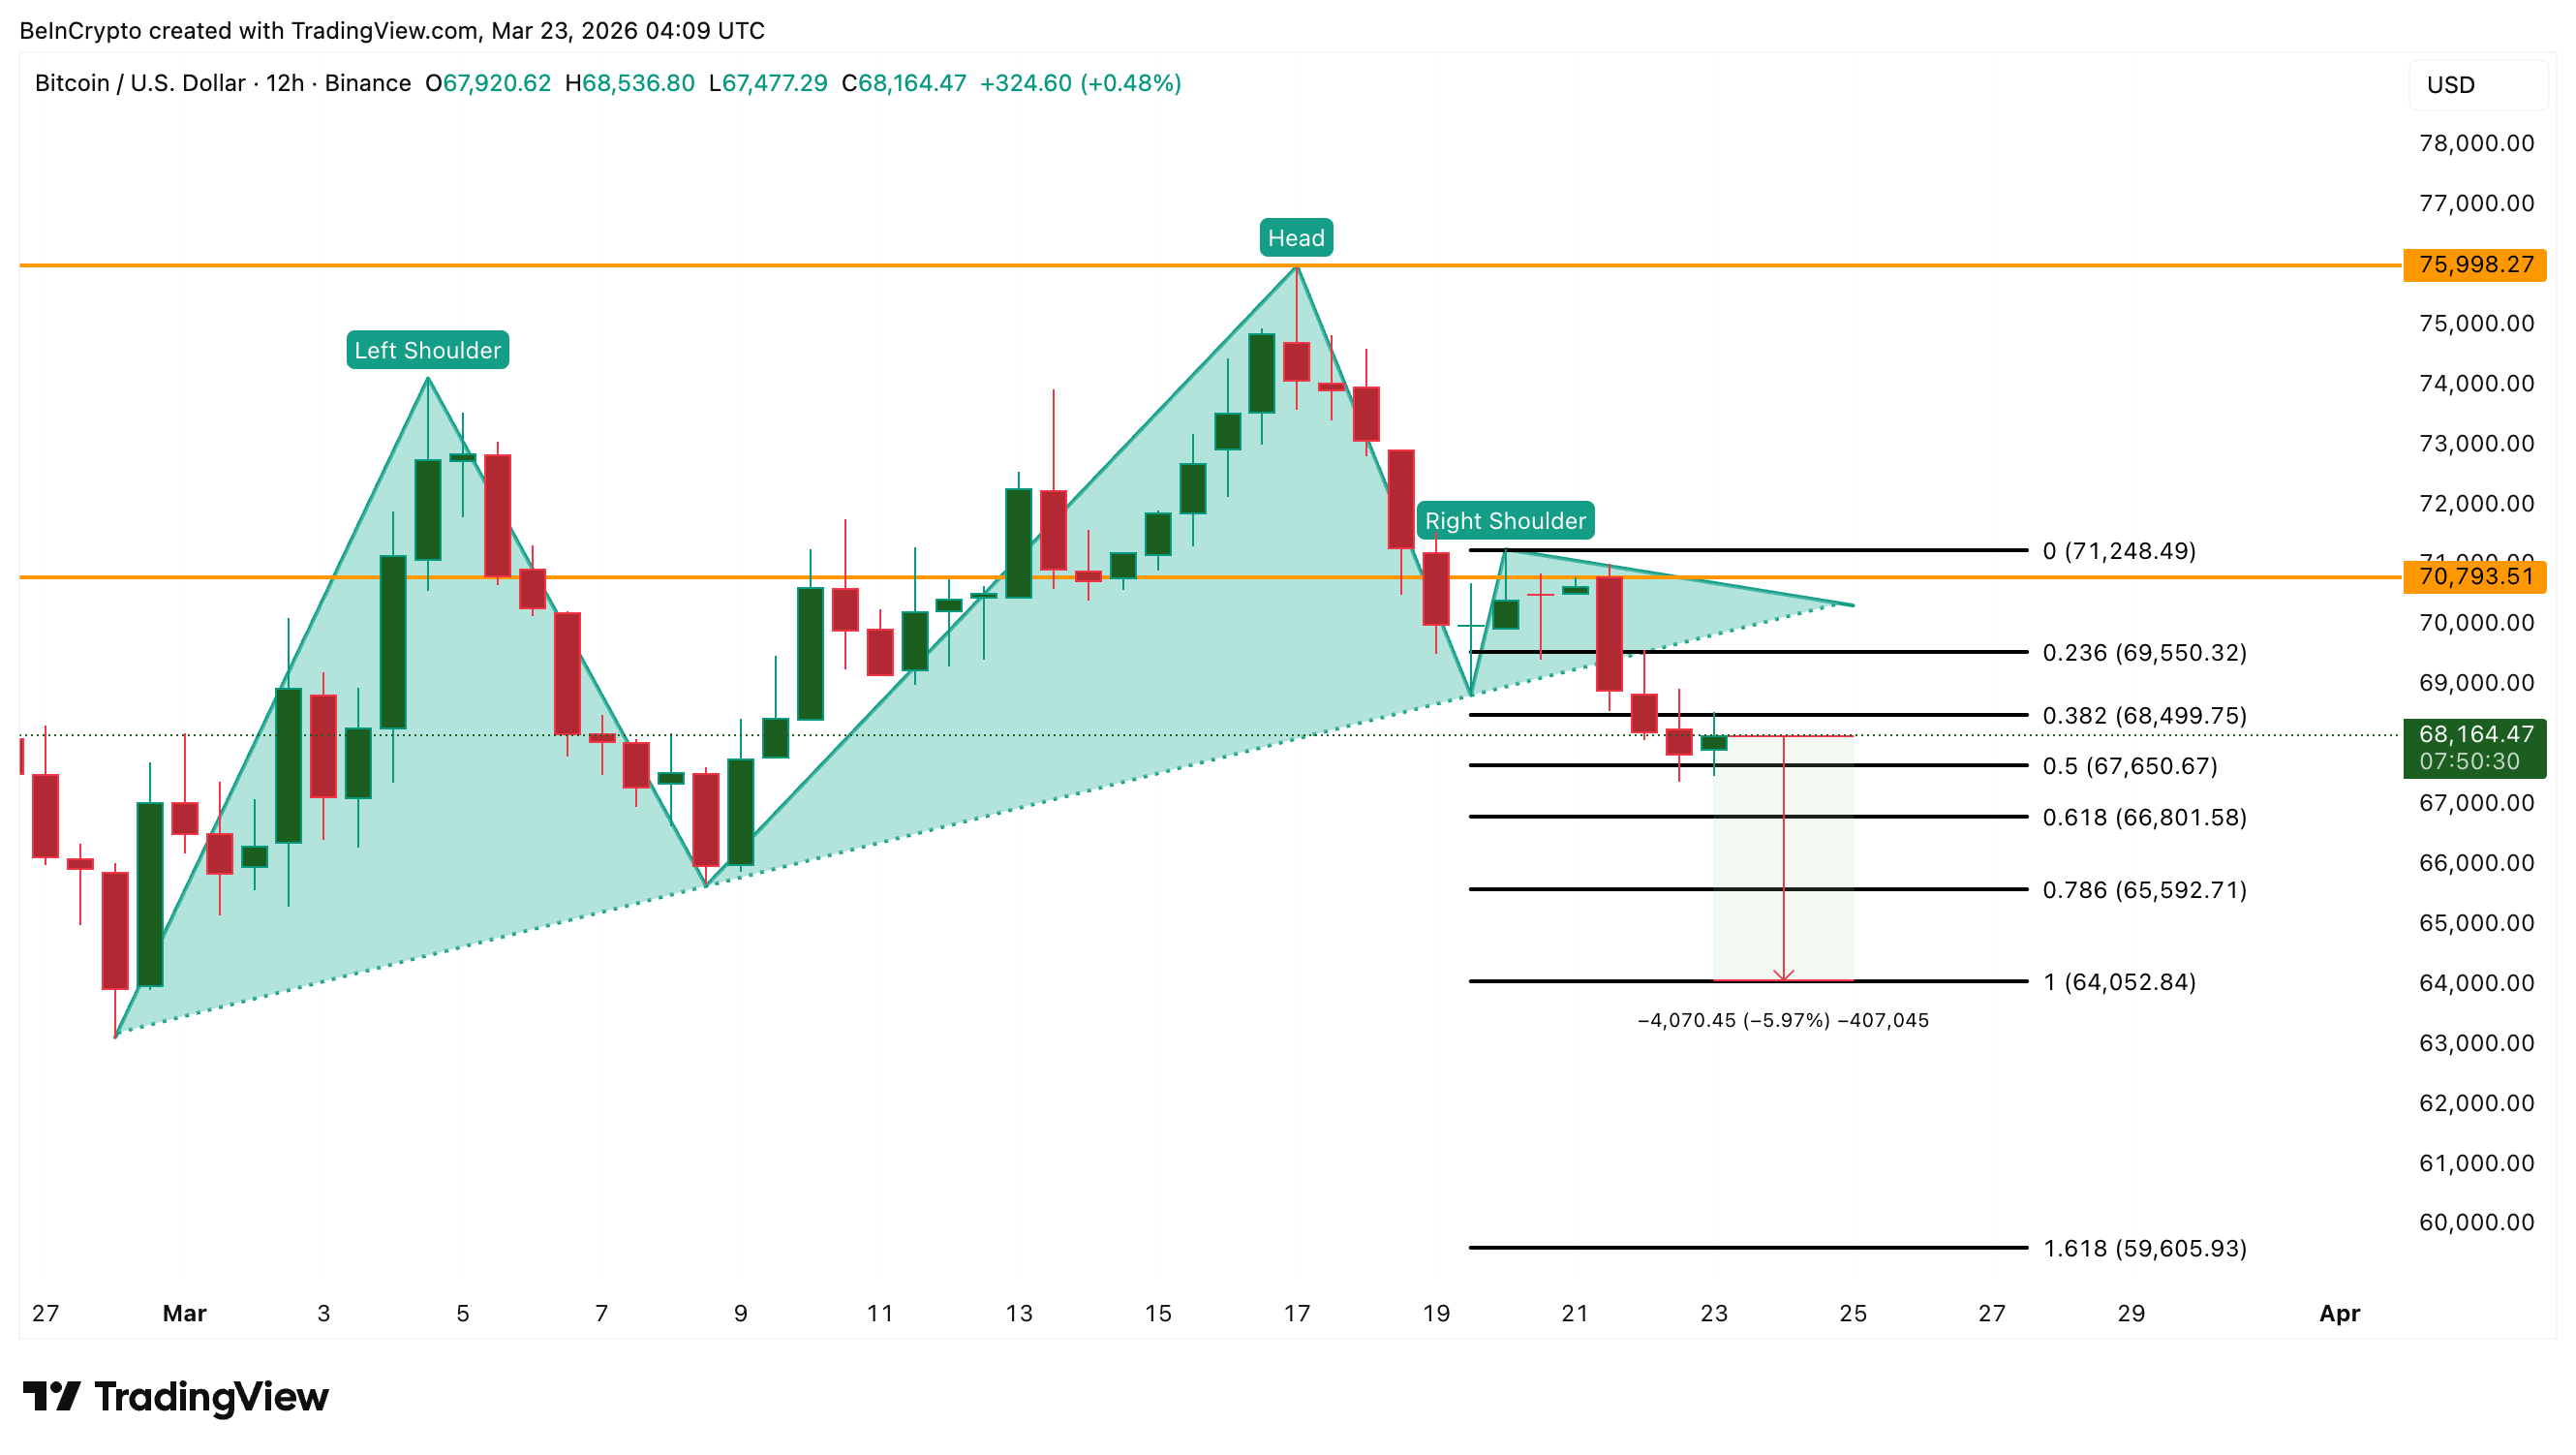 BTC Price Analysis: TradingView
At present, $69,500 separates a whale-fueled relief rally from a steady grind toward the head-and-shoulders target.
The post Bitcoin’s $62,000 Risk Haunts Bulls, but Whales Hit a One-Year High appeared first on BeInCrypto.


 English (US) ·