
 1 month ago
30
1 month ago
30

According to July 13, 2026 market data, Bitcoin at $62,958: Bearish Structure Holds as Inflation Fears Return, with the daily chart confirming a negative regime below key moving averages. Bloomberg reports that an oil price spike has revived inflation concerns, sending BTC lower as risk appetite contracts.
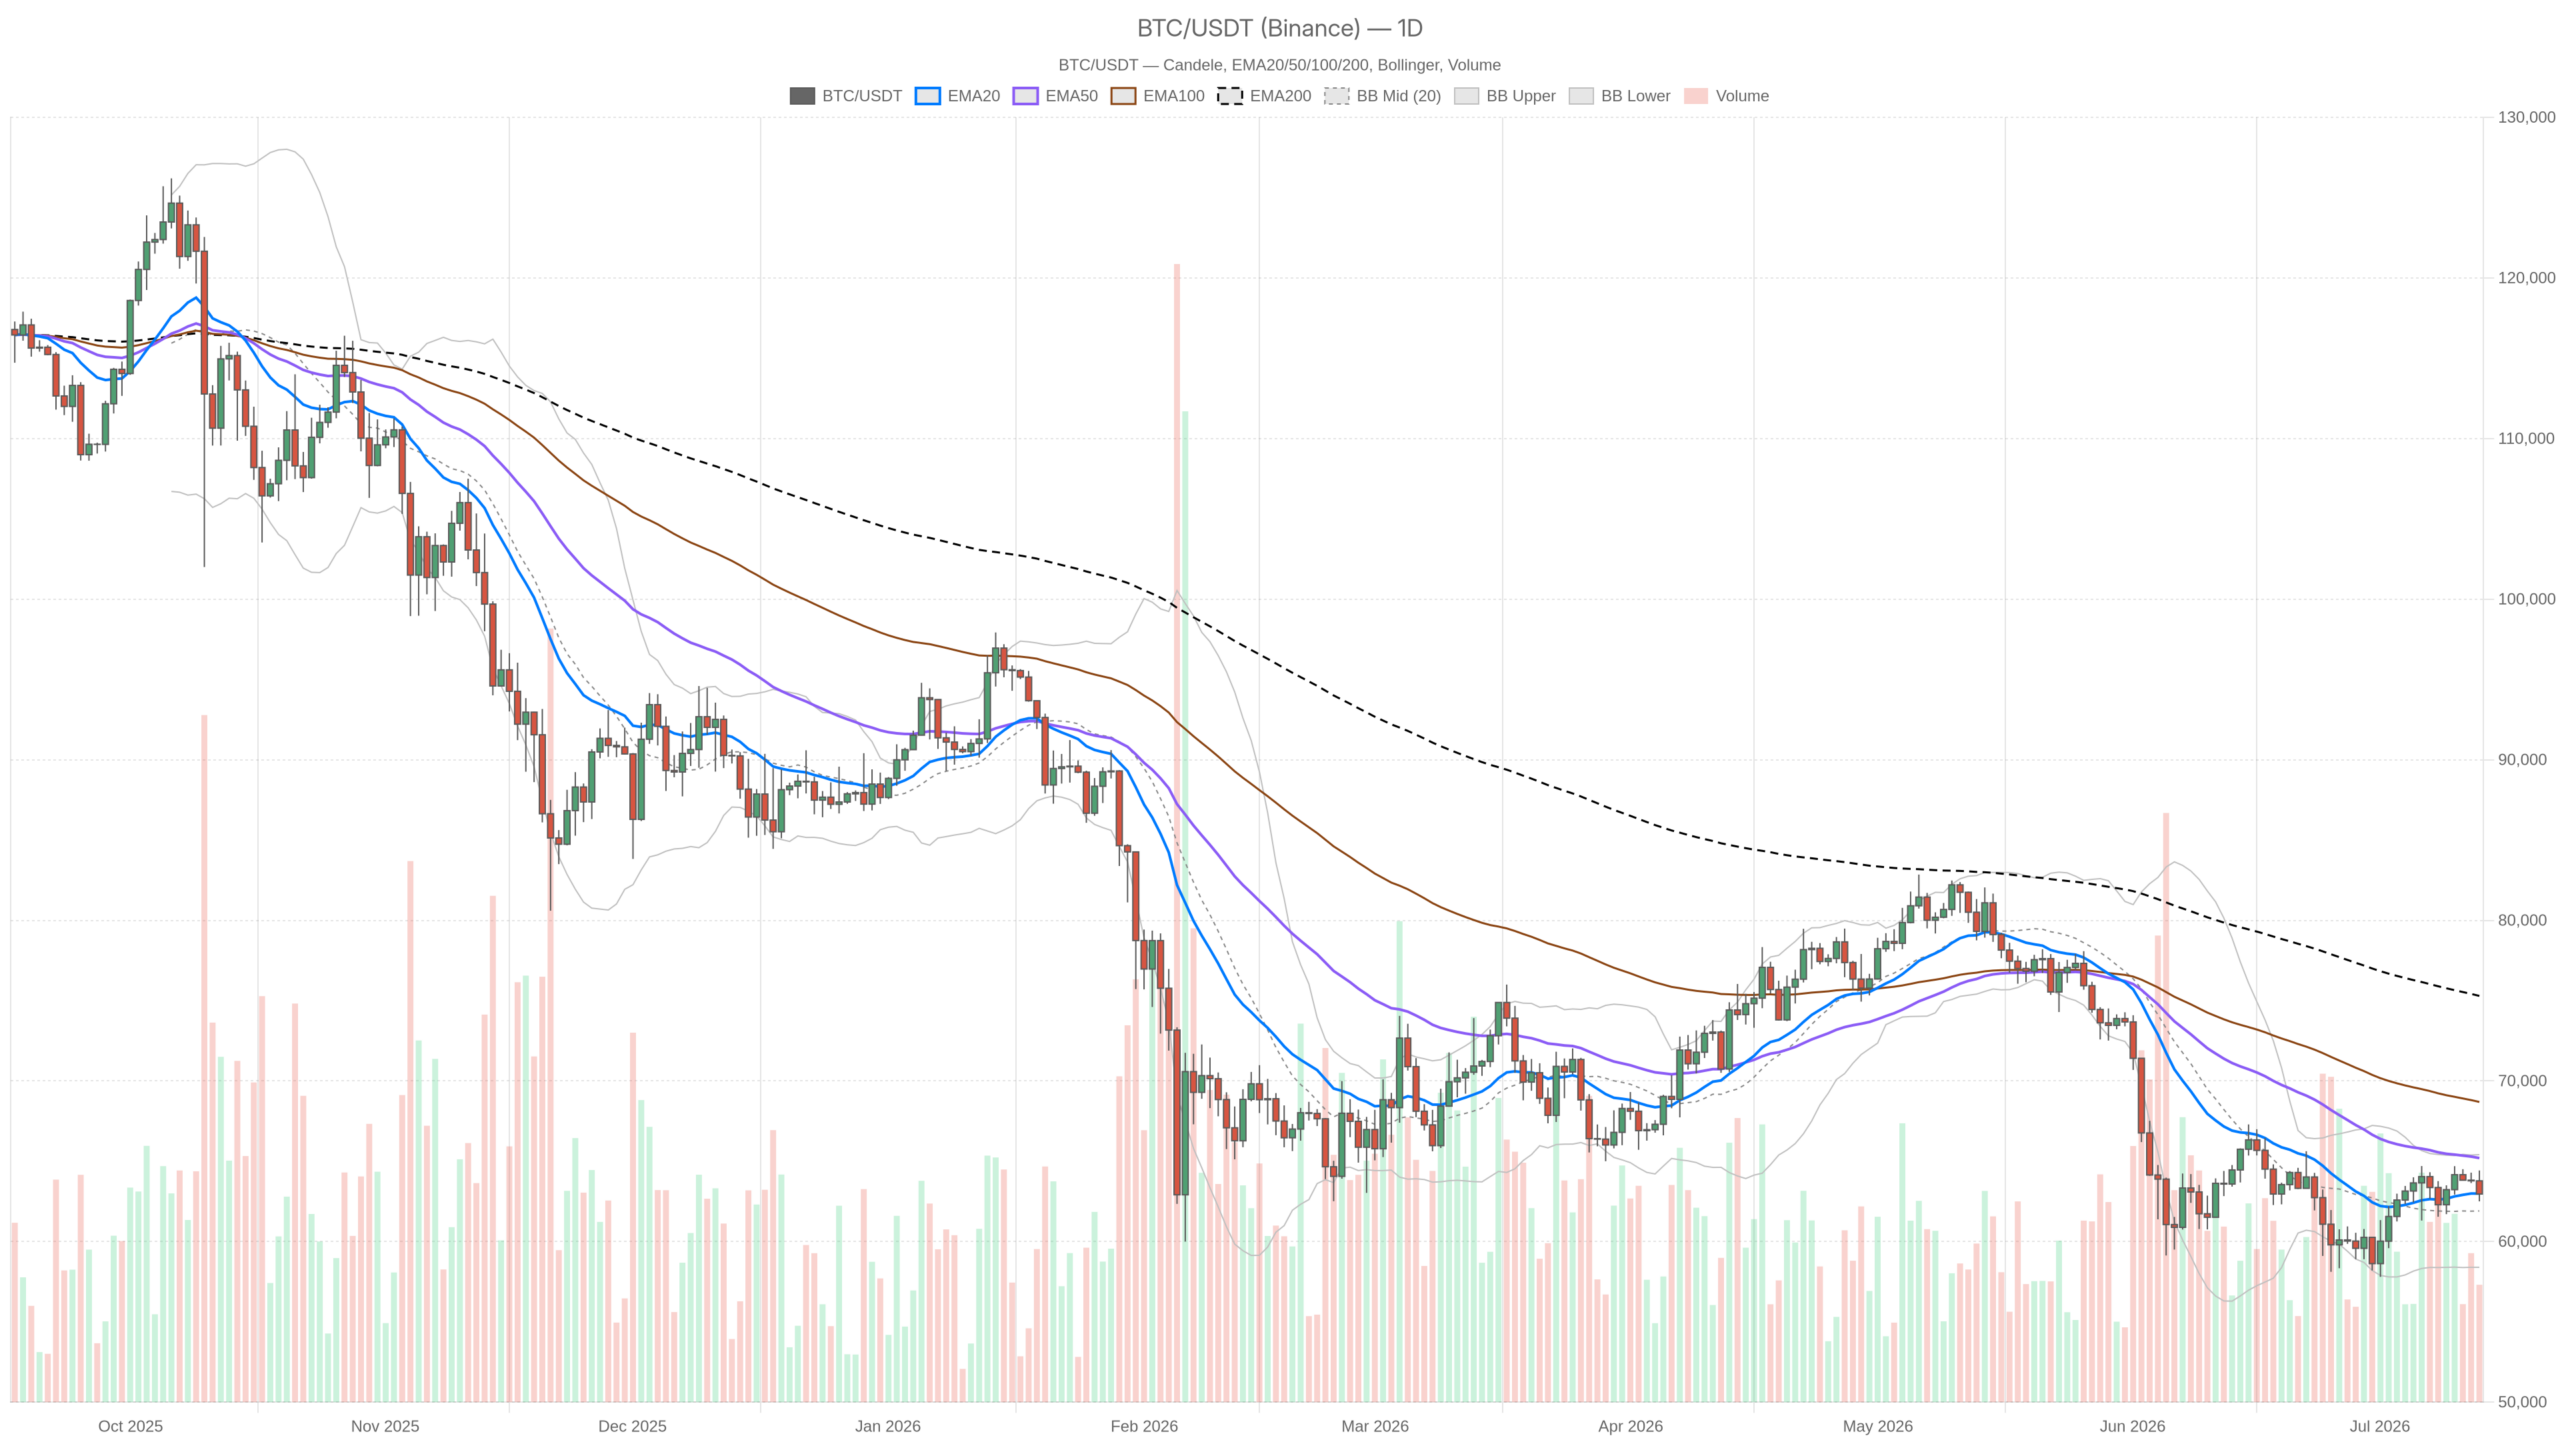 BTC/USDT — daily chart with candlesticks, EMA20/EMA50 and volume.
Key takeaways
- Bitcoin trades at $62,958, below its 20-day EMA of $62,987 and well under the 50-day and 200-day moving averages
- The Fear & Greed Index sits at 28, with total crypto market cap down 1.35% to $2.25 trillion, per CoinGecko
- Daily RSI at 48.29 signals drift without conviction, though the MACD histogram shows a positive divergence at +440.26
- BTC must reclaim the daily pivot at $63,294 and the 1H EMA50 at $63,644 for any credible bullish scenario
- The path of least resistance remains lower as oil-driven inflation fears weigh on risk assets
Daily Timeframe: Bearish Structure Intact
The daily chart delivers a clear message: Bitcoin remains in a confirmed bearish regime. Price closed at $62,958 while the EMA20 stands at $62,987 — price is essentially kissing that level from below, making it resistance rather than support. The EMA50 at $65,197 and EMA200 at $75,293 are both well overhead, forming a stacked bearish alignment that describes months of structural damage.
Meanwhile, the daily RSI at 48.29 sits just below the neutral midpoint — not oversold, not recovering. It is the RSI of an asset that is drifting without conviction, which prolongs uncertainty. The MACD tells a more nuanced story: the line sits at -220.62 and the signal at -660.88, but the histogram has printed +440.26 — a positive divergence from deep negative territory. This is the one constructive signal on the daily chart, suggesting the rate of bearish momentum is decelerating.
Moreover, Bollinger Bands place the midline at $61,903, upper band at $65,410, and lower band at $58,396. Current price sits between the midline and the upper band — neither stretched to the upside nor collapsing toward the lower boundary. The daily ATR of $1,908 defines the volatility envelope: meaningful swings are entirely possible within a single session. Daily pivot sits at $63,294, with R1 at $64,088 and S1 at $62,164. Price is currently trading below the pivot — a subtle but persistent indication of intraday bearish bias.
Hourly and 15-Minute Charts: Compression Without Resolution
The 1-hour chart shifts to neutral — but that label politely describes a downtrend in the early stages of exhaustion. The 1H close is also $62,950, with the EMA20 at $63,334, EMA50 at $63,644, and EMA200 at $63,149. Every single moving average sits above price. The 1H RSI at 37.6 is approaching oversold territory without quite getting there, which tends to happen during grinding bear trends where brief bounces prevent a washout.
However, the 1H MACD histogram at -36.36 is worsening — the bearish cross is fresh and the signal line has not turned. The hourly pivot at $62,984 with S1 at $62,833 defines the near-term support band to watch.
Meanwhile, the 15-minute chart is where things get interesting for short-term traders. The regime here is tagged as bearish, but the MACD histogram has ticked positive at +2.41 — a minor but real shift. Price at $62,950 sits right at the 15M pivot of $62,954, with an extremely compressed range between $62,945 and $62,959. The 15M ATR of $104 reflects tight intraday ranges, which signals compression against a daily ATR north of $1,900. Compression inside a larger bearish structure often resolves in the direction of the dominant trend.
The Bull Case: What Must Go Right
For a credible bullish scenario to develop, Bitcoin needs to reclaim the daily pivot at $63,294 and then push through the 1H EMA200 at $63,149 and EMA50 at $63,644 in sequence. A daily close above $63,500 would shift the short-term tone and put the Bollinger upper band at $65,410 — and critically the EMA50 at $65,197 — in play as the next meaningful target.
The daily MACD histogram turning more positive would confirm that the bearish impulse is genuinely exhausted rather than just pausing. However, the bullish case gets invalidated quickly if price fails to hold above $62,164 on any attempted recovery. A break below that level reopens the path toward the lower Bollinger Band near $58,396.
The Bear Case: Why the Structure Remains Broken
Conversely, the bearish scenario remains dominant and requires far less to go wrong. Bitcoin trades below the EMA20 at $62,987, and as long as it stays there on a daily closing basis, the structure remains firmly negative. The technical picture confirms that Bitcoin at $62,958: Bearish Structure Holds as Inflation Fears Return, with the EMA50 at $65,197 and EMA200 at $75,293 forming a stacked bearish alignment overhead.
A rejection from the current level — essentially a failed test of the daily pivot zone — that accelerates below $62,164 would constitute a structural continuation. The 1H MACD crossover deepening and the RSI failing to recover above 45 on the hourly would confirm that sellers are reloading at resistance rather than retreating.
Given the macro catalyst — oil-driven inflation fears weighing on risk assets — and a Fear & Greed reading of 28, the path of least resistance remains lower. The bear case gets complicated only if the daily MACD histogram keeps expanding to the upside, but a histogram alone without a price reclaim of key EMAs is not enough to flip the thesis.
Positioning Context and On-Chain Signals
What makes this moment genuinely difficult is the conflict between timeframes. The daily is bearish in regime and structure. The hourly is deteriorating but not yet in freefall. The 15-minute is compressing, which creates the illusion of opportunity. Traders who mistake short-term compression for a bottom in a bearish macro environment tend to get punished when the structure reasserts itself.
The daily ATR of $1,908 is a reminder that volatility here is not academic — a single candle can cover a significant portion of any short-term setup. DeFi data adds a secondary note worth watching: Uniswap V3 fees are up 61.45% in a day and 138.14% over seven days per DefiLlama, suggesting on-chain activity is picking up even as spot markets soften. That divergence between on-chain engagement and spot price weakness is not a clear signal, but it is worth tracking — sometimes DEX activity precedes a broader recovery in sentiment.
Ultimately, the honest assessment is that Bitcoin is in a corrective phase within a damaged technical structure, facing a real macro headwind from inflation repricing. The daily MACD histogram provides a sliver of optimism, but one constructive histogram bar does not make a trend. Anyone positioning in this environment should do so with precise levels, realistic targets, and a clear understanding that the dominant bias remains bearish until the market proves otherwise.
FAQ
Is Bitcoin in a bearish trend right now?
Yes. As of July 13, 2026, Bitcoin trades at $62,958, below its 20-day EMA ($62,987), 50-day EMA ($65,197), and 200-day EMA ($75,293). The daily RSI at 48.29 and the stacked bearish moving average alignment confirm a negative regime with no immediate reversal signal.
What would need to happen for Bitcoin to turn bullish?
Bitcoin must reclaim the daily pivot at $63,294 and then push through the 1H EMA200 at $63,149 and EMA50 at $63,644 in sequence. A daily close above $63,500 would shift the short-term tone and put the EMA50 at $65,197 in play as the next meaningful upside target.
What is driving Bitcoin down currently?
Bloomberg reports that a spike in oil prices has revived inflation fears, sending Bitcoin lower as risk appetite contracts. The Fear & Greed Index at 28 reflects this risk-off sentiment, with total crypto market cap down 1.35% to $2.25 trillion according to CoinGecko data.
Is there any positive signal on the charts right now?
The daily MACD histogram has printed +440.26, representing a positive divergence from deep negative territory. This suggests bearish momentum is decelerating, but one constructive histogram bar does not constitute a trend reversal without price confirmation above key moving averages.
Disclaimer: This article is for informational purposes only and does not constitute financial advice, an investment recommendation, or a solicitation to buy or sell any financial instrument or cryptocurrency. The analysis provided is not indicative of future results. Investing in crypto assets and financial markets carries a high risk of capital loss. Always do your own research (DYOR) and consult a qualified financial advisor before making any decision.
Article produced with the assistance of artificial intelligence and reviewed by the editorial team.







 English (US) ·