
 1 month ago
10
1 month ago
10
In the past three days, there has been a notable increase in both Unique Daily Trades and Unique Daily Traders, potentially signaling the onset of a new bullish trend for BONK. Currently, the BONK price is underpinned by a Relative Strength Index (RSI) of 57. This level suggests the asset is neither overbought nor undervalued, pointing towards a stable and healthy valuation.
Additionally, bullish sentiment is further supported as BONK’s short-term Exponential Moving Averages (EMA) begin to cross above the longer-term lines, indicating a favorable moment for investors and hinting at the potential for continued upward momentum.
BONK Activity Is Growing Again
On March 4, BONK hit a record peak, with daily trades reaching 187,000. But this peak was fleeting. Soon after, it plunged to a 30-day low of 22,200 trades by March 23. The 7-day moving average for BONK trades is still falling. However, the last three days have shown promising signs. Trading activity has started to recover, rising from 22,200 on March 23 to 34,800 by March 25.
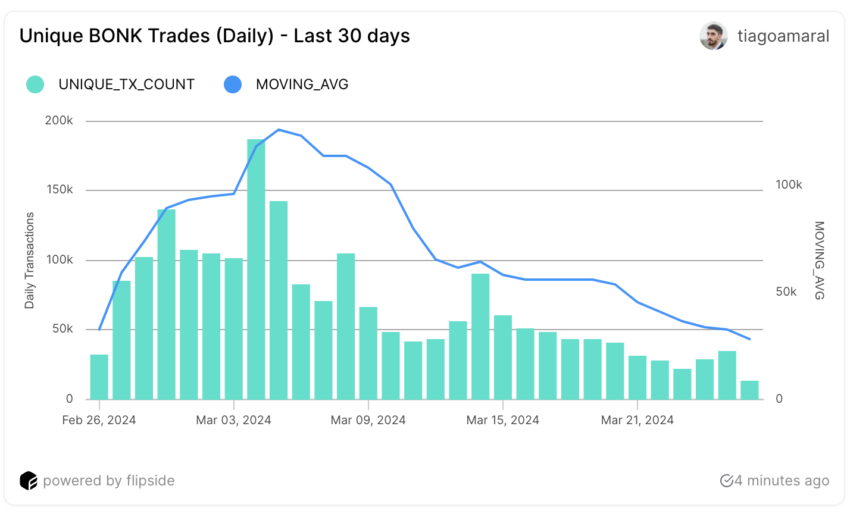 Daily Unique BONK Trades. Source: Flipside.
 Similarly, the pattern of daily trader engagement mirrors this fluctuation. Having reached a zenith of 23,200 unique traders on the same day as the peak in trade volume, a subsequent decline led to a period of stabilization midway through March.
Read More: What Are Meme Coins?
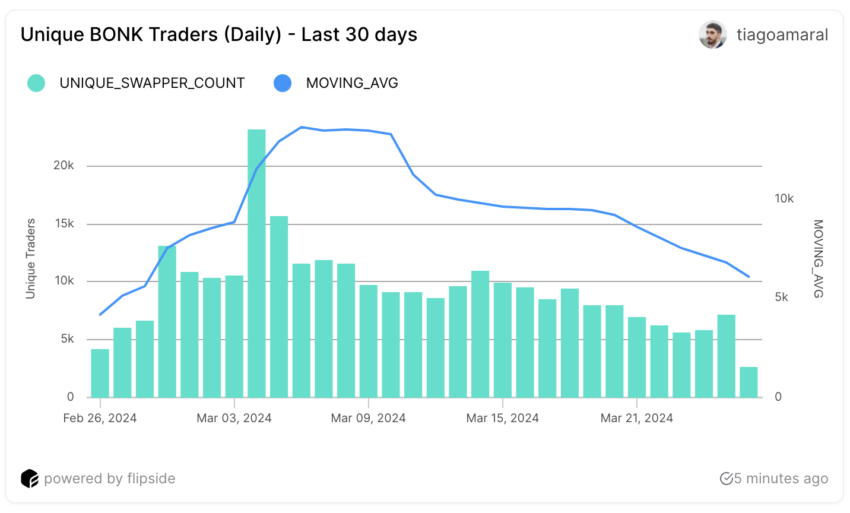 Daily Unique BONK Traders. Source: Flipside.
 This stability was the calm before a gradual uptick in trader activity witnessed in recent days. It grew from 5,660 traders on March 23 to 7,170 by March 25.
While the 7-day moving average for the count of daily traders is still on a decline, the resurgence in both trades and trader numbers in the last few days hints at a revitalizing interest in BONK.
RSI Is Currently At 57
The Relative Strength Index (RSI) of BONK ascended from 35 to 57 within six days. This momentum oscillator, designed to measure the magnitude of recent price changes to evaluate overbought or oversold conditions, operates on a scale ranging from 0 to 100.
When the RSI reaches a level around 35, it often suggests that the asset might be undervalued or oversold. The observed increase to an RSI of 57 shows a significant recovery and upward price momentum for BONK. This also places it in a ‘goldilocks zone’.
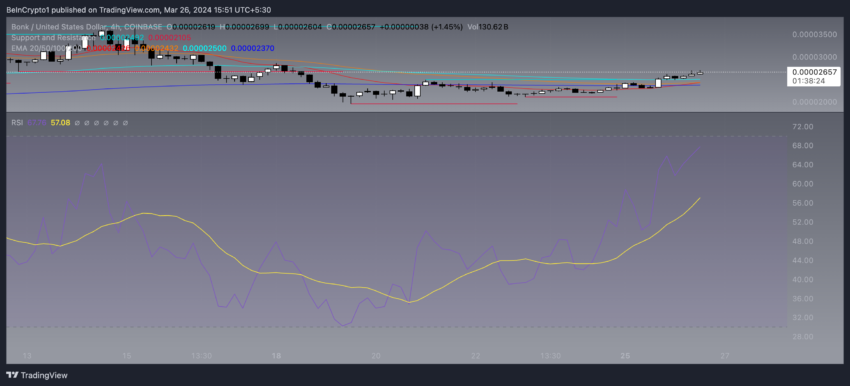 BONK RSI Indicator. Source: TradingView.
 This zone hints at a stable market where the asset, once perhaps undervalued, isn’t overbought or at a reversal risk from a high valuation. It’s ideally placed to show potential for growth, letting investors expect more gains without fear of an overvalued market leading to quick corrections.
Hence, BONK’s RSI rising from 35 to 57 quickly shows growing investor trust, possibly setting the stage for ongoing positive momentum.
BONK Price Prediction: A New Bull Run?
Recently, one of BONK’s short-term Exponential Moving Average (EMA) lines crossed above a long-term EMA line, signaling a bullish trend known as a golden cross. This technical indicator is particularly significant as it often forecasts long-term upward momentum in price.
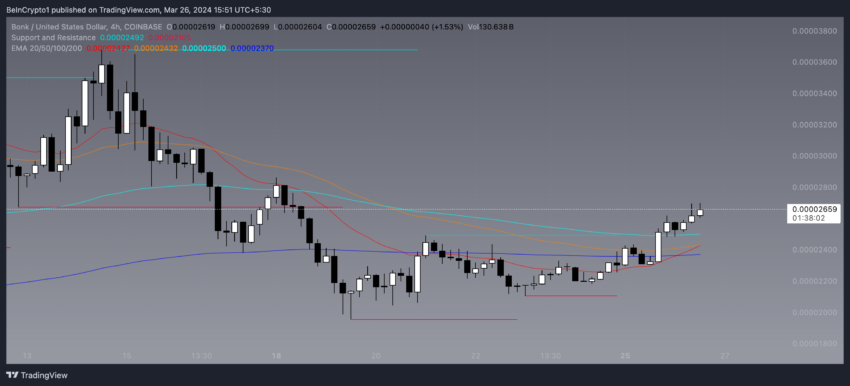 BONK EMA Lines and 4-Hour Price Chart. Source: TradingView.
 EMA lines, by emphasizing the most recent price data more heavily than older data, offer insights into emerging market trends by reacting more quickly to price changes. The golden cross observed in BONK’s performance suggests a growing optimism among investors and hints at the potential for a significant price rally.
Read More: 13 Best Solana Meme Coins to Watch in 2024
Currently, BONK is facing a critical resistance level at $0.000036. Surpassing this threshold could see its price escalate to a new high of $0.000047, a potential 80% price growth. However, if BONK fails to sustain its support, the price could fall to $0.000019.
The post BONK Eyes 80% Price Increase According to These Metrics appeared first on BeInCrypto.


 English (US) ·