Bitcoin’s price has yet to recover above the key 200-day moving average, and if things remain the same, it is seemingly bound to drop to lower levels.
Technical Analysis
By Edris Derakhshi (TradingRage)
The Daily Chart
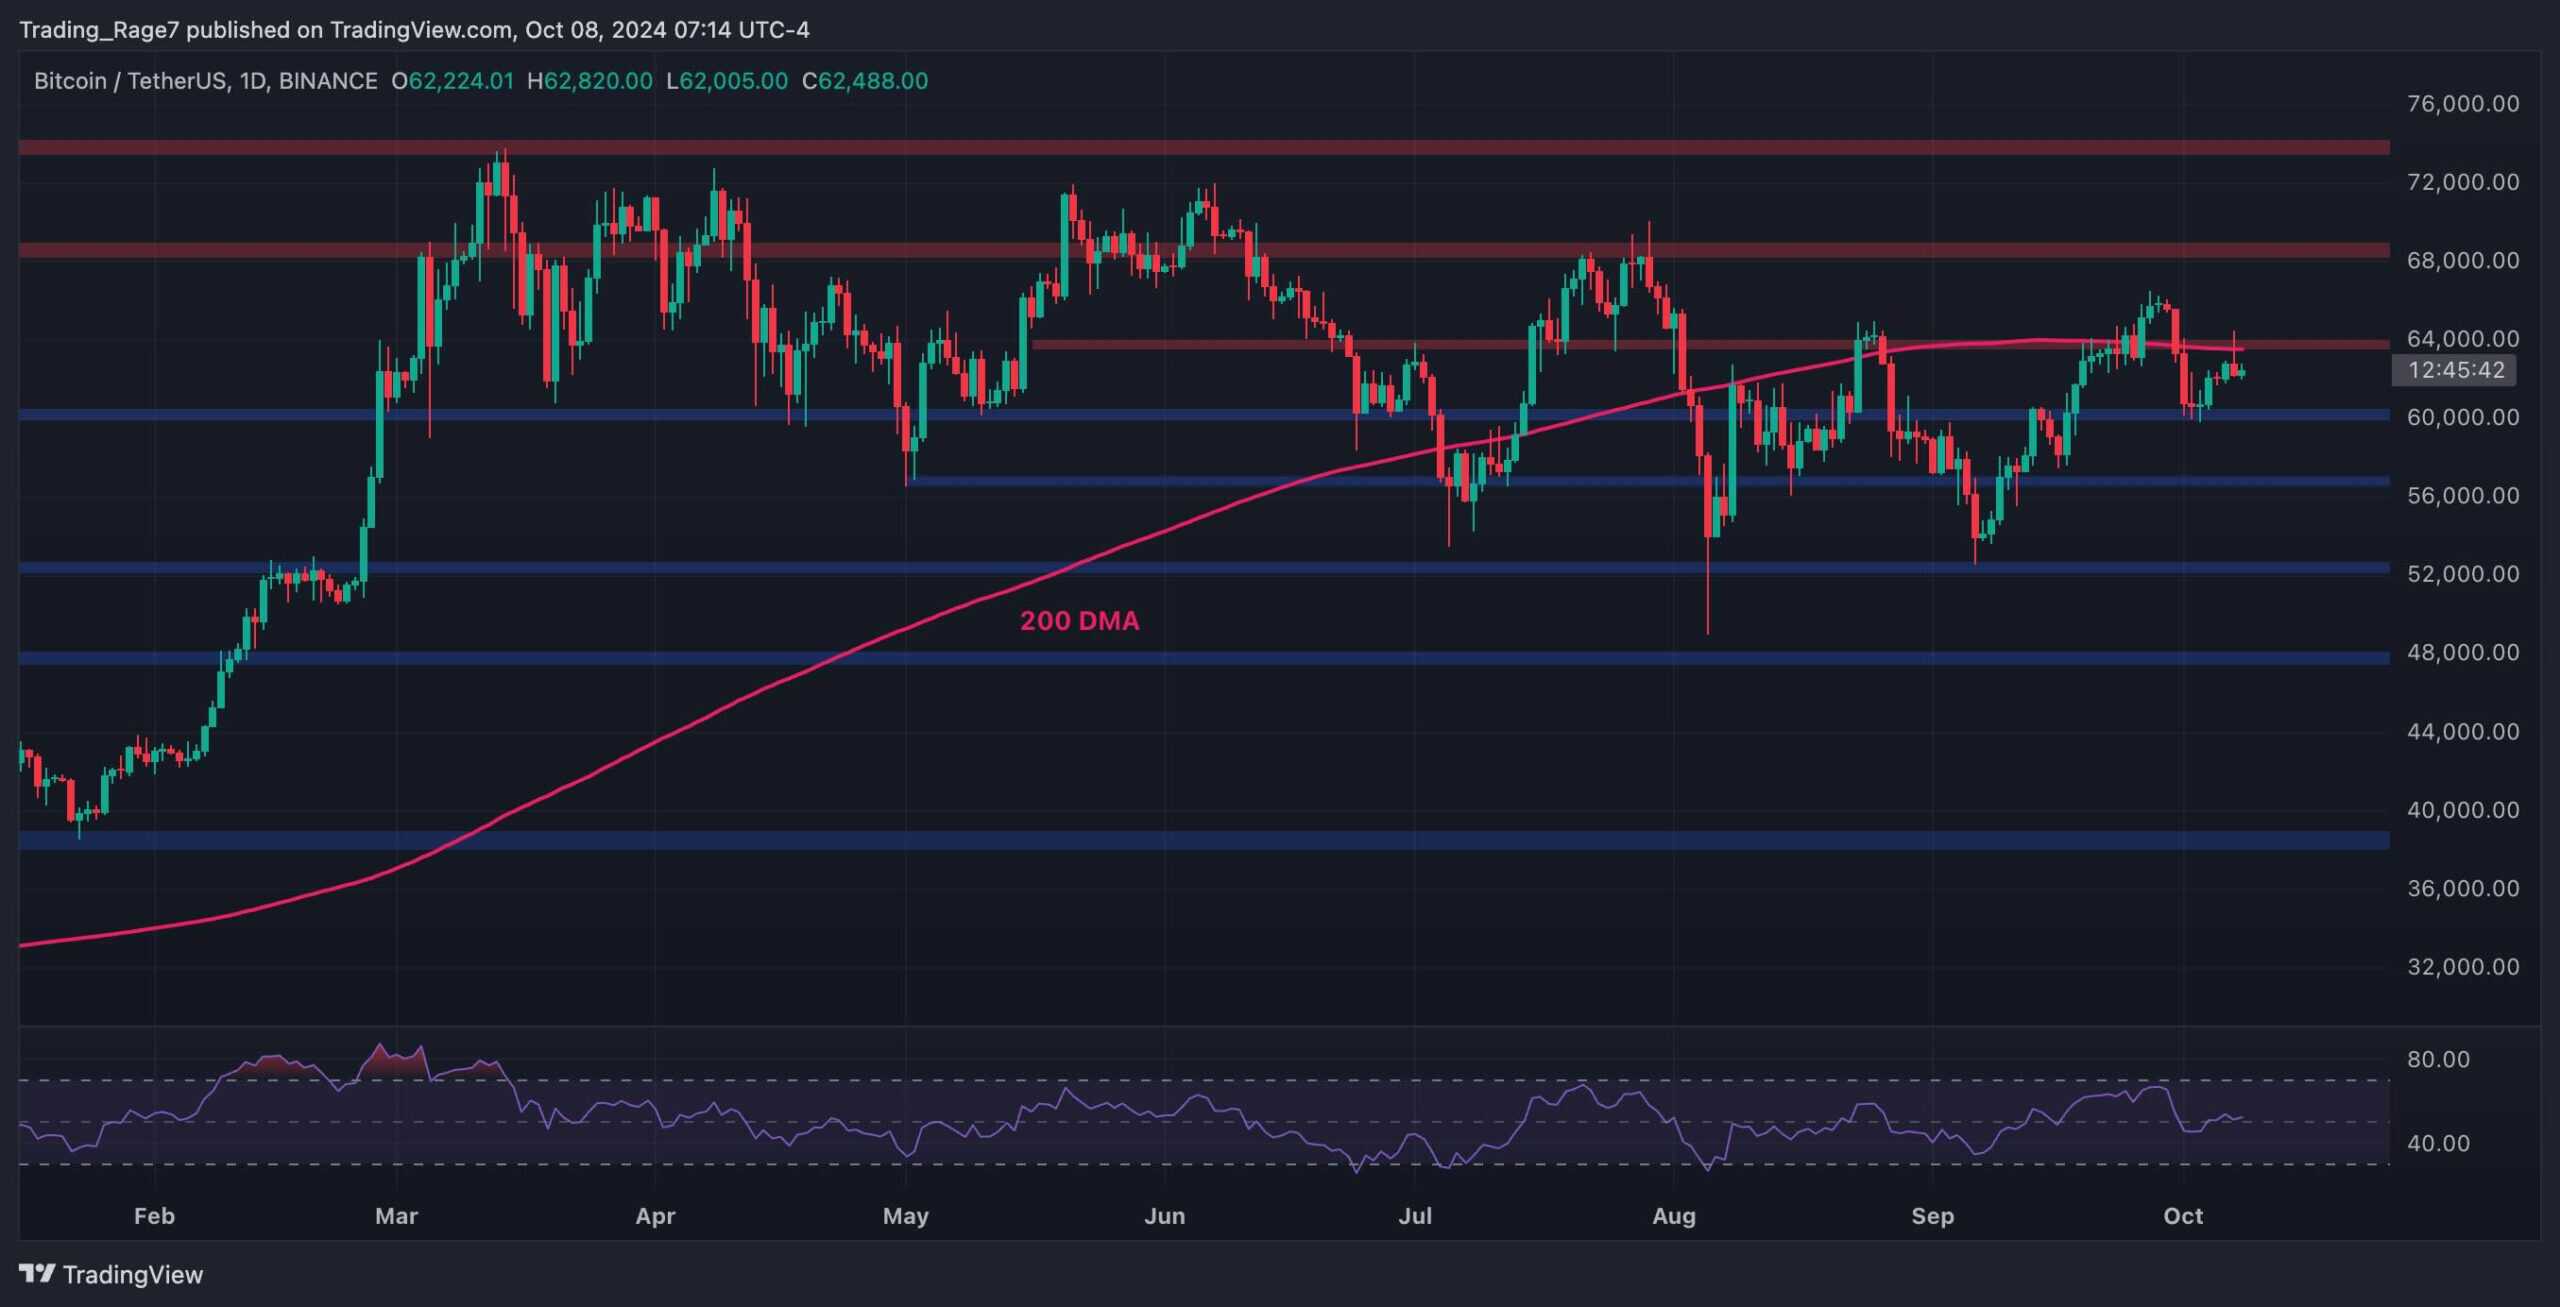
On the daily chart, the price has recently rebounded from the $60K support level following the breakdown below $64K and the 200-day moving average, located around the same area.
Meanwhile, these levels are currently preventing the price from rising, as yesterday’s daily candle demonstrates a clear bearish rejection.
If the cryptocurrency fails to break through the 200-day moving average soon, a decline toward the $56K level could be expected in the short term.
 Source: TradingView
The 4-Hour Chart
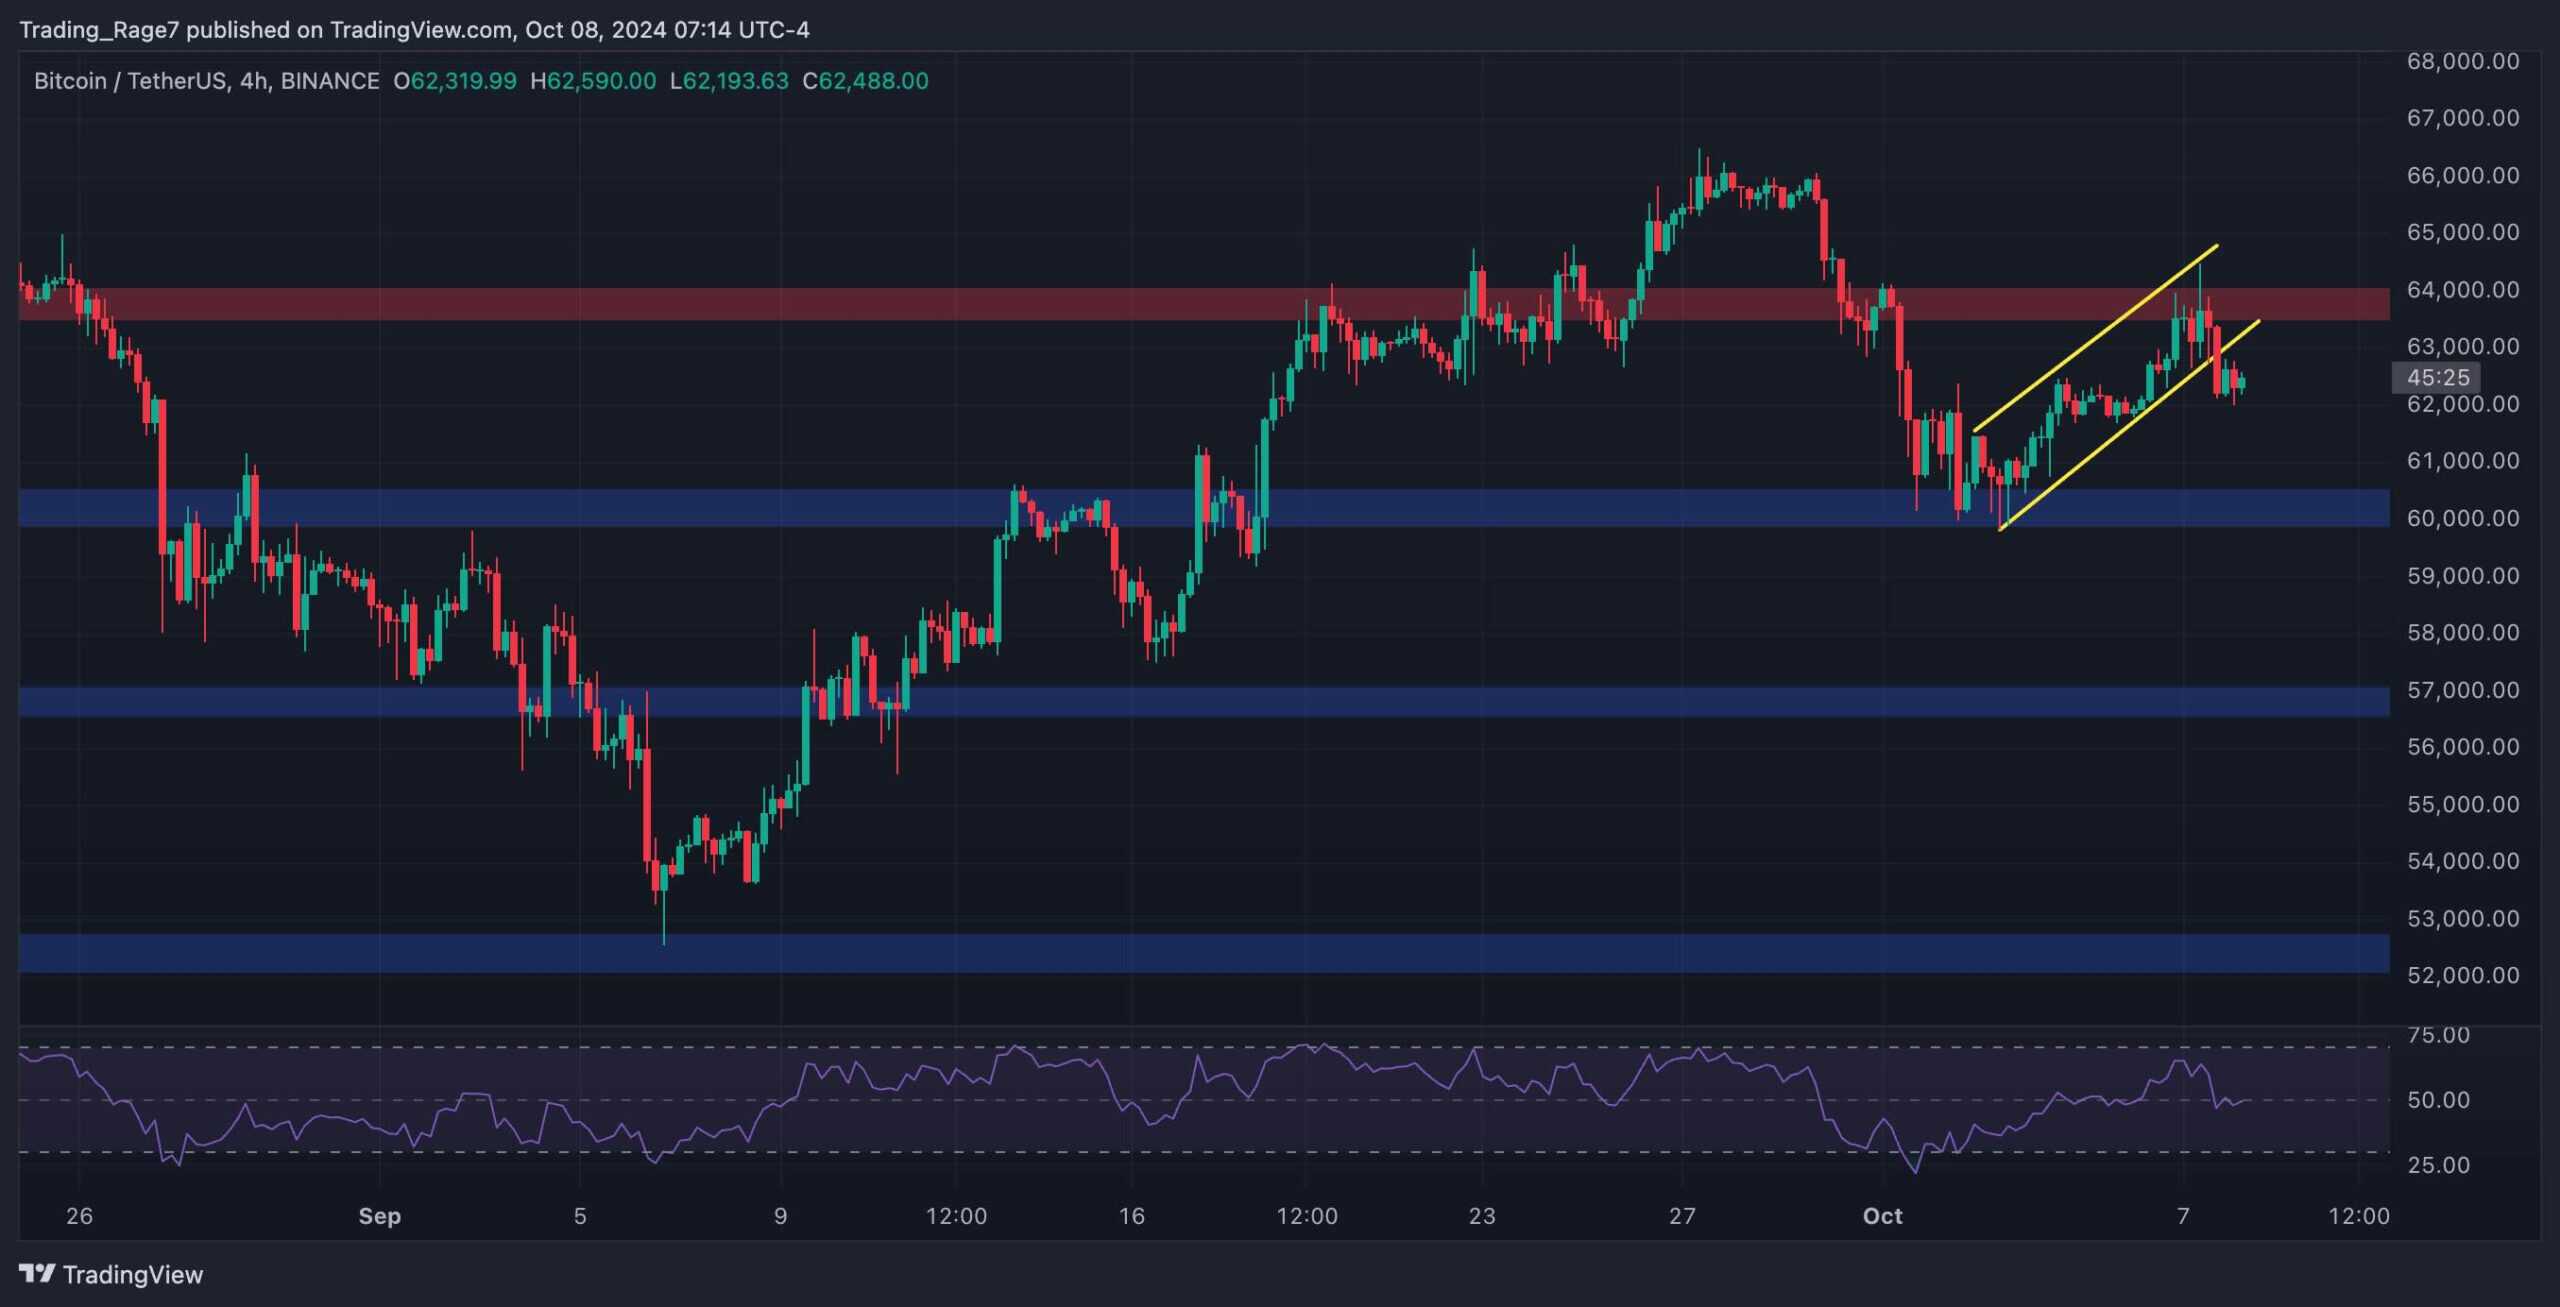
Looking at the 4-hour chart, things are seemingly turning in favor of the sellers.
BTC has been rising inside a tight, ascending channel, but it broke below the channel yesterday. Based on classical price action, a decline toward the $60K level and even beyond is highly probable at the moment.
Yet, with the RSI still hovering around the 50% level, the market could still rise toward the $64K level and break above it. However, the chances for this scenario are slim.
 Source: TradingView
On-Chain Analysis
By Edris Derakhshi (TradingRage)
Bitcoin Miner Reserve
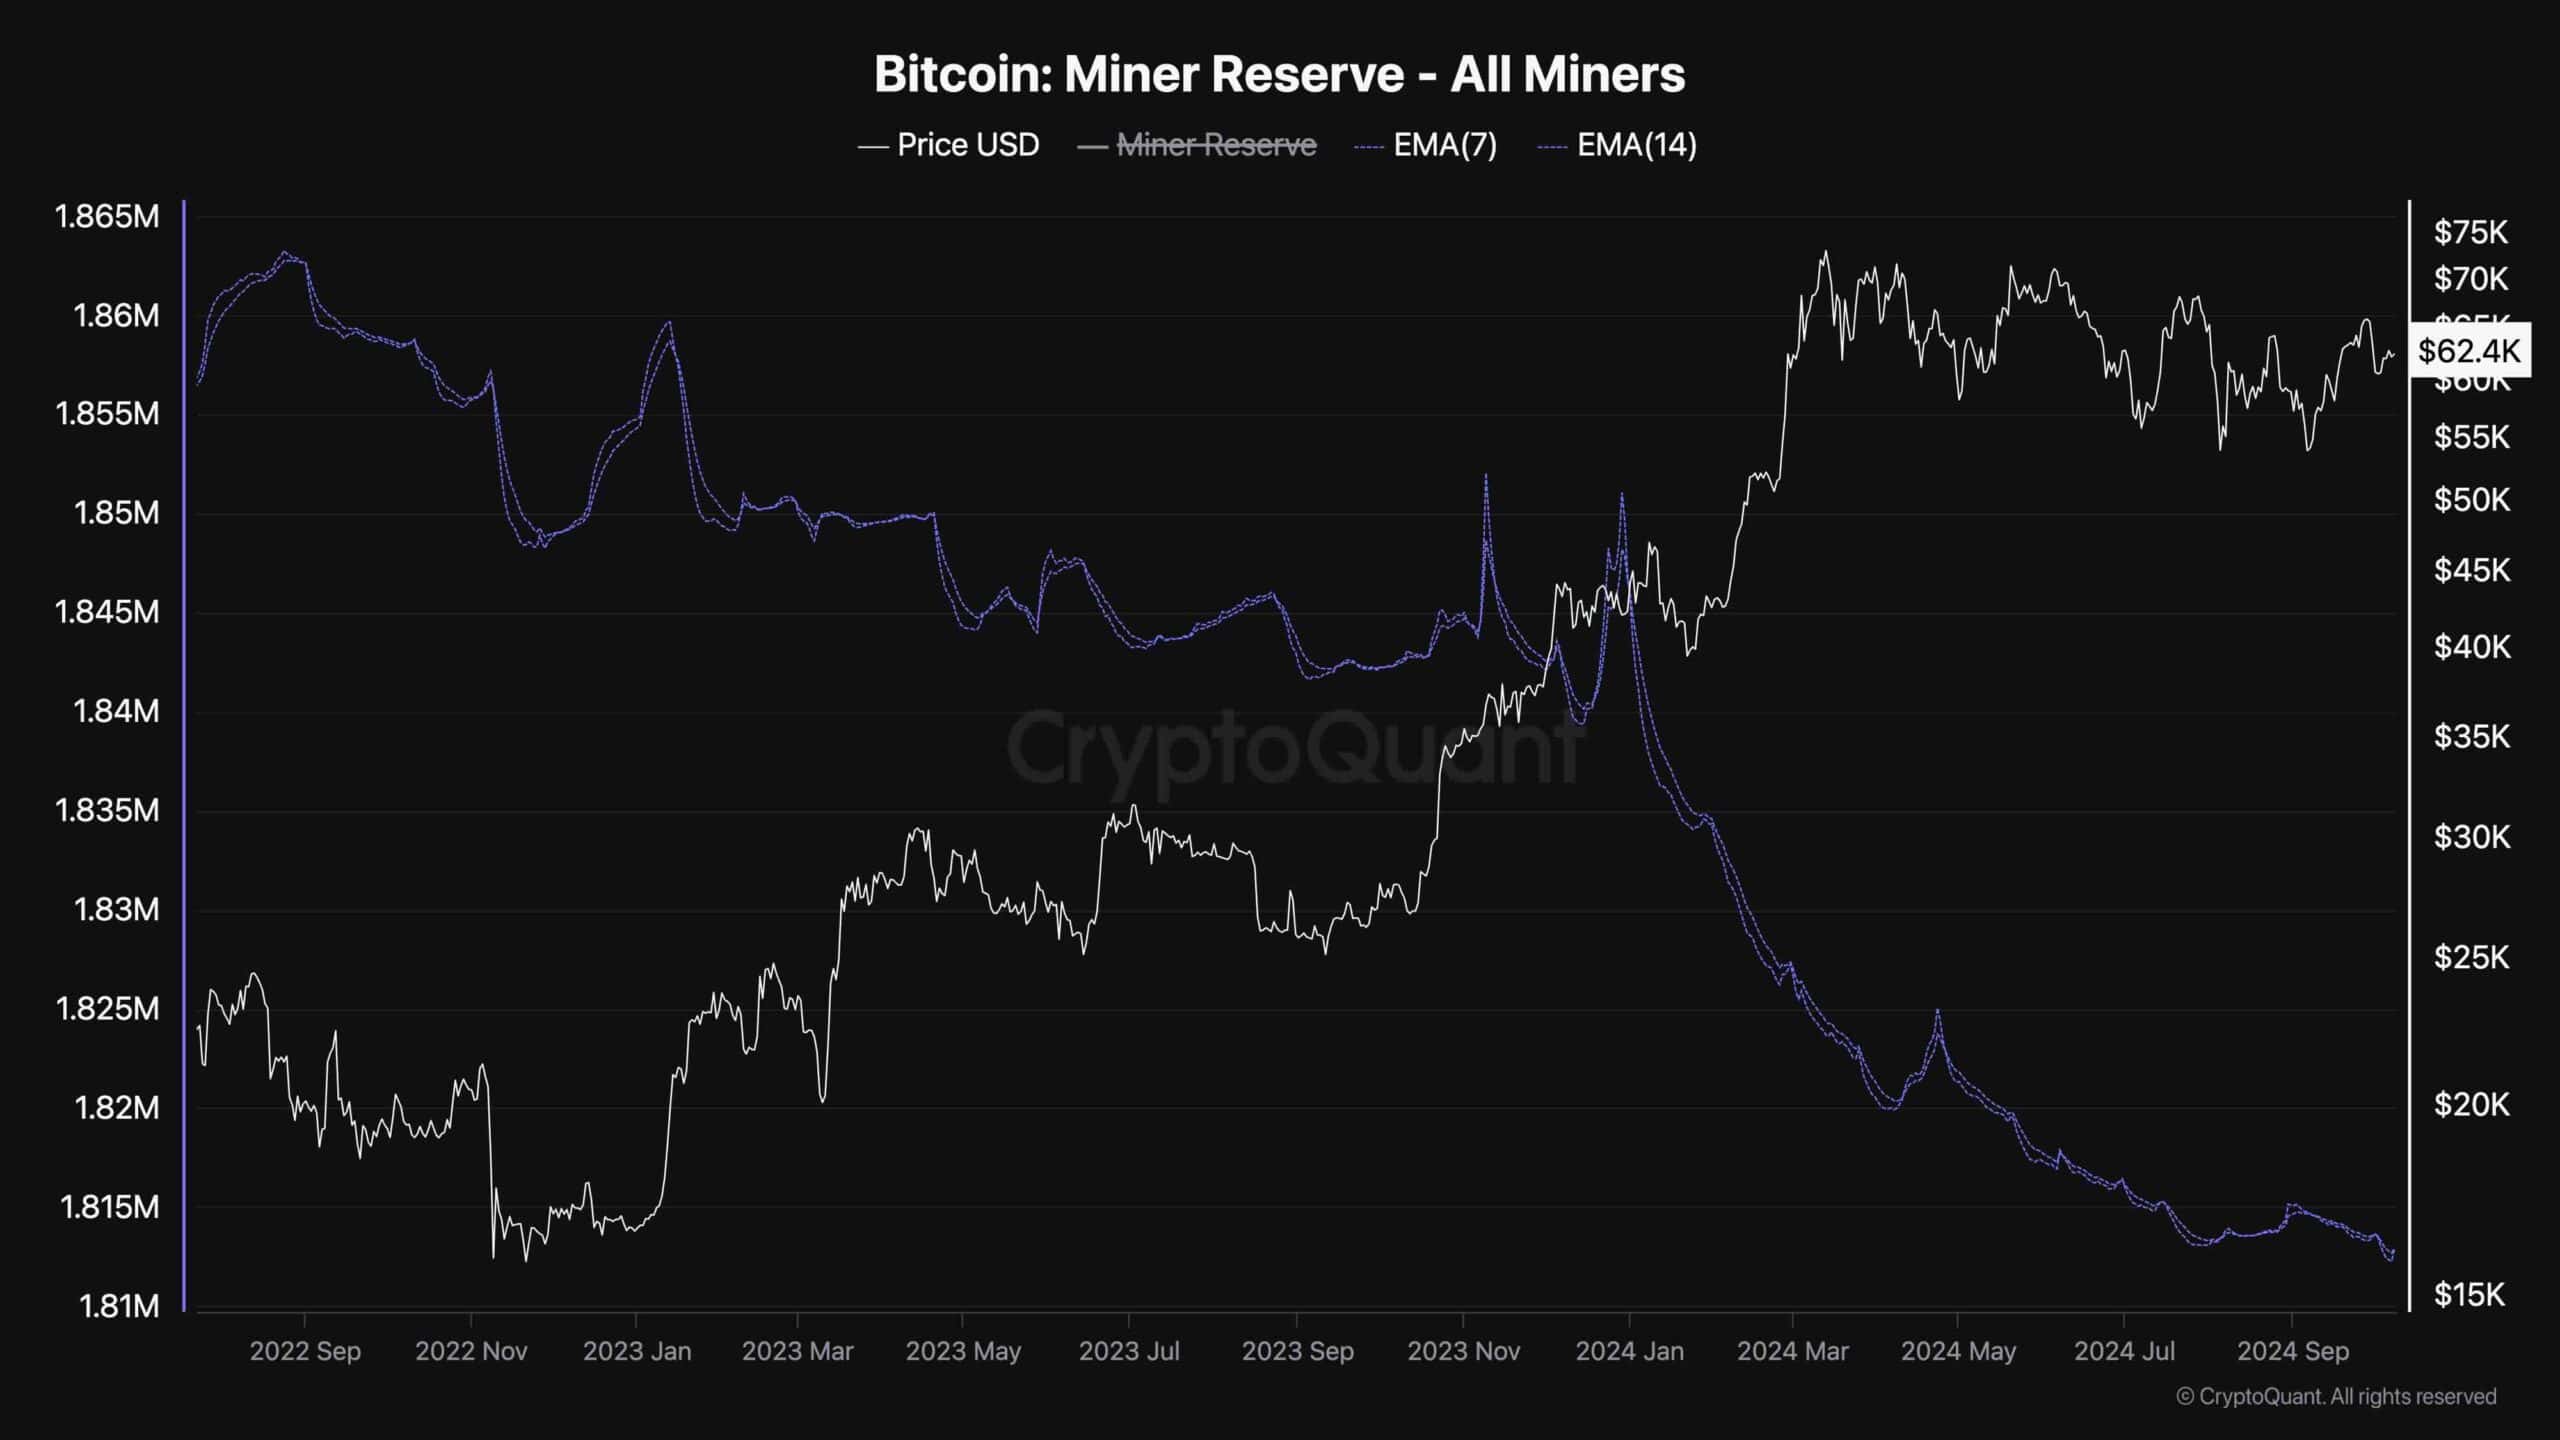
This chart demonstrates the Bitcoin miner reserve metric. It measures the amount of BTC held by miners and is an indicator for evaluating their behavior. Rising values show accumulation, while declines indicate distribution.
As the chart suggests, miners have been aggressively selling their coins since the price exceeded the $40K level.
With the reserve metric still declining, these investors are still selling at a higher rate than they’re accumulating. If nothing changes, this behavior might result in the market being overwhelmed with excess supply and lead to a more significant downtrend in the coming months.
 Source: CryptoQuant
The post BTC Price Analysis: Can Bears Push Bitcoin Below $60,000 Soon? appeared first on CryptoPotato.

 3 weeks ago
22


 English (US) ·