
 1 hour ago
11
1 hour ago
11
The post Can a Double-Bottom Breakout Push Shiba Inu For A 10x Rally? appeared first on Coinpedia Fintech News
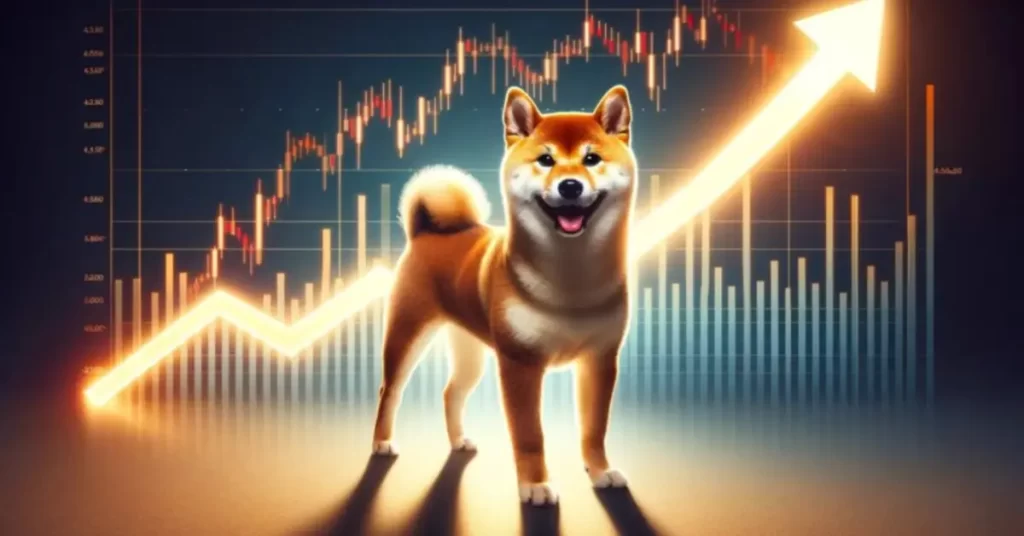
With a bullish trend in the crypto market, the meme coins are on a bullish track as the sentiments improve. Amid the top-performing meme coins, Shiba Inu shows a breakout rally ready to surge.
Known as the DOGE-killer, Shiba Inu has a market cap of $8.46 billion and ranks as the second biggest meme coin in the crypto world. Will this broader market recovery result in a new 52-week high for SHIB? Read this analysis for more details.
Shiba Inu Price Performance
The Shiba Inu daily chart reveals a massive bearish influence with a falling wedge pattern. The falling wedge pattern accounts for a 67% price drop between March and September. The downfall started from the $0.000040 mark, created a bottom, and tested the crucial support level of $0.00001297.
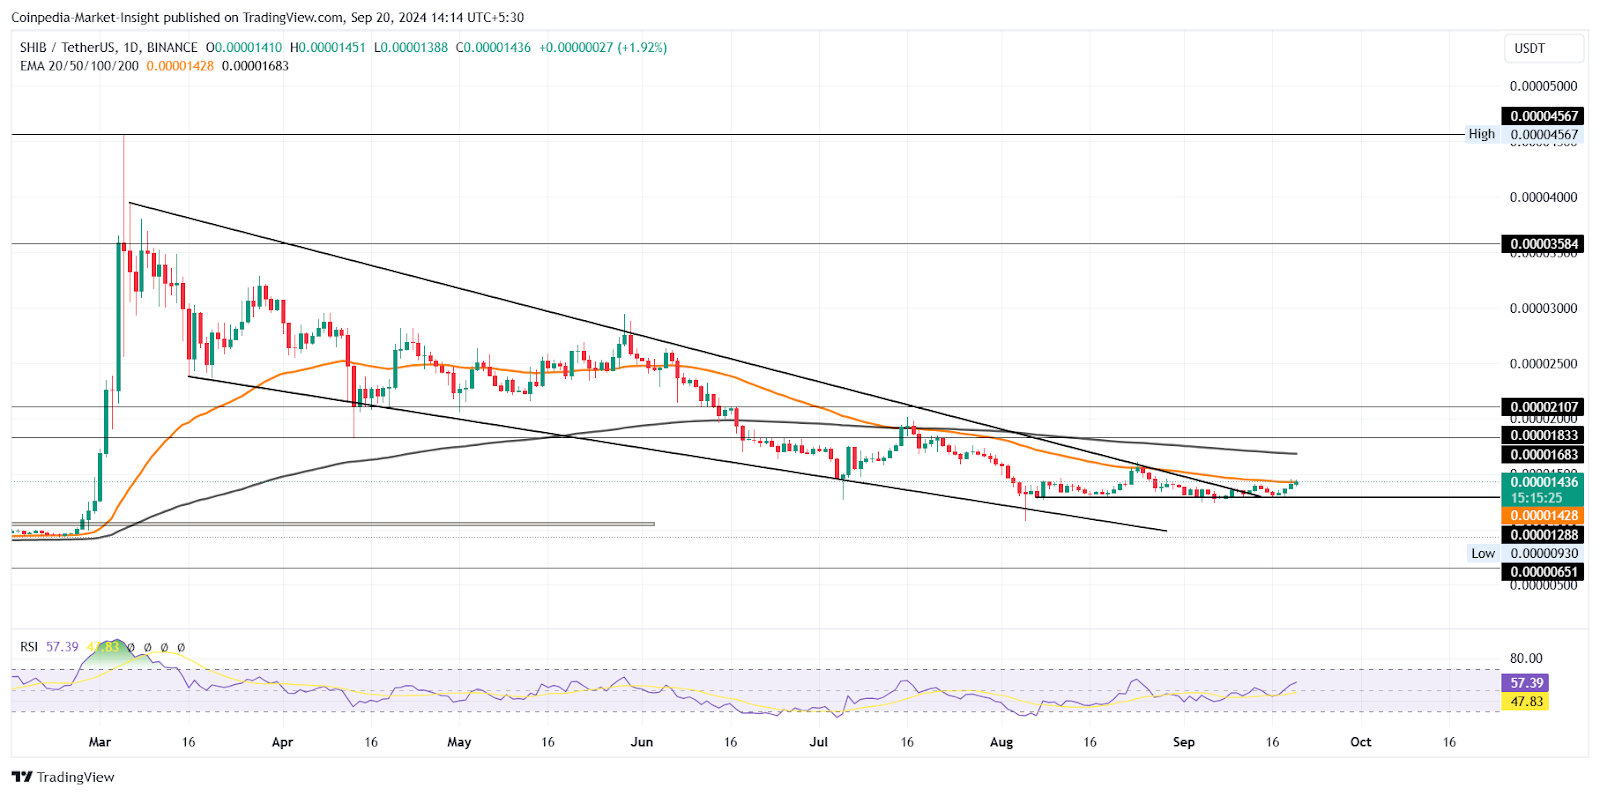
Currently, the Shiba Inu price trend takes a lateral route by taking support over $0.00001297, revealing a potential shift in the Shiba Inu trend. The Shiba Inu price trend exceeds the overhead trend line with the lateral trend and teases a double-bottom reversal.
With the trend line breakout, the double-bottom reversal is now challenging the 50-day EMA. Furthermore, the recent recovery run accounts for a price jump of 12% and forms four consecutive bullish candles.
Technical indicators:
RSI: Despite the declining trend in the 50-day and 200-day EMA following the recent death cross in July, the RSI line stays bullish. With the recent uptick in the recovery run, the RSI line is close to approaching the overbought boundary line.
Hence, the momentum indicator reveals a surge in buying pressure.
Will SHIB Price Reclaim $0.000050?
With an intraday gain of 2.20%, the Shiba Inu price is currently trading at $0.00001440. If the meme coin surpasses the 50-day EMA, the 200-day EMA comes as the next potential target at $0.00001683.
However, as the meme coin concludes the lower-high formation, the previous peaks arise as potential targets. Hence, based on this assumption, the $0.000020.L psychological mark and the crucial resistance of $0.000028 are also potential targets. On the flip side, the crucial supports for the meme coin are at $0.00001297 and the $0.000010 psychological mark.
Will Shiba Inu Give A 10X Rally?
Based on the weekly chart, the SHIB price trend shows a pullback phase breaking under the 50W EMA. Currently, the downfall trends are under the 23.60% Fibonacci level, with recovery rally chances in the short term.
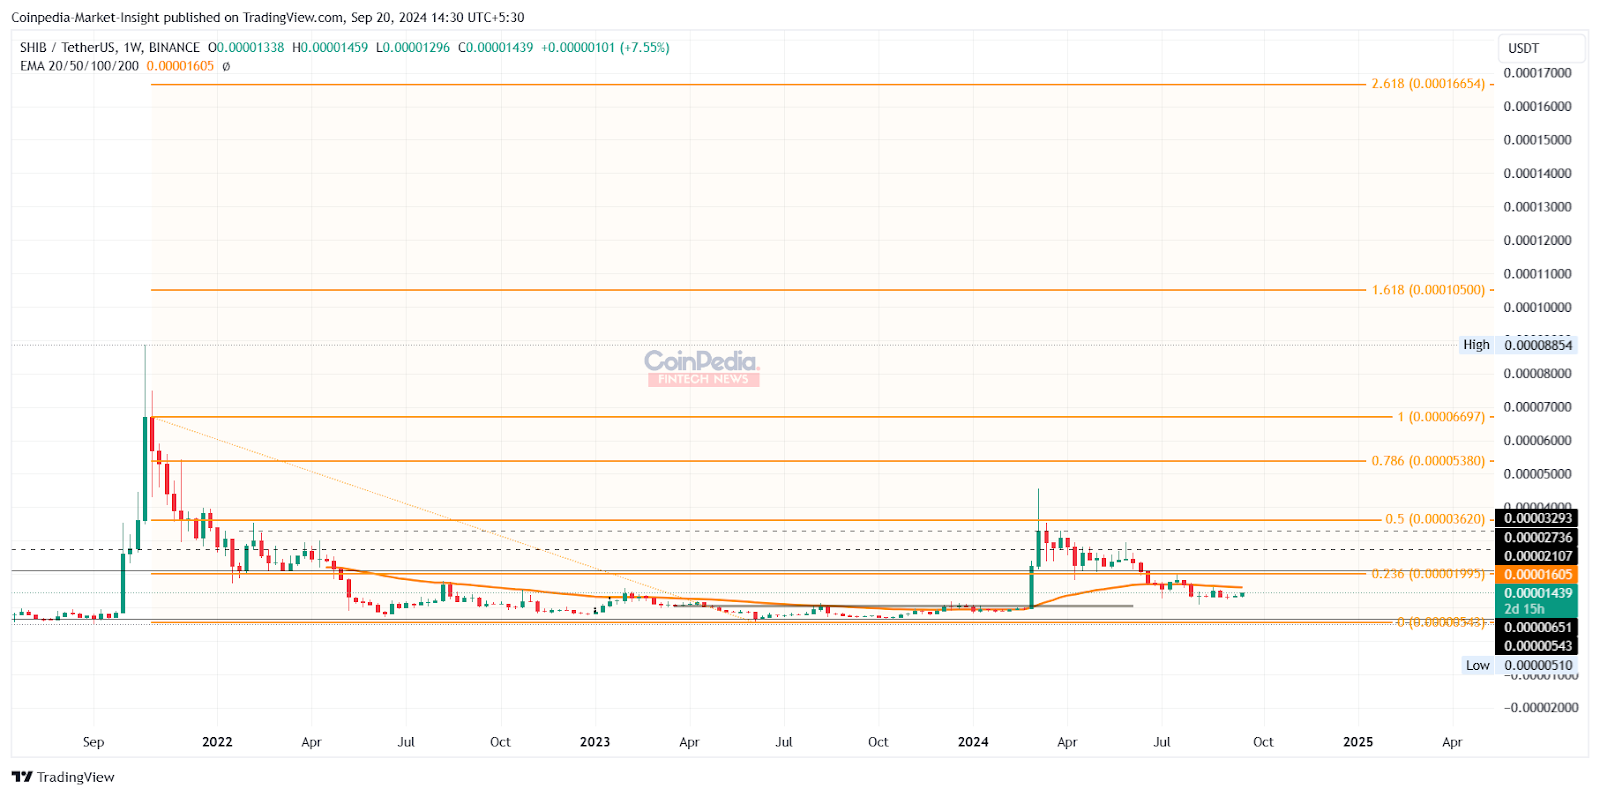
However, with a potential comeback in the next bull market, the bullish reversal in the meme coin can scale to the all-time high level of $0.000088. Further, based on the Fibonacci level, the bull run in SHIB can reach the 1.618 level at the $0.0001050 psychological mark for almost 7x returns. Hence, the underlying potential in Shiba Inu is estimated to be near a 10X rally in the next bull run.
Curious if Shiba Inu has the potential to reach $1? Find out now in Coinpedia’s SHIB price prediction for 2024 and years ahead.


 English (US) ·