
 3 months ago
31
3 months ago
31
The Cardano (ADA) price attempts to break out from a long-term horizontal resistance that has existed for nearly three months.
ADA broke out from a short-term descending resistance trend line. Can the increase take it above the long-term horizontal resistance?
Cardano Approaches Long-Term Resistance
The weekly time frame technical analysis shows the Cardano price has increased swiftly since October. The upward movement culminated with a high of $0.68 in December 2023, a new yearly high.
ADA failed to break out from a long-term horizontal resistance area despite the increase. Rather, it created five successive long upper wicks, considered signs of selling pressure (red icons).
After a month-long decrease, ADA regained its footing and is attempting to break out from the long-term resistance area again.
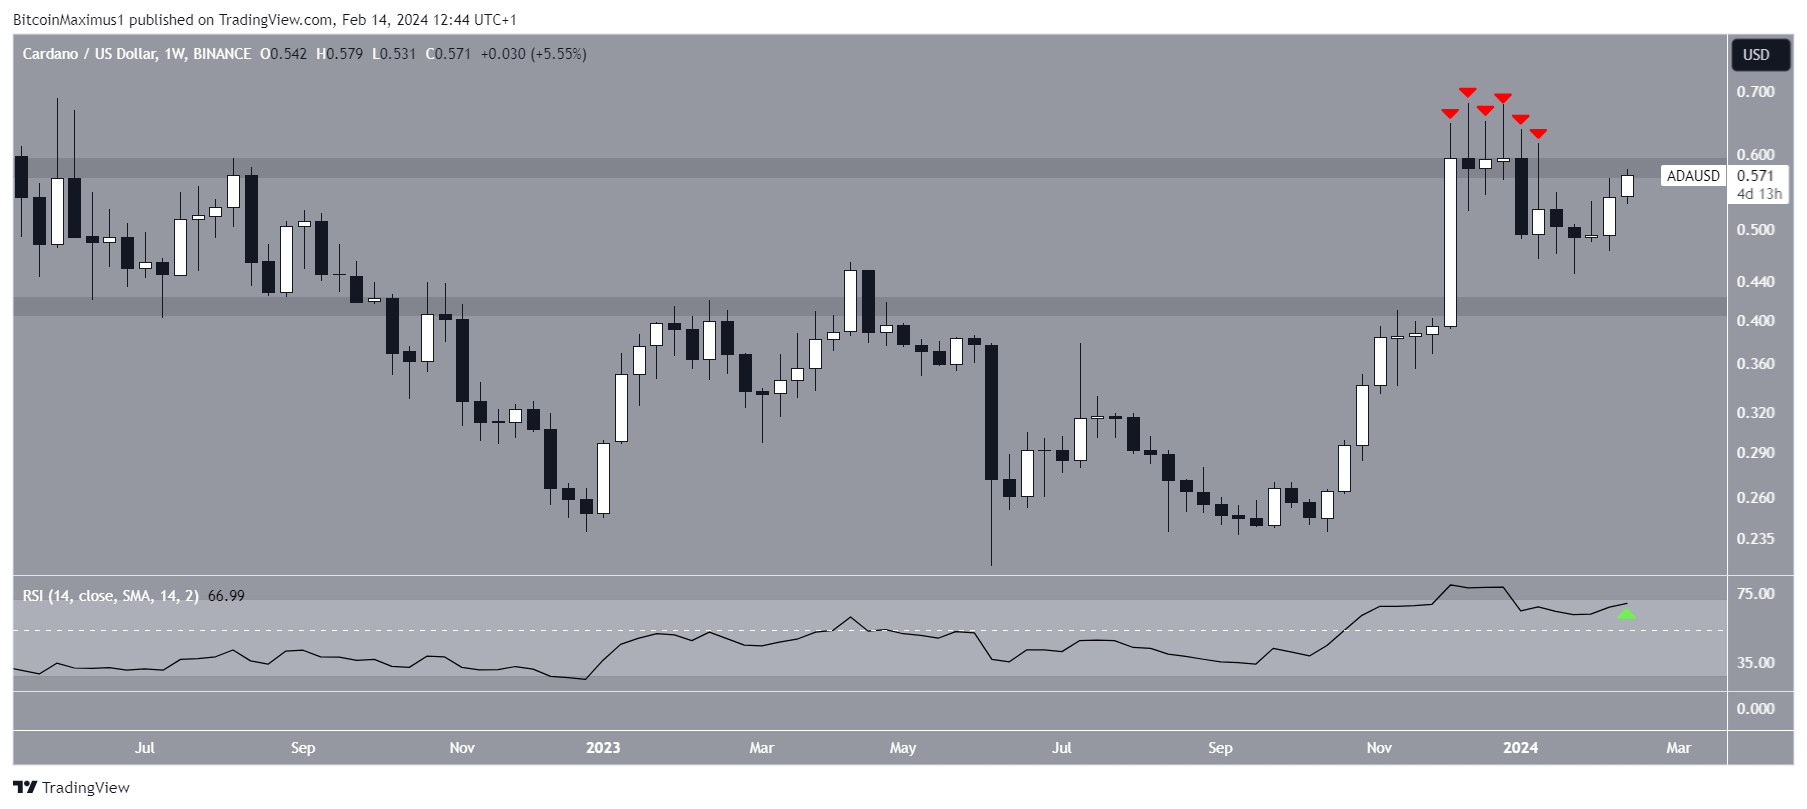 ADA/USD Weekly Chart. Source: TradingView
The weekly Relative Strength Index (RSI) is bullish. When evaluating market conditions, traders use the RSI as a momentum indicator to determine whether a market is overbought or oversold and whether to accumulate or sell an asset.
If the RSI reading is above 50 and the trend is upward, bulls still have an advantage, but if the reading is below 50, the opposite is true. The RSI is above 50, increasing, and has nearly crossed above 70. These are all considered signs of a bullish trend.
Read More: How To Stake Cardano (ADA)
What Are Analysts Saying?
Cryptocurrency traders and analysts on X positively view the future ADA trend.
StakeWithPride noted that the ADA institutional inflows in the first six weeks of 2024 have been similar to those for 2023.
Charles Hoskinson noted the difference in regulation between Ethereum and ADA.
“Hey look at that, Ethereum staking may be a regulated activity in Switzerland, but Cardano isn’t” Hoskinson stated.
However, Dan Gambardello does not believe the ADA price will increase above $1 before the Bitcoin (BTC) halving.
ADA Price Prediction: Will the Breakout Lead to Higher Prices?
The technical analysis of the daily time frame offers a bullish outlook. The chart shows that ADA broke out from a descending resistance trend line on February 8, initiating the upward movement. The breakout was combined with an RSI increase above 50, legitimizing the movement.
The wave count also supports the ongoing increase. Elliott Wave theory involves the analysis of recurring long-term price patterns and investor psychology to determine the direction of a trend. The most likely count suggests ADA is in the fifth and final wave of an upward movement that started in June 2023 (white).
If the count is correct, the first target for the top of the increase is at $0.83, found by the 1.61 external Fib retracement of wave four. The target is 45% above the current ADA price.
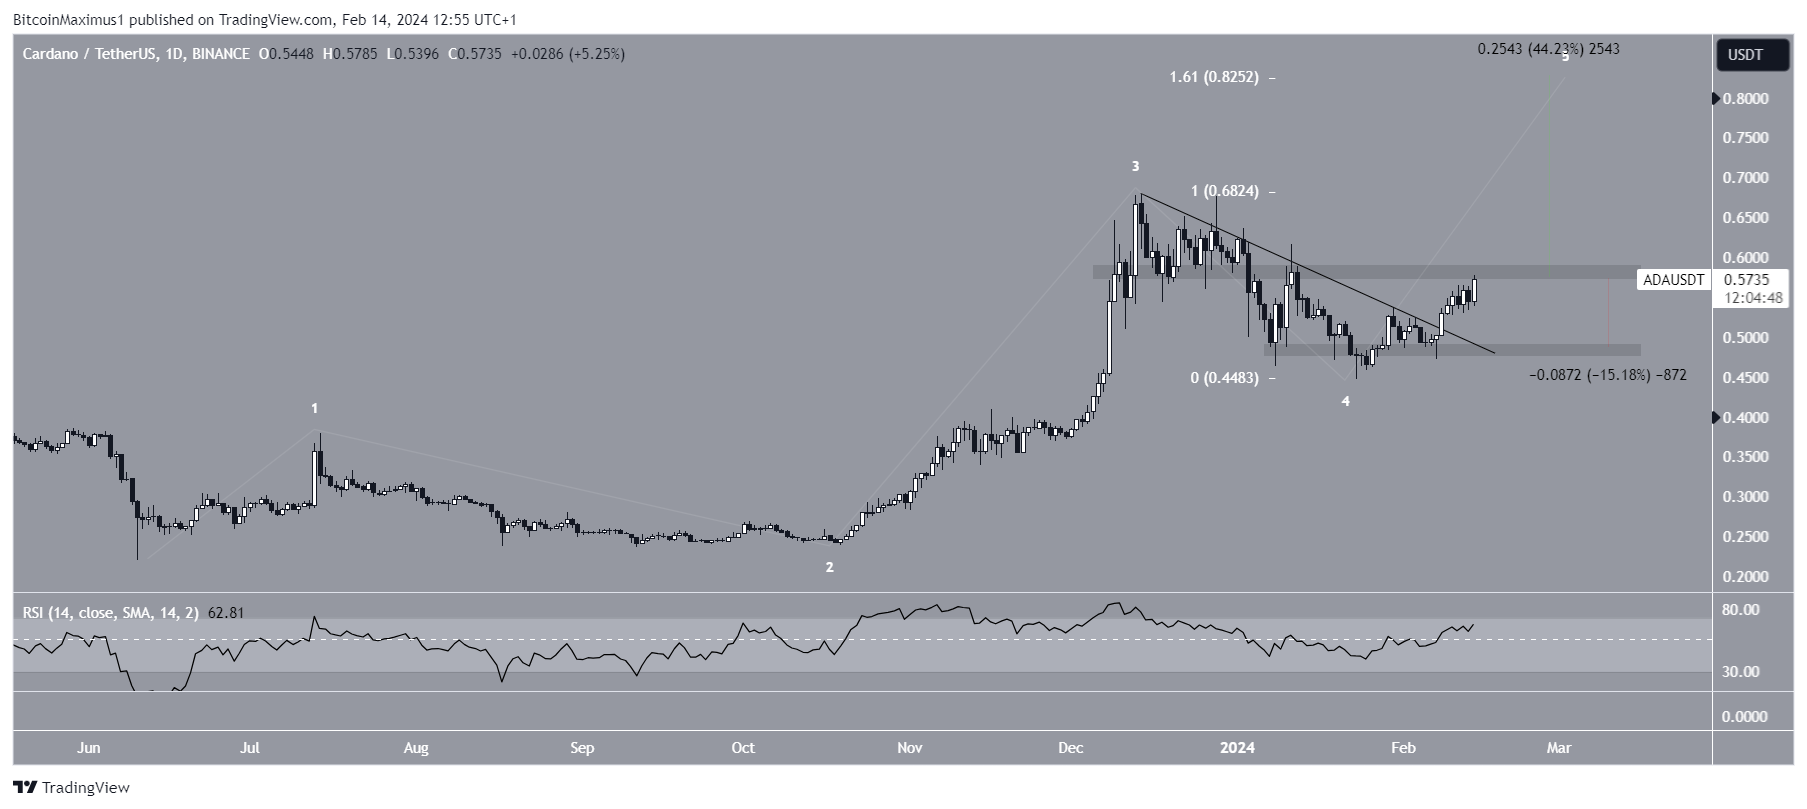 ADA/USDT Daily Chart. Source: TradingView
Despite the bullish ADA price prediction, failure to close above the $0.58 horizontal resistance area can trigger a 15% drop to the closest support at $0.48.
Read More: How to Mine Cardano (ADA)
For BeInCrypto‘s latest crypto market analysis, click here.
The post Cardano (ADA) Breakout: Assessing the Potential for a 45% Gain appeared first on BeInCrypto.


 English (US) ·