
 1 month ago
31
1 month ago
31
Cardano (ADA) is facing intense selling pressure, dropping nearly 10% in the last 24 hours and almost 29% over the past week. Since its inclusion in the U.S. strategic crypto reserve, ADA has fallen 39%, struggling to regain bullish momentum.
Indicators like BBTrend and DMI show that bearish sentiment remains strong, with sellers still in control. If the current downtrend continues, ADA could test key support levels, but a reversal could push it back toward major resistance zones.
ADA BBTrend Shows the Selling Pressure Is Getting Stronger
Cardano BBTrend indicator is currently at -19.52, continuing its decline since yesterday. Earlier this month, from March 5 to March 8, BBTrend remained positive, reaching a peak of 31 on March 6.
This shift from positive to negative territory suggests a weakening bullish trend, with increasing downside pressure on ADA price. Traders are now watching whether this decline continues or if ADA can regain momentum.
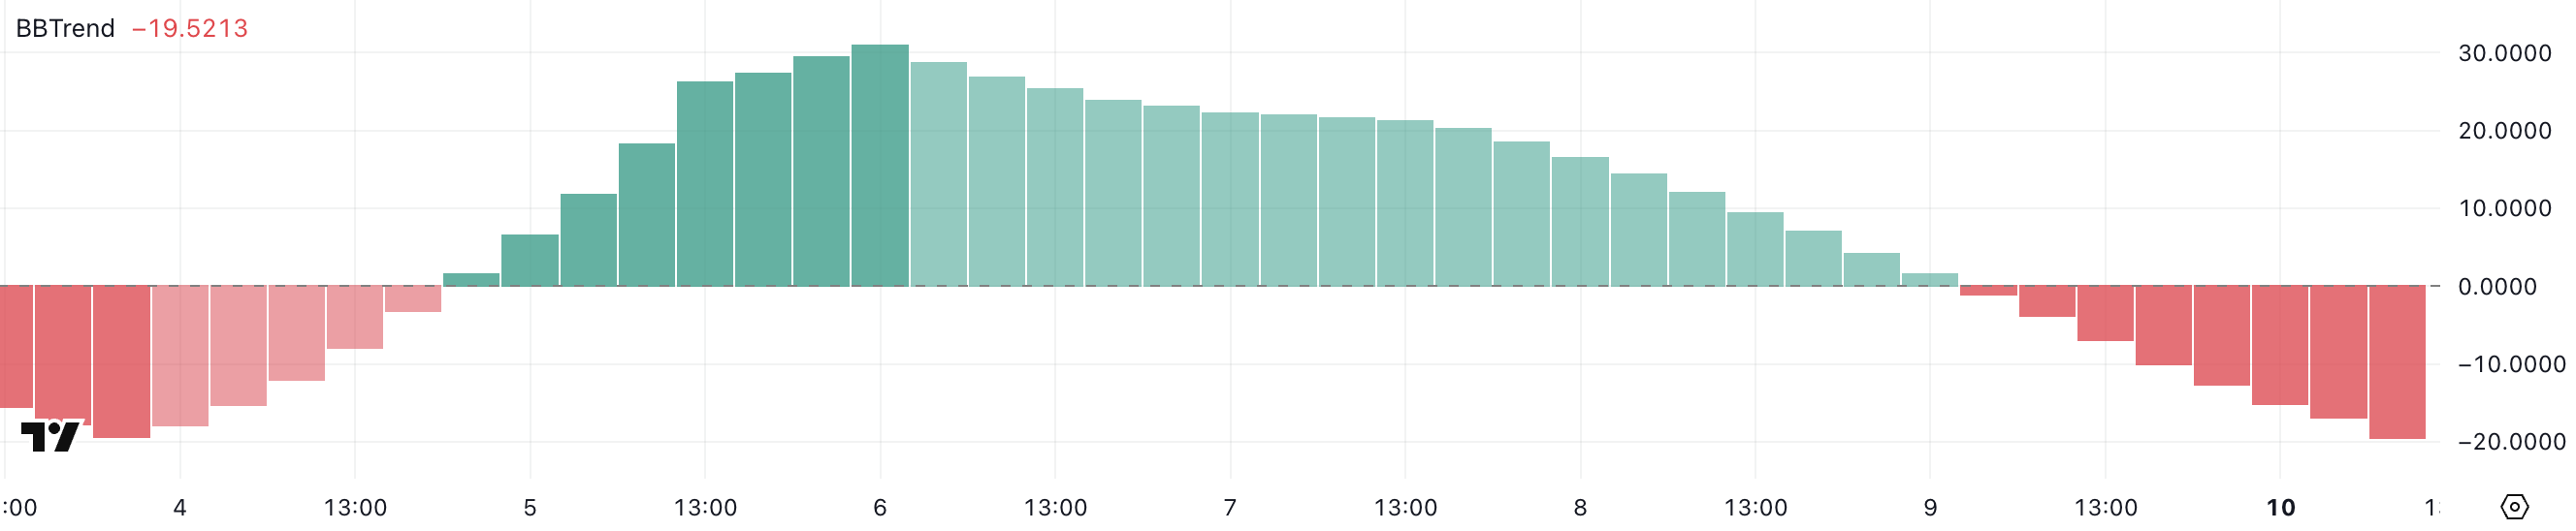 ADA BBTrend. Source: TradingView.
BBTrend, or Bollinger Band Trend, is an indicator that measures price trends based on Bollinger Bands. It shows whether an asset is in a strong, bullish, or bearish phase. When BBTrend is positive, it suggests strong upward momentum, while negative values indicate growing selling pressure.
With ADA’s BBTrend now at -19.52, it signals increasing bearish sentiment, suggesting the price could continue declining unless buyers step in. If the downtrend persists, ADA may test key support levels in the coming days.
Cardano DMI Shows Sellers Are Still In Control
Cardano Directional Movement Index (DMI) chart shows that its Average Directional Index (ADX) has risen to 34.5, up from 26.6 yesterday. This increase suggests that ADA’s current trend – whether bullish or bearish – is gaining strength.
Given that ADA is in a downtrend, the rising ADX indicates that selling pressure is intensifying, making it more difficult for the price to reverse in the short term.
ADX measures the strength of a trend on a scale from 0 to 100, with values above 25 indicating a strong trend and above 50 suggesting an extremely strong trend.
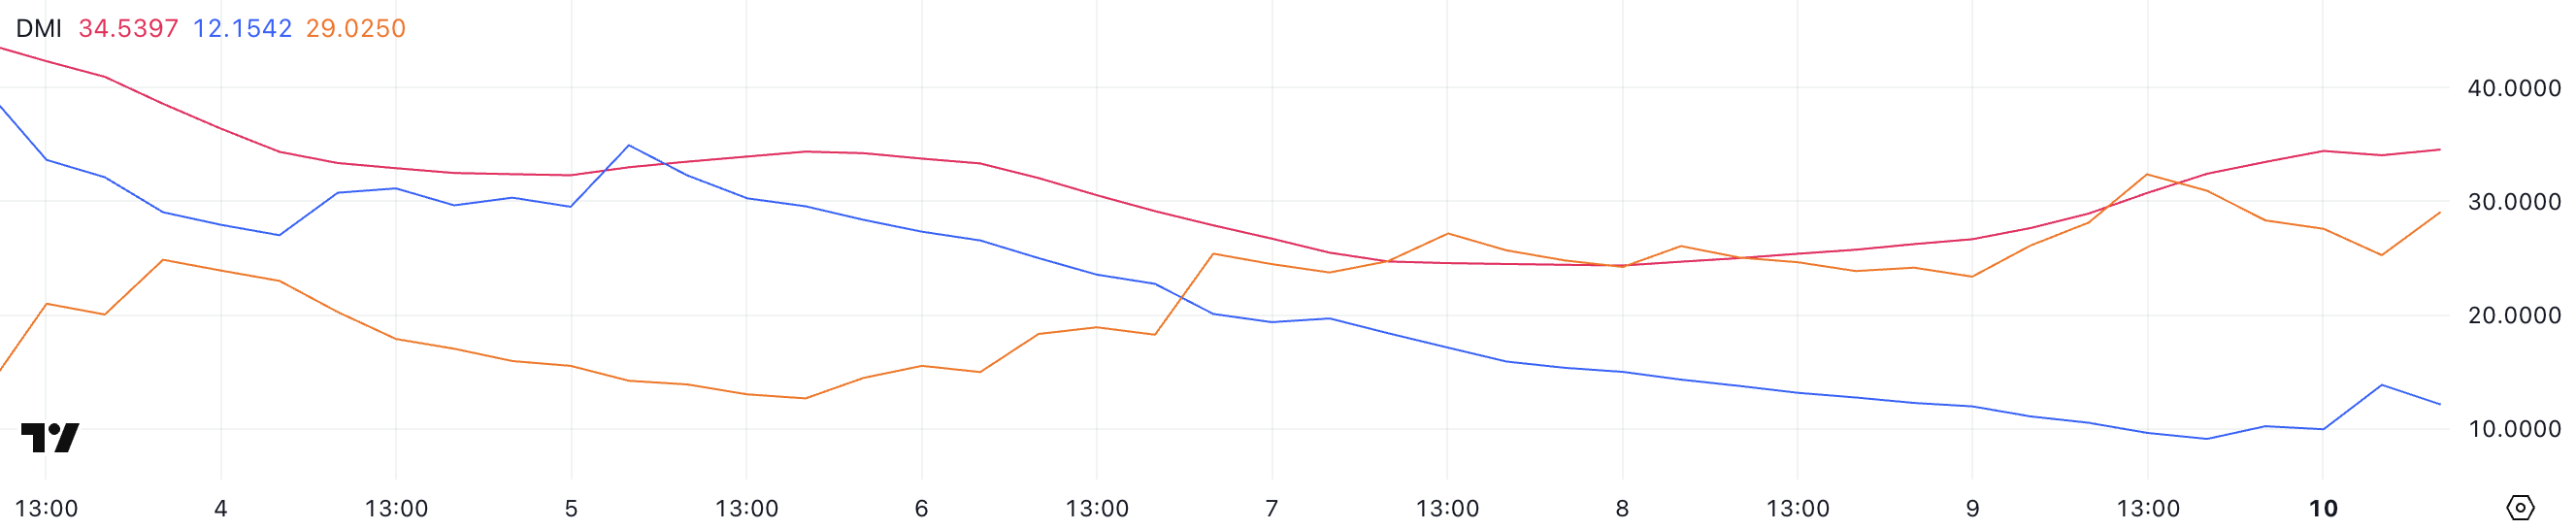 ADA DMI. Source: TradingView.
Meanwhile, ADA’s +DI (positive directional index) has climbed to 12 from 9.6 yesterday but is slightly down from 13.8 a few hours ago, indicating weak bullish attempts.
At the same time, -DI (negative directional index) is at 29, lower than yesterday’s 32.3 but rising from 25.2 a few hours ago.
This suggests that while sellers still control the trend, some short-term pullbacks are occurring. If -DI remains dominant and ADX continues rising, ADA’s downtrend could extend further.
Will Cardano Fall Below $0.60?
Cardano EMA lines indicate that a potential death cross could form soon, signaling a bearish momentum.
A death cross occurs when a short-term EMA crosses below a longer-term EMA, often leading to increased selling pressure.
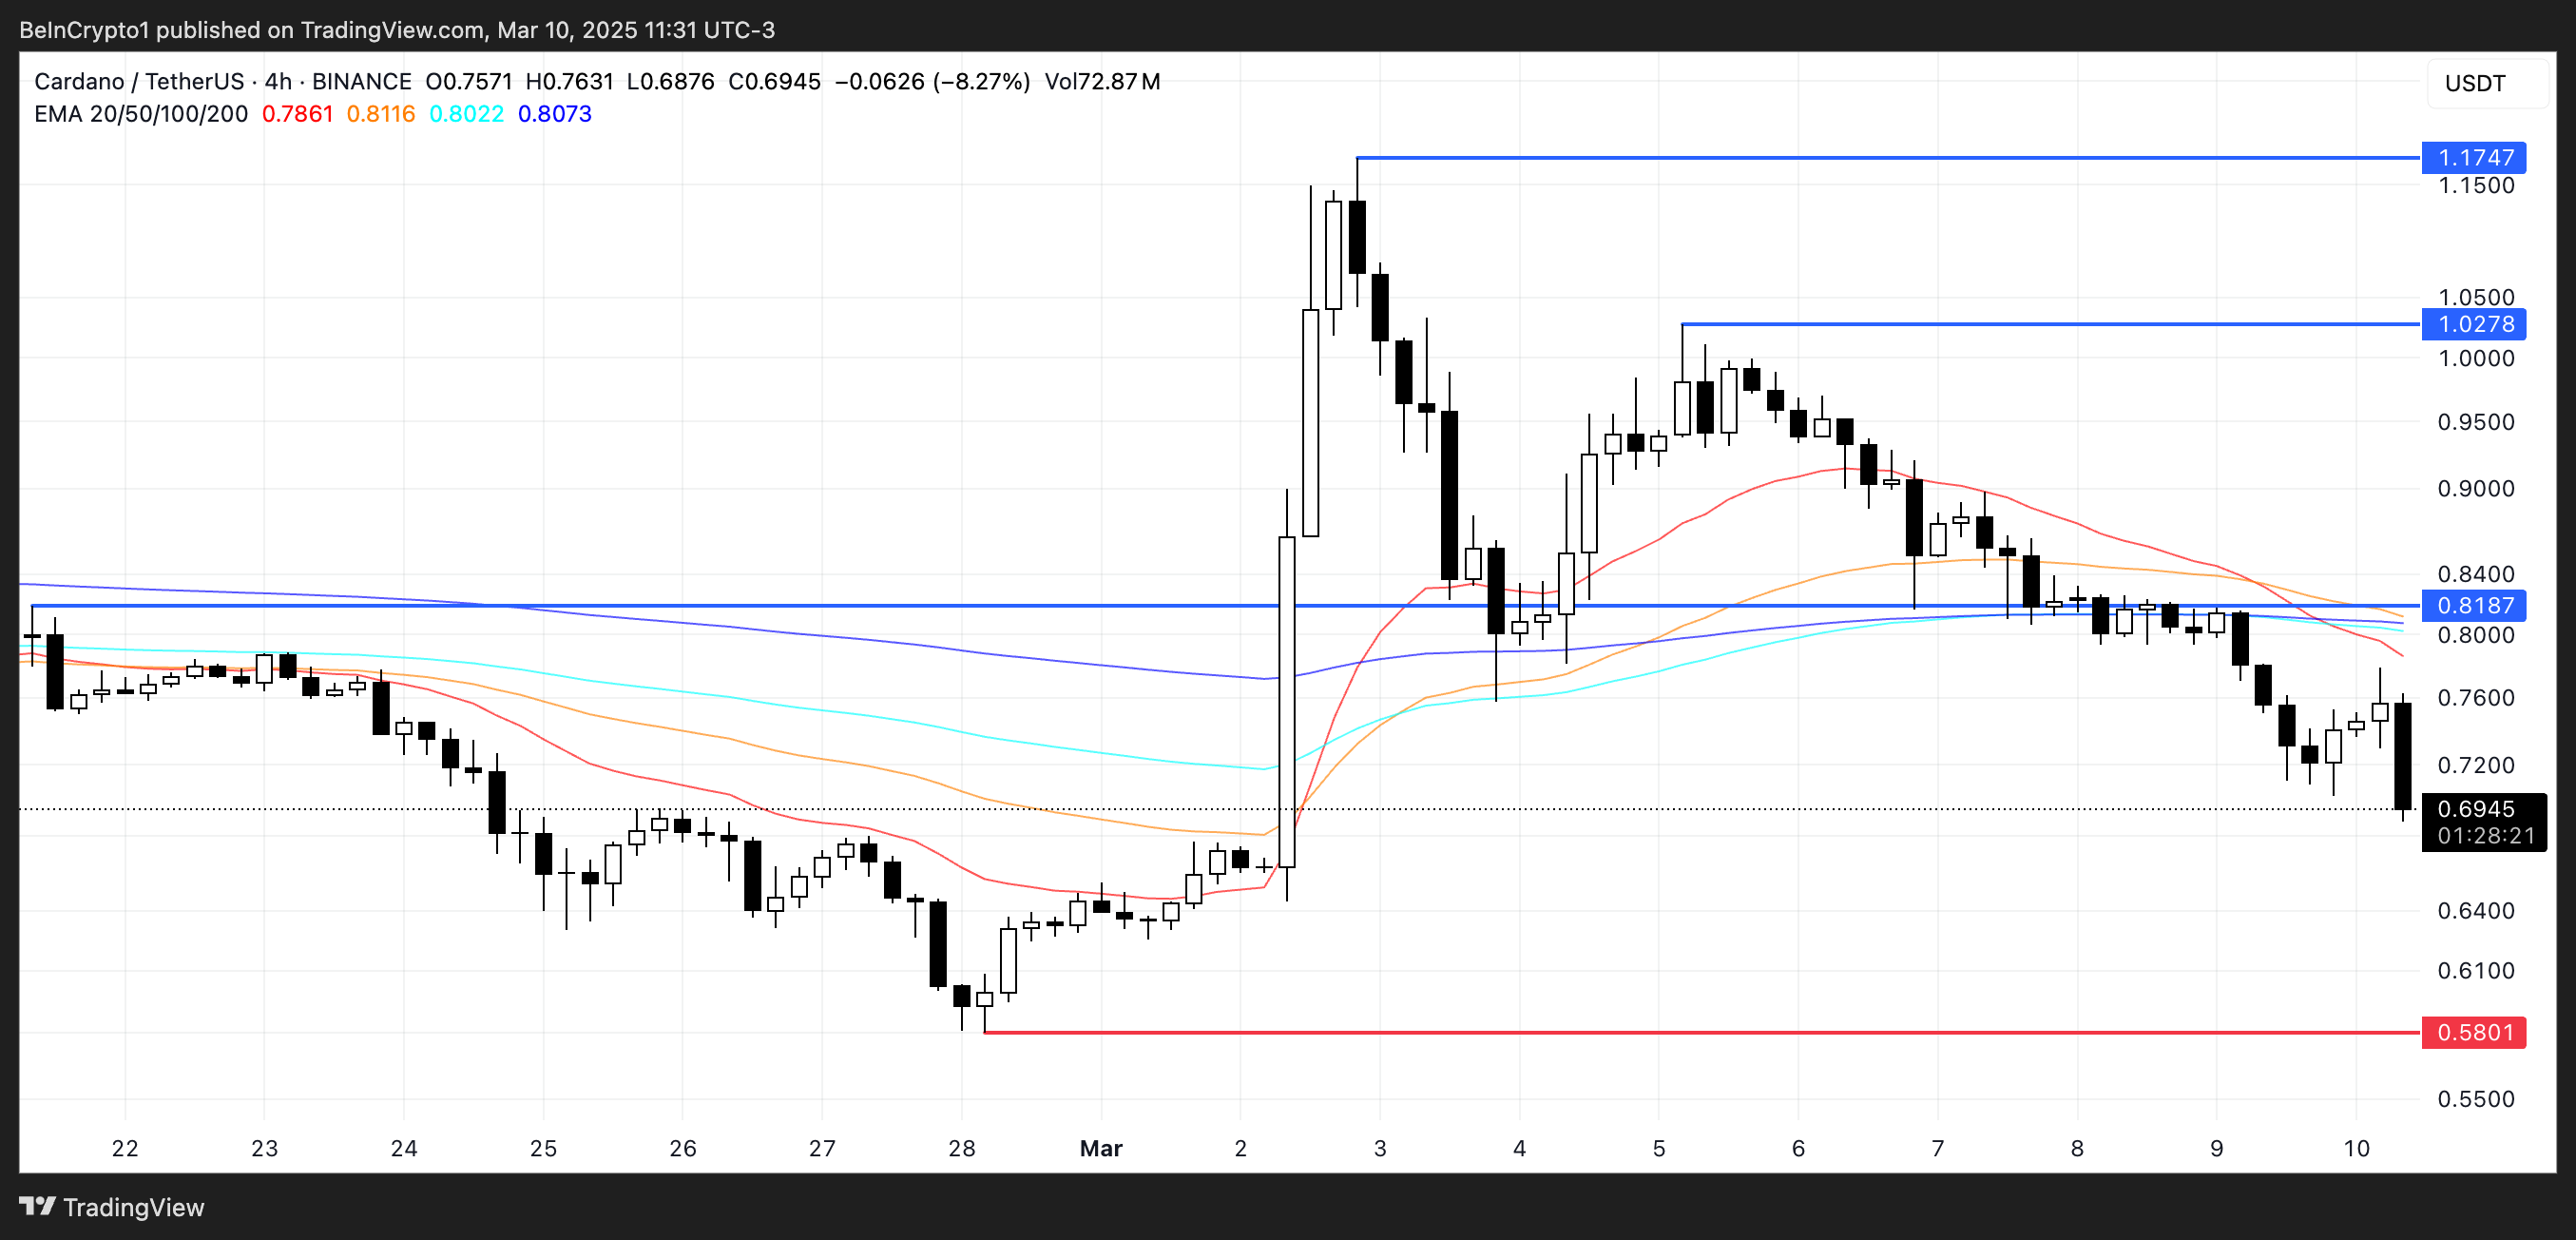 ADA Price Analysis. Source: TradingView.
If this bearish crossover happens, ADA price could decline further, with the $0.58 support level becoming a key area to watch. A breakdown below this level could trigger even deeper losses.
However, if buyers regain control and ADA can reverse its trend, the price may rise toward the $0.818 resistance level. A breakout above that could open the door for further gains toward $1.02 and even $1.17 if momentum strengthens.
The post Cardano (ADA) Down 39% After Its US Crypto Reserve Inclusion: What’s Next? appeared first on BeInCrypto.


 English (US) ·