
 8 months ago
44
8 months ago
44
Cardano’s price has experienced a massive drop recently following the Ethereum crash. However, things are still looking more positive for ADA, compared to ETH.
By Edris Derakhshi (TradingRage)
The USDT Paired Chart
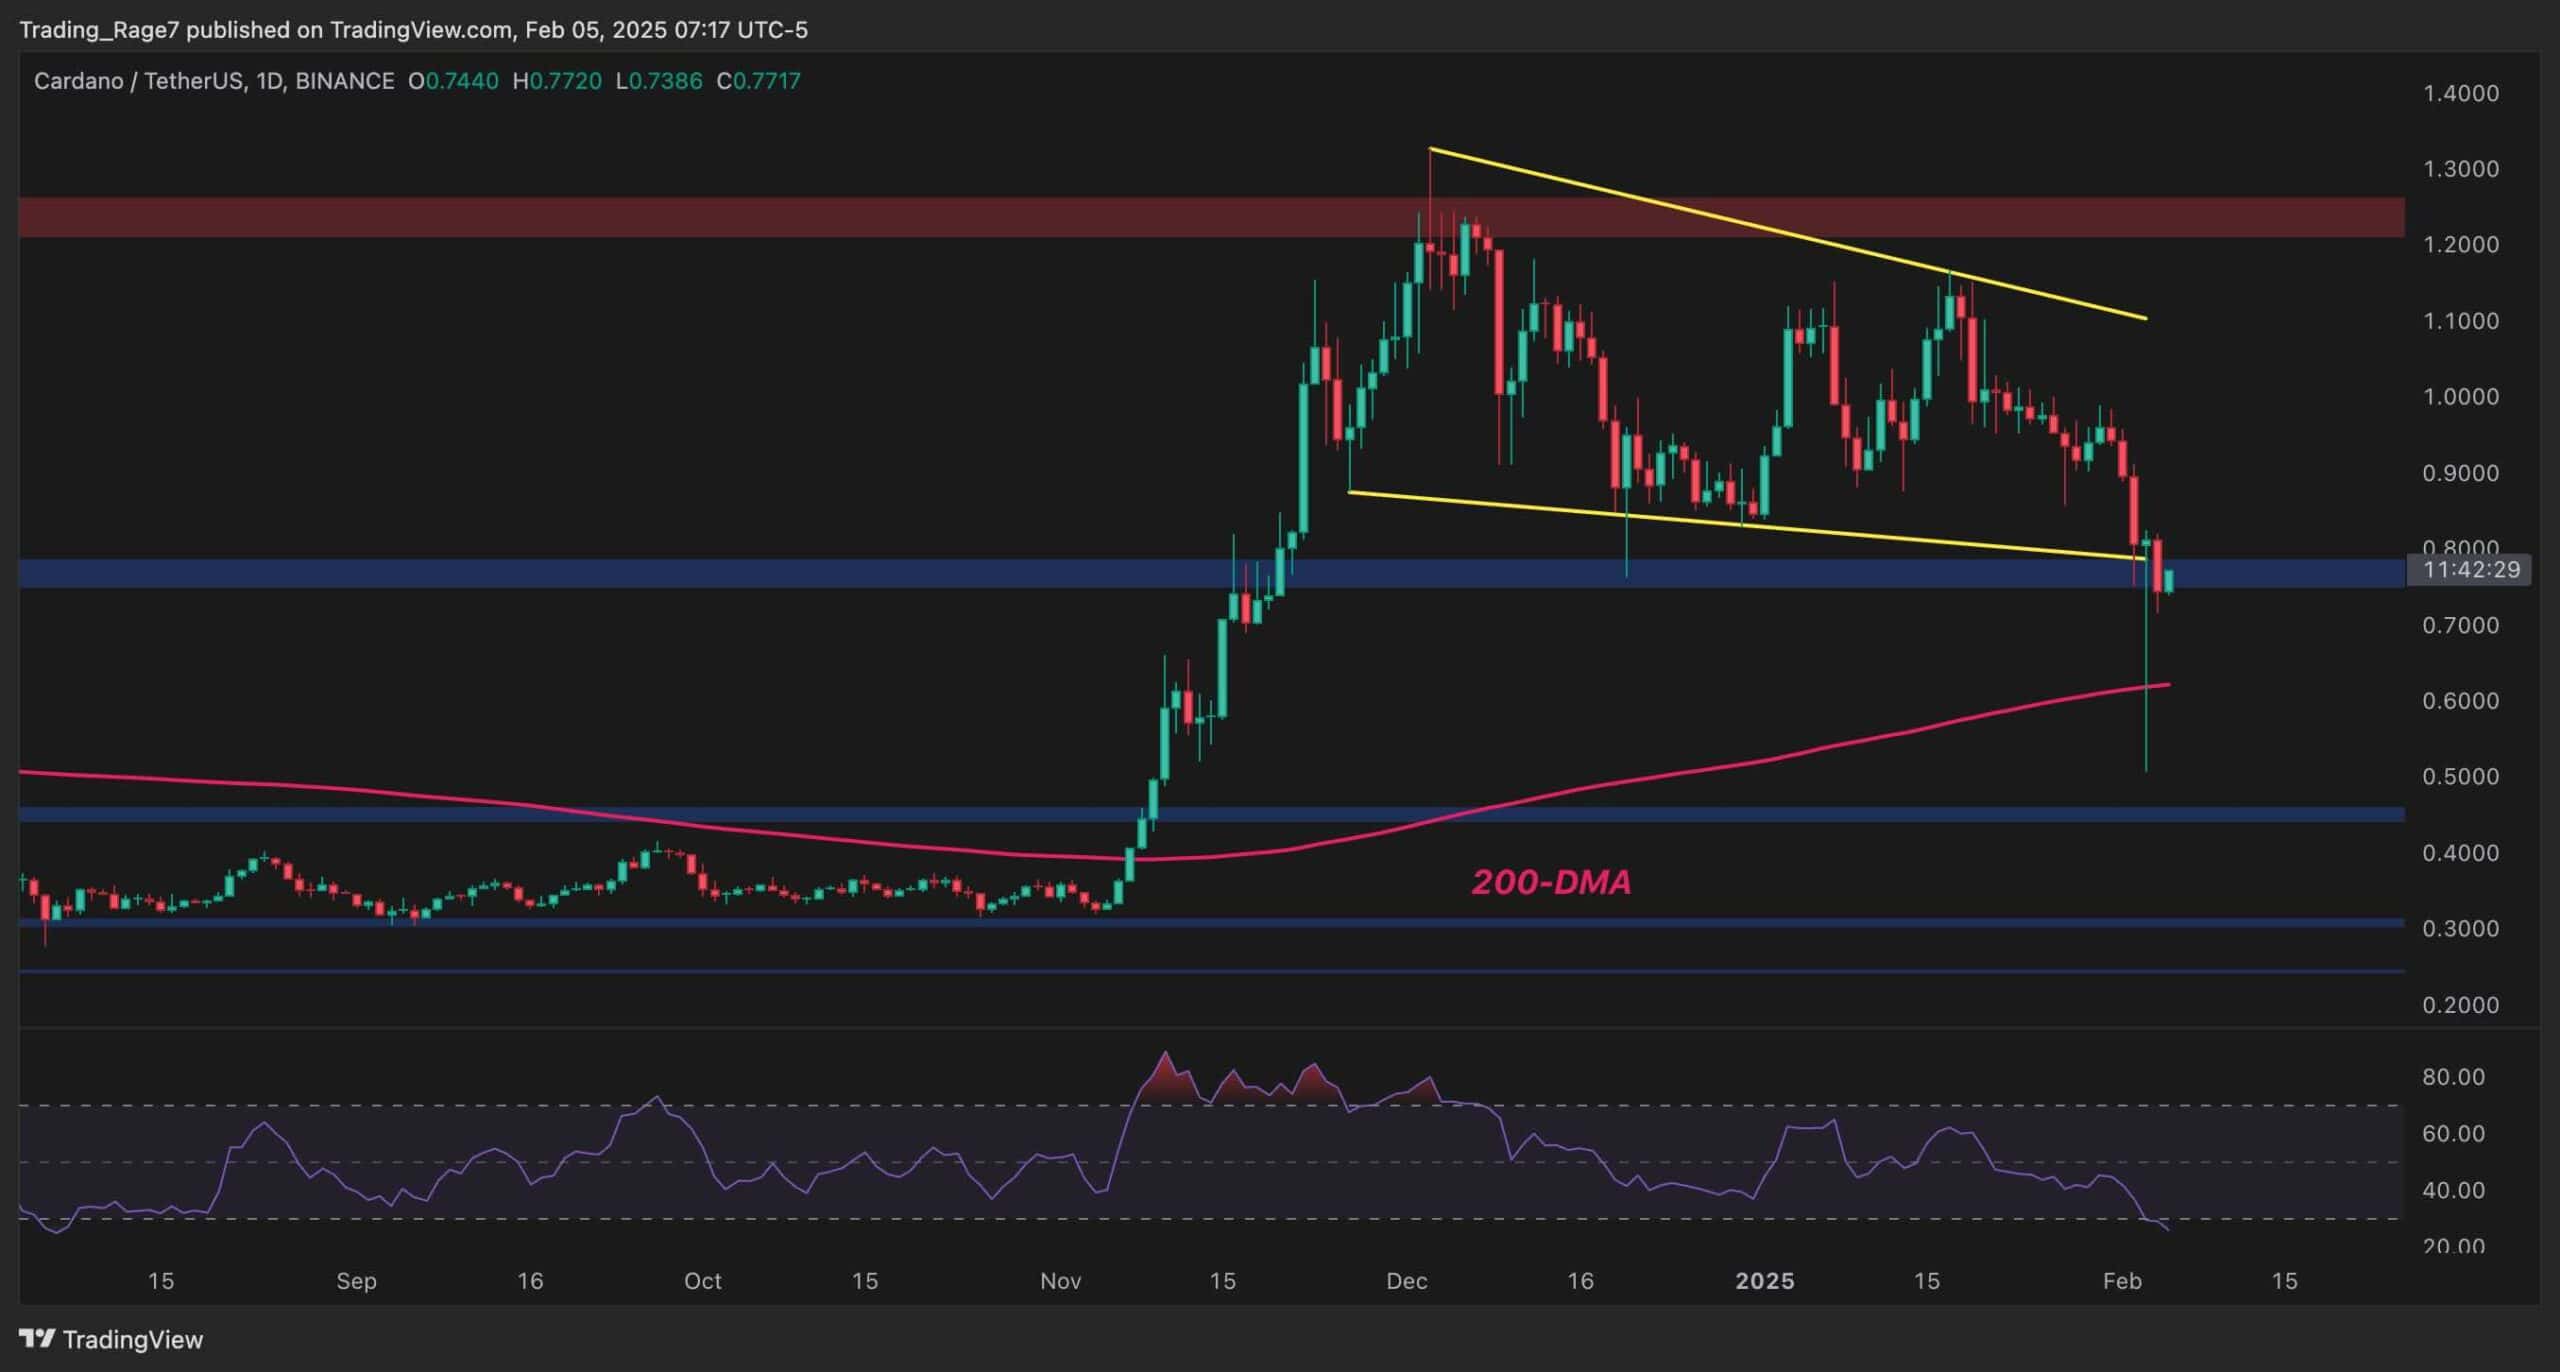
Against USDT, the cryptocurrency has been consolidating between $1.2 and $0.8 over the past few months, forming a large descending channel pattern.
However, it broke down to the downside during the crypto market crash led by Ethereum, and ADA’s price briefly traded below its 200-day moving average, located around the $0.6 mark, before rebounding higher.
Currently, the price is trying to hold above the $0.8 support level, which would be vital if a bullish shift is bound to occur soon.
 Source: TradingView
The BTC Paired Chart
The ADA/BTC chart shows a somewhat similar picture to that of the USDT-paired one. However, ADA is weaker than BTC.
The market has lost a key support level at 900 SAT and is now testing the 200-day moving average, which is located around the 750 SAT level.
In case of a breakdown, a deeper drop toward the 500 SAT area would be imminent. However, as the RSI is showing a clear oversold signal, a pullback toward the 900 SAT level looks more likely at the moment.
 Source: TradingView
The post Cardano Price Analysis: Can ADA Crash Below $0.7 This Week? appeared first on CryptoPotato.


 English (US) ·