Feb 08, 2025 at 09:22 // Price
The price of Cardano (ADA) has pulled back to the previous range after ending its decline above the $0.50 support.
Long-term forecast for the Cardano price: bearish
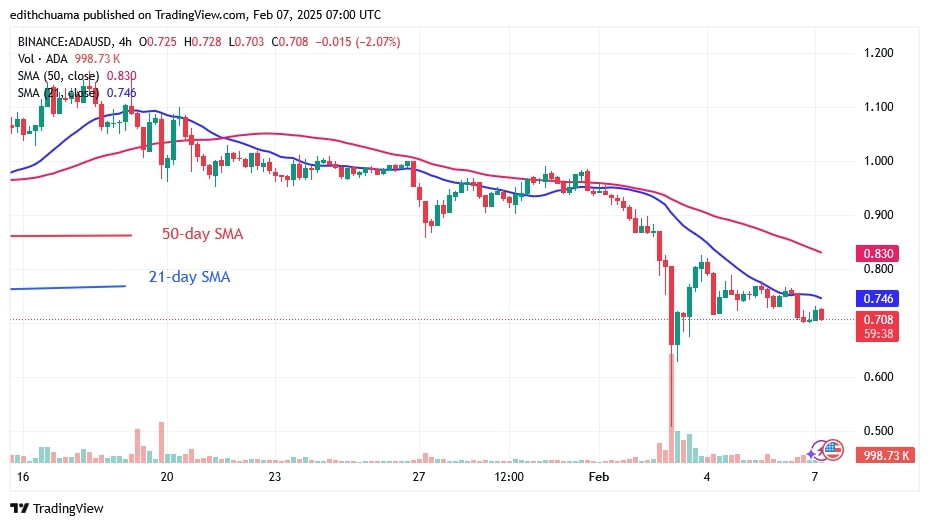
The resistance of $0.80 resisted the pullback. Cardano has been trading in a range between $0.80 and $1.20 since December 20, 2024.
On the upside, ADA price has fallen as it failed to break above the $0.80 resistance. It is now trading below the $0.80 barrier and above the $0.50 support in a small range. If the current support is broken, the price of ADA will fall back to its previous low of $0.50.
Analysis of the Cardano indicators
The long candlestick tail of Cardano on February 3 points to the $0.50 support. The extended candlestick tail suggests strong buying pressure at the $0.50 support. The 21-day SMA is below the 50-day SMA, indicating a bearish bias, and the moving average lines are sloping horizontally.
Technical Indicators
Key Resistance Zones: $1.20, $1.30, and $1.40
Key Support Zones: $0.90, $0.80, and $0.70
What is the next move for Cardano?
According to Coinidol.com, on the 4-hour chart, Cardano is moving sideways after the February 3 drop. The cryptocurrency is bouncing below the moving average lines and above the $0.65 support. The 21-day SMA resistance has hindered the upside moves. The use of doji candlesticks has limited price volatility.

Disclaimer. This analysis and forecast are the personal opinions of the author. They are not a recommendation to buy or sell cryptocurrency and should not be viewed as an endorsement by Coin Idol. Readers should do their research before investing in funds.

 8 months ago
53


 English (US) ·