
 3 hours ago
8
3 hours ago
8

As of August 6, 2026, ADA sits at $0.19, caught between a daily chart building constructive momentum and shorter timeframes losing conviction, making Cardano price today a study in conflicting signals that traders need to decode before committing to either side.
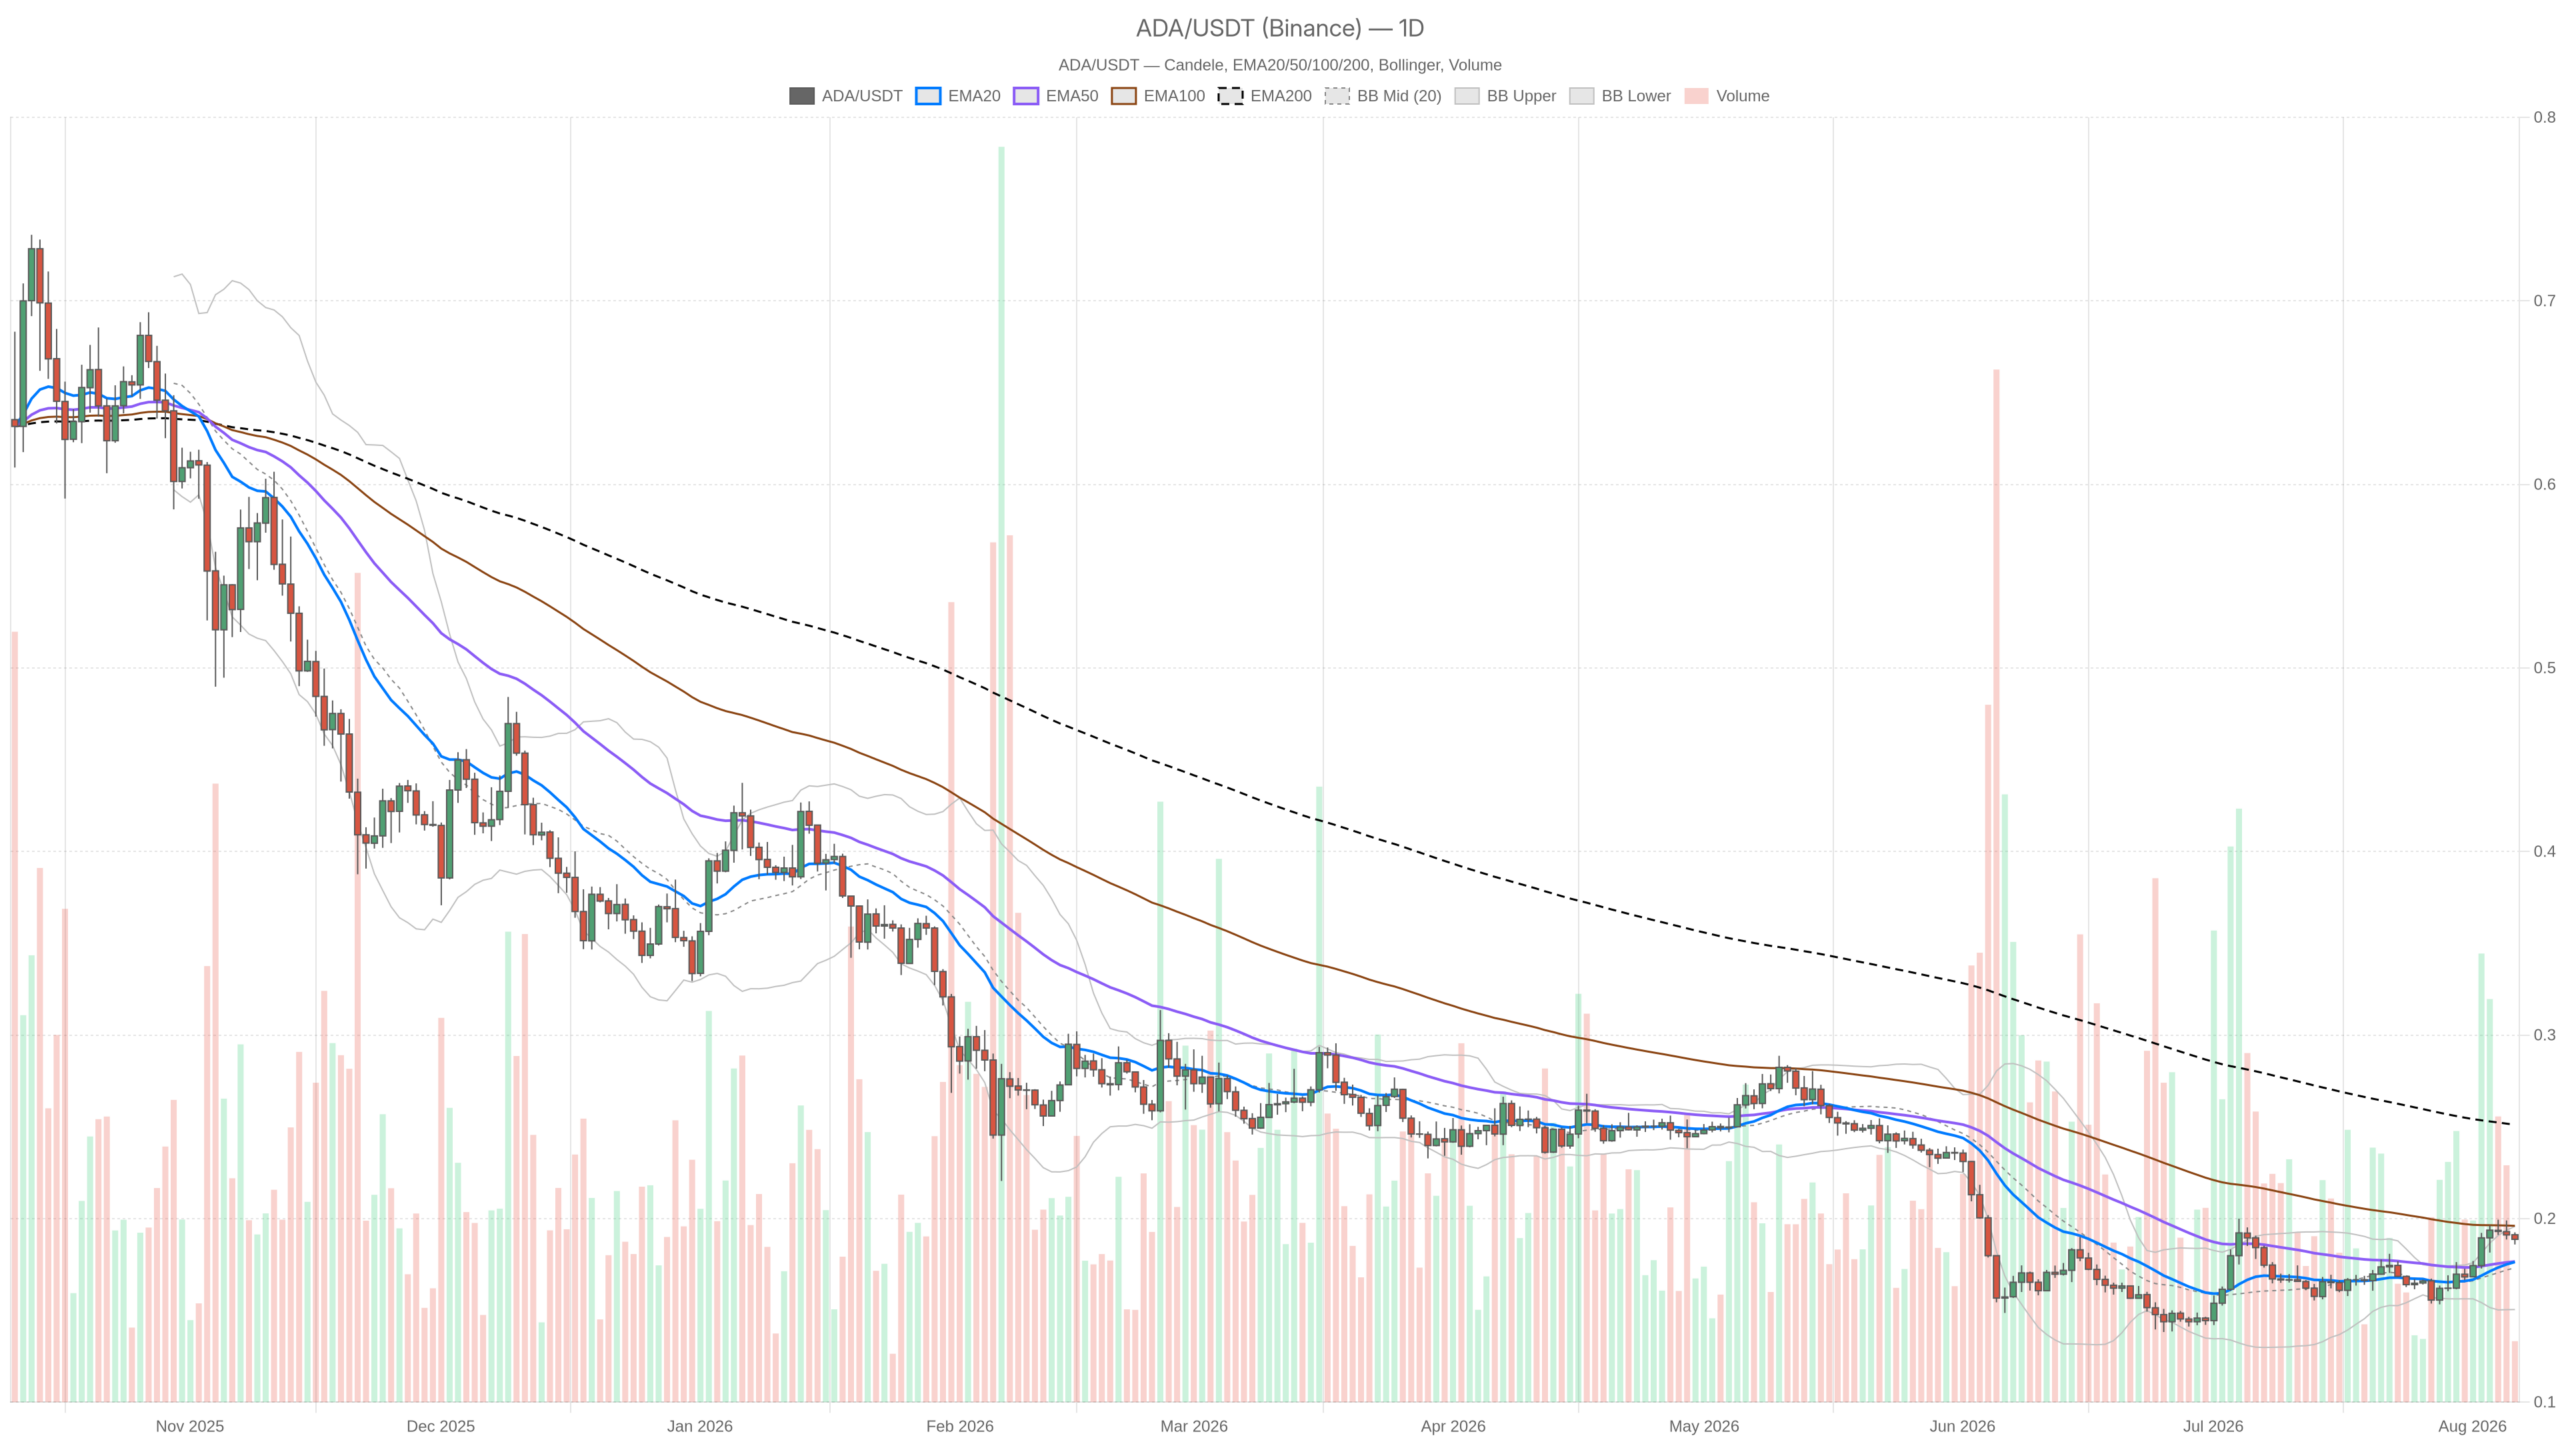 ADA/USDT — daily chart with candlesticks, EMA20/EMA50 and volume.
Key takeaways
- ADA holds $0.19 on August 6, 2026, sitting above the daily EMA20 and EMA50 cluster at $0.18
- The Fear & Greed Index at 25 signals Extreme Fear, while Bitcoin dominance at 56.71% keeps liquidity concentrated in BTC
- Daily RSI14 at 62.56 confirms near-term bullish momentum, but the EMA200 at $0.25 remains far overhead
- Cardano DeFi fees are declining sharply: Minswap down 45% weekly, SundaeSwap V2 down 65%
- The clash between constructive daily structure and bearish intraday signals creates a high-uncertainty trading environment
Daily Chart: Cautiously Constructive, But Still Under the Long-Term Ceiling
The daily chart presents a cautiously constructive picture. ADA closed at $0.19, sitting above both the EMA20 and EMA50, which are stacked together at $0.18. That is a short-term positive — price has reclaimed the near-term moving averages and is holding above them rather than chopping underneath. However, the EMA200 sits at $0.25, meaning the broader downtrend structure has not actually been repaired. What we are seeing looks more like a recovery attempt inside a bigger bearish framework than a confirmed trend reversal.
Daily RSI14 at 62.56 backs up the near-term bullish read — it sits comfortably above the 50 midline, pushing toward overbought without being extreme yet. This tells you buyers have had the upper hand recently. MACD on the daily is technically positive too, with the line at 0.01 above a flat signal line near zero. However, the histogram sitting at essentially zero is the tell: momentum is present but not accelerating.
The daily Bollinger Bands add useful context: mid-band at $0.17, upper band at $0.20, lower band at $0.15. Price at $0.19 is riding close to the upper band, which usually means the move has already stretched itself. ATR14 on the daily is a tight 0.01, confirming this is a low-volatility environment rather than a violent trending one. Pivot levels — PP, R1, and S1 all clustering around $0.19 — confirm price is sitting at equilibrium, offering no directional lean from that calculation alone.
1H and 15m: Where the Daily Optimism Starts to Wobble
Zoom into the 1-hour chart, however, and the picture gets murkier. RSI14 drops to 42.77 — below the midline, which is a meaningfully different read than the daily’s 62.56. EMAs on the 1H are essentially glued together at $0.19 across the 20 and 50, with the 200 just below at $0.18. That means there is no real intraday trend to speak of, just compression. MACD is flat. This is a market pausing, not pushing.
Drop down to the 15-minute chart and the regime flips to outright bearish. RSI14 at 45.93 is soft, and while the EMAs are all bunched at $0.19 with no separation, the bearish tag on this timeframe tells you sellers have the edge in the immediate execution window. That is a real disagreement across timeframes, not a minor nuance. Anyone trading off the daily bias alone could get chopped up by intraday selling pressure before the bigger picture has a chance to play out.
Bullish Scenario
The bullish case depends on ADA holding the $0.18 EMA cluster and clearing $0.20 with real volume. If that happens, the door opens toward a retest of the EMA200 near $0.25 — a level that would need to be reclaimed to change the broader trend narrative. This scenario gets invalidated quickly if price fails to hold above the $0.18 EMA cluster on a daily close. Losing that zone would hand momentum straight back to sellers and confirm the bounce was just noise inside the larger downtrend.
Bearish Scenario
The bearish case, meanwhile, centers on the multi-timeframe tension itself. With the 1H RSI under 50 and the 15m regime already flagged bearish, there is a real risk that intraday selling drags the daily chart back down before bulls get a chance to test $0.20. A daily close back below the $0.18 EMA20/EMA50 zone, especially with RSI rolling back under 50, would confirm the long-term EMA200 gap at $0.25 is simply too wide to close right now. Extreme Fear sentiment across the broader market would then be winning out over localized daily strength.
On-Chain Backdrop: Cardano DeFi Activity Is Cooling
Beyond the charts, the Cardano DeFi ecosystem is sending a cautionary signal of its own. According to DefiLlama figures, Minswap DEX — the largest fee generator in the dataset — saw fees drop 24.83% in a single day and 45.09% over seven days. SundaeSwap V2 fell even harder, down 57.22% daily and 65.34% weekly, while WingRiders dropped 16.18% daily and 49.41% weekly. Splash Protocol also declined, down 15.89% daily and 13% over the week.
The one outlier is Dano Finance, which posted a startling 594.81% jump in weekly fees and 407.14% over 30 days. However, given its much smaller scale relative to Minswap or SundaeSwap, that spike does not offset the broader pullback in on-chain activity across the network’s major DEXs. A shrinking fee base across most platforms suggests real usage is softening. That matters for anyone trying to gauge whether current price action reflects genuine demand or just short-term positioning.
Where This Leaves Traders
Cardano price today is a study in conflicting signals. A daily chart sits technically above its short-term averages with decent RSI, yet the long-term EMA200 remains far overhead. The hourly chart is essentially flat, and the 15-minute chart is already leaning bearish. Add Extreme Fear sentiment and cooling DeFi fee activity into the mix, and you have a market that could go either way depending on which timeframe ends up dictating the next move.
Volatility on the daily is currently low, per the ATR reading, which means the eventual breakout — whichever direction it comes — could arrive with more force than recent price action suggests. Anyone watching this setup should pay close attention to whether the $0.18 EMA zone holds and whether the 1H RSI can reclaim 50. Those are the pressure points that will likely decide which scenario actually plays out. This is a market that demands patience over conviction right now, and position sizing that respects just how uncertain the next leg genuinely is.
FAQ
What is Cardano’s price today and what are the key levels to watch?
As of August 6, 2026, ADA is trading at $0.19. The key support level to watch is the $0.18 EMA20/EMA50 cluster — a daily close below that zone would invalidate the bullish case. On the upside, the immediate resistance sits at the upper Bollinger Band around $0.20, with the major structural target being the EMA200 at $0.25.
Is Cardano’s daily chart bullish or bearish right now?
The daily chart is cautiously constructive but not outright bullish. ADA holds above the EMA20 and EMA50 at $0.18, and the RSI14 at 62.56 shows buyers have had the upper hand. However, price remains well below the EMA200 at $0.25, meaning the broader downtrend has not been reversed. The setup looks more like a recovery attempt inside a bearish framework than a confirmed trend change.
What does the decline in Cardano DeFi fees mean for ADA’s price?
The sharp drop in DeFi fees across major Cardano DEXs — including Minswap down 45% weekly and SundaeSwap V2 down 65% — suggests real on-chain usage is softening. A shrinking fee base weakens the fundamental demand narrative and raises questions about whether current price action is driven by genuine activity or short-term positioning. This on-chain cooling adds a layer of caution to the technical picture.
Disclaimer: This article is for informational purposes only and does not constitute financial advice, an investment recommendation, or a solicitation to buy or sell any financial instrument or cryptocurrency. The analysis provided is not indicative of future results. Investing in crypto assets and financial markets carries a high risk of capital loss. Always do your own research (DYOR) and consult a qualified financial advisor before making any decision.
Article produced with the assistance of artificial intelligence and reviewed by the editorial team.





 English (US) ·