
 2 months ago
27
2 months ago
27

In a fragile risk-off environment dominated by Bitcoin and extreme fear, Chainlink crypto today trades under pressure but has not yet broken its key supports.
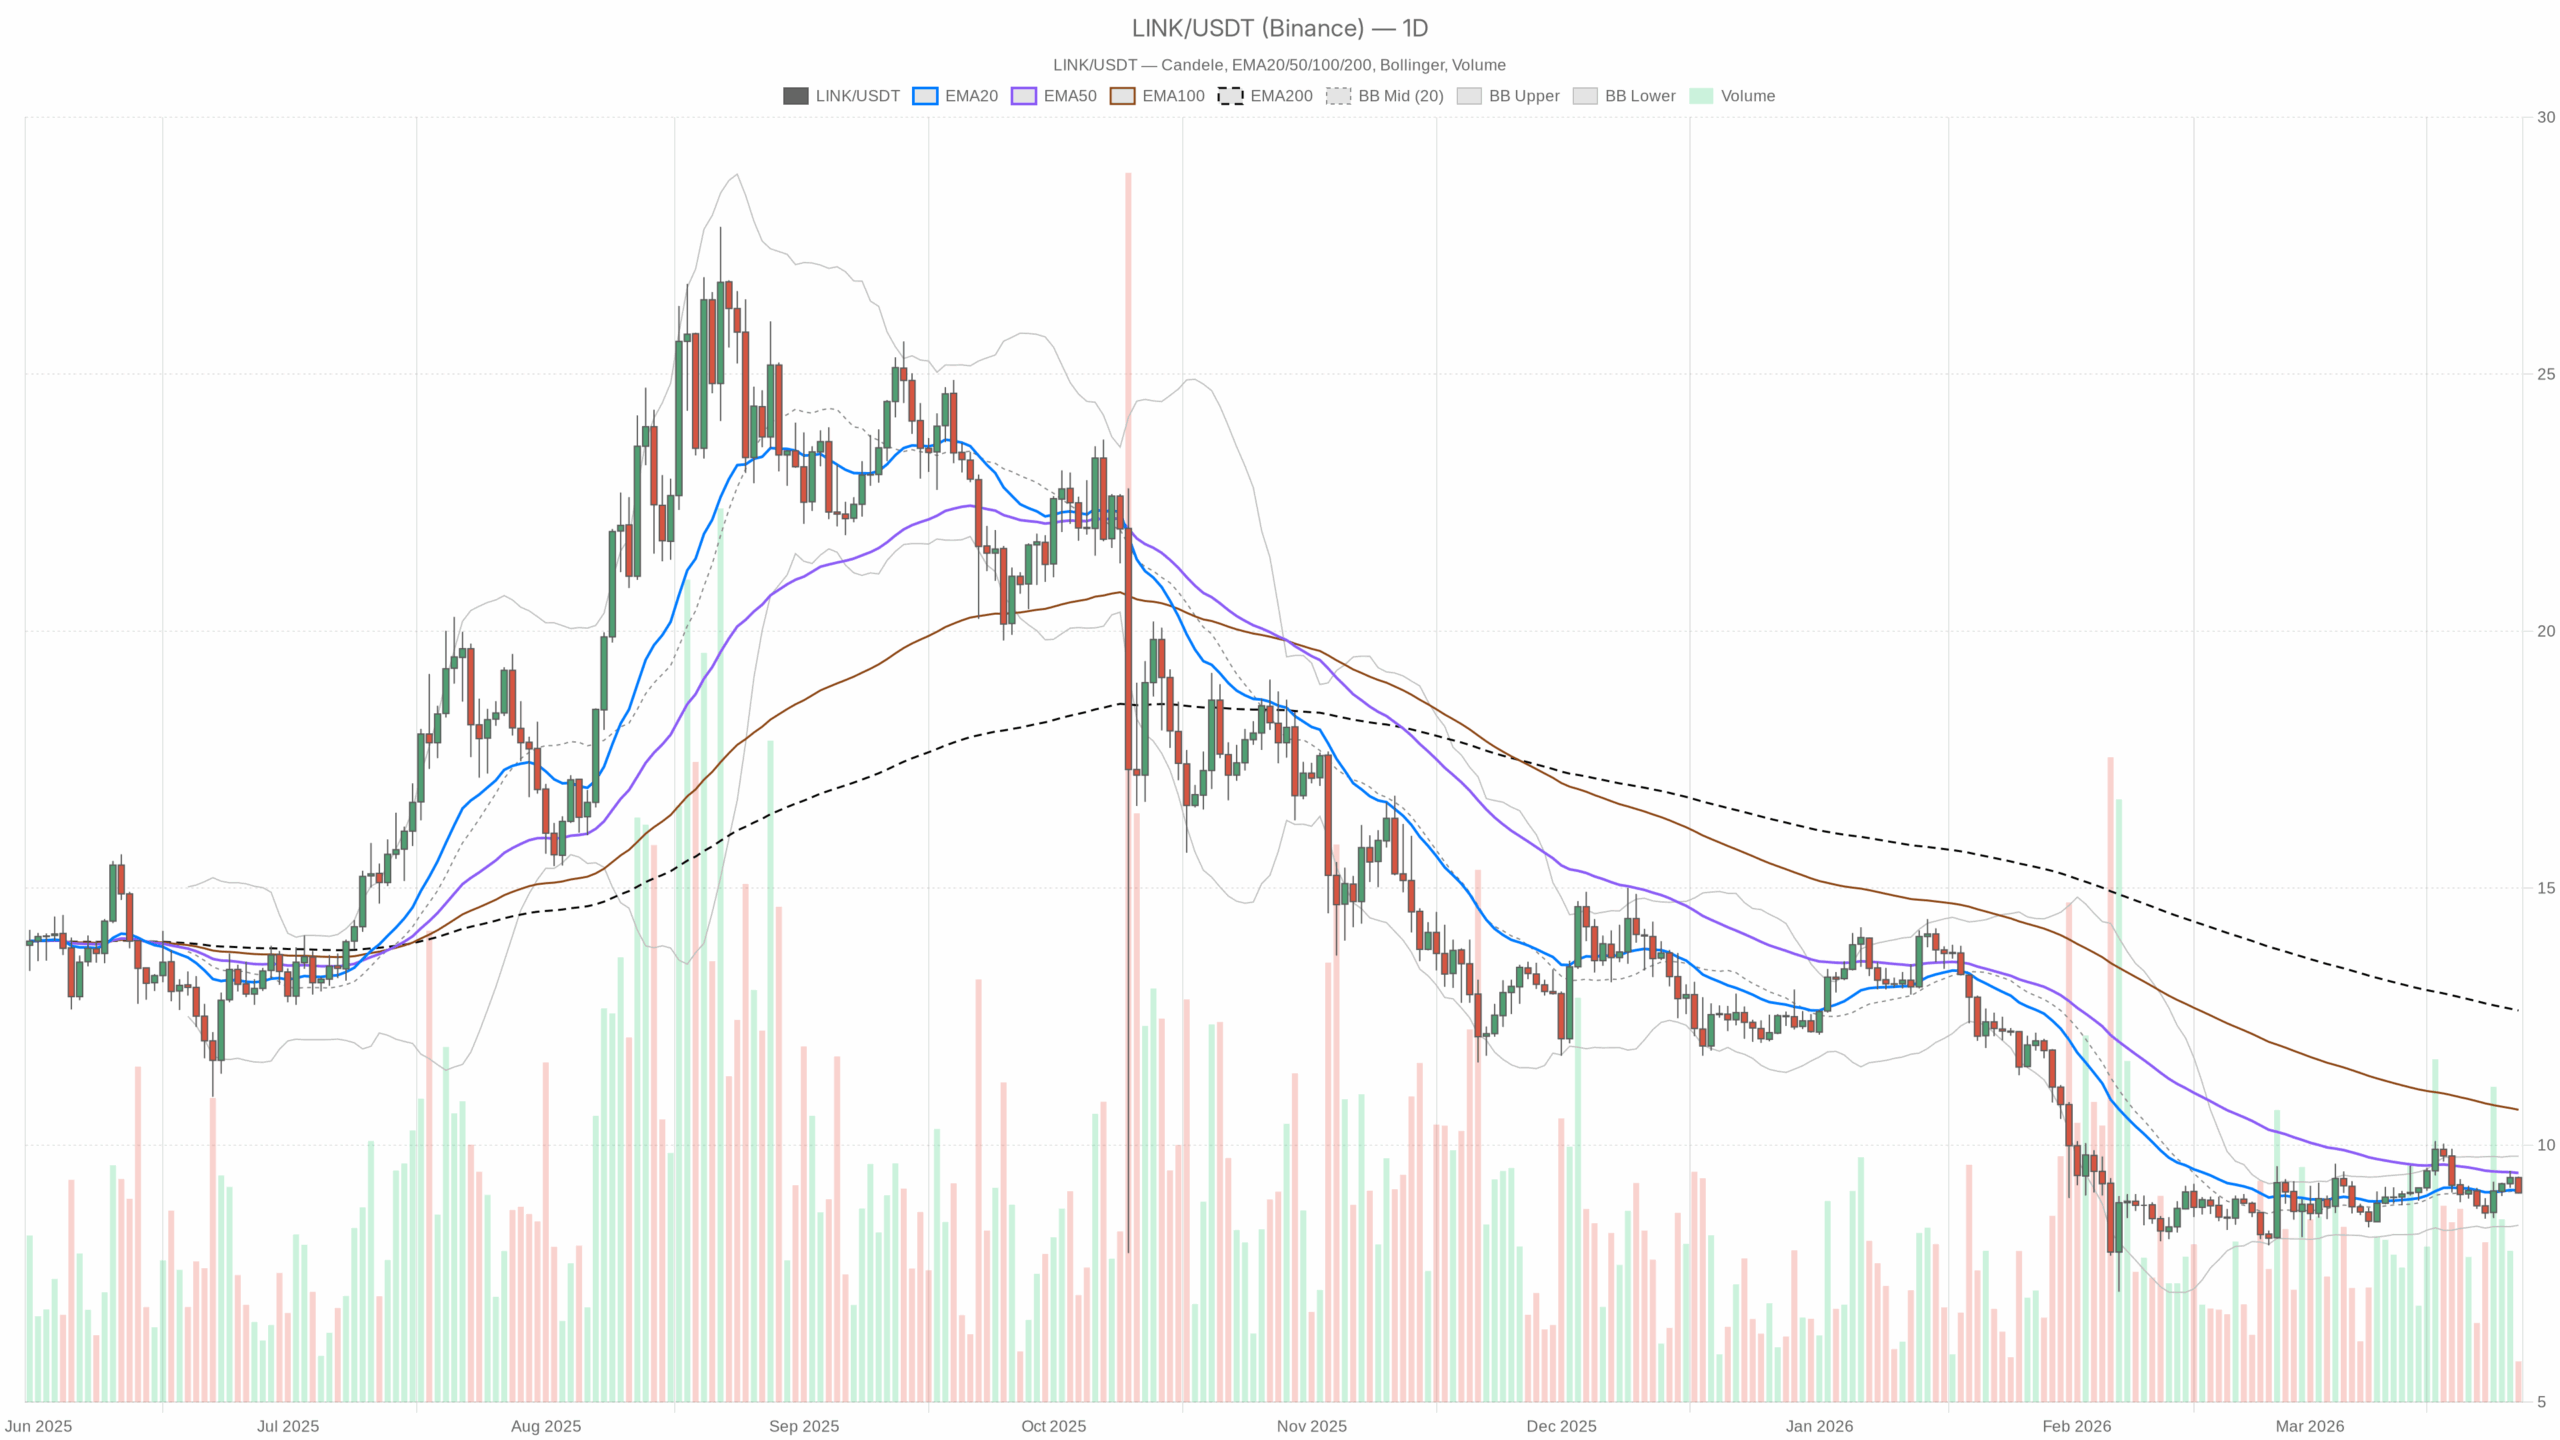 LINK/USDT — daily chart with candlesticks, EMA20/EMA50 and volume.
Market Thesis: Heavy Macro, Tired Altcoins, LINK Sitting on the Edge
Chainlink (LINK) is trading around $9.07 in a market that is leaning risk-off: total crypto cap is down about 1.8% in 24 hours, BTC dominance is high at ~56.5%, and the fear & greed index is stuck in Extreme Fear (10). This is not an environment where altcoins get the benefit of the doubt.
On the higher timeframe, LINK is in a broadly bearish regime but not in free fall. Price is compressed just under short-term averages and well below the 200-day, showing a market that has already repriced lower and is now deciding whether this is a base or a staging area for another leg down. The daily chart defines the main scenario: bias is mildly bearish / defensive unless bulls can quickly reclaim nearby resistance.
Daily Timeframe (D1): Structure Still Bearish, but Momentum Flat
The daily is our anchor for the main scenario, and it is sending a clear message: trend remains damaged, but the immediate selling pressure is not extreme.
Trend & Moving Averages (EMA20 / EMA50 / EMA200)
- Price (close): $9.07
- EMA20: $9.12
- EMA50: $9.46
- EMA200: $12.62
LINK is trading just below the 20‑day EMA and clearly below the 50‑day and 200‑day. That is classic bearish structure: long-term trend is down, and short-term momentum has been unable to flip the picture. Price being only a few cents under the 20‑day tells you bears are in control, but not with conviction. This is more of a grind than a collapse. For now, rallies into the $9.10–9.50 area are more likely to meet supply than spark a sustainable breakout.
RSI (14)
- RSI14: 48.89
The daily RSI is sitting just under 50, which aligns with a neutral-to-slightly-bearish momentum backdrop. LINK is not oversold or overbought on the daily; it is in the middle of the range, which fits with a market that has already absorbed a good part of the selloff and is now waiting for a new catalyst. This leaves room for a move in either direction without needing a reset.
MACD
- MACD line: 0.01
- Signal: 0.00
- Histogram: 0.01
Daily MACD is slightly positive and the histogram is barely above zero. That is a very mild bullish bias in momentum, but the signal is weak and easily reversible. It tells you downside momentum has cooled from earlier phases of the downtrend, but we do not yet have the kind of strong upside impulse that usually starts a real trend reversal.
Bollinger Bands
- Middle band (20‑day basis): $9.11
- Upper band: $9.78
- Lower band: $8.44
Price is sitting just below the middle band, with bands reasonably wide after prior volatility. Trading near the mid-band while the regime is labeled bearish indicates consolidation inside a downtrend, not a confirmed bottom. There is space for a move toward either $8.44 on the downside or $9.78 on the upside without overstretching volatility.
ATR (Volatility)
- ATR14 (daily): $0.45
A daily ATR of about $0.45 at a $9 handle implies roughly 5% typical daily range. That is moderate volatility by crypto standards. The market is not in panic mode, but it is volatile enough that levels can be tested quickly. Position sizing needs to acknowledge that a normal swing could easily be ±$0.40–0.50.
Daily Pivot Levels
- Pivot point (PP): $9.17
- Resistance 1 (R1): $9.29
- Support 1 (S1): $8.96
Price is currently below the daily pivot at $9.17, leaning toward the support side of the sheet. That aligns with a slight intraday bearish tilt on the higher timeframe. The first support at $8.96 is the near-term line in the sand. Repeatedly losing and failing to reclaim that level would confirm sellers are still dictating the tape.
Daily takeaway: The main scenario for Chainlink Crypto Today is cautiously bearish. The structure is still damaged (well below the 200‑day and 50‑day), while momentum has cooled but not reversed. Bulls need a decisive push back above the 20‑day EMA and daily pivot to change that story.
1-Hour Timeframe (H1): Short-Term Selling Pressure, Early Signs of Exhaustion
The hourly chart shows where the battle is happening right now, and it leans more aggressively bearish, even though the model calls the regime neutral.
Trend & EMAs (H1)
- Price: $9.07
- EMA20: $9.24
- EMA50: $9.23
- EMA200: $9.16
On H1, price is trading below all three key EMAs. The 20 and 50 are sitting just above at $9.23–9.24, and the 200‑hour is also above price at $9.16. This is a clean intraday downtrend structure: rallies into the $9.15–9.25 area are highly likely to encounter sellers until proven otherwise. The neutral regime tag does not reflect the immediate pressure the EMAs are highlighting.
RSI (H1)
- RSI14: 29.94
The hourly RSI is just under 30, which is locally oversold. This does not guarantee a reversal, but it does say the short-term leg lower is getting stretched. In practice, this often leads to one of two outcomes: a relief bounce back toward the EMAs, or a slow bleed down with divergence later. Bears have the upper hand, but the risk of a short-covering bounce is elevated at these levels.
MACD (H1)
- MACD line: -0.05
- Signal: -0.01
- Histogram: -0.04
On the hourly, MACD is bearish and widening, with the line below the signal and a negative histogram. This confirms that the down-move has real momentum behind it, not just a one-candle flush. That sits in tension with the oversold RSI: the trend is down, but it may be nearing the point where shorts become crowded on this timeframe.
Bollinger Bands (H1)
- Middle band: $9.29
- Upper band: $9.52
- Lower band: $9.07
Price is hugging the lower Bollinger Band on H1. That is textbook for a strong intraday downtrend, where price walks the band instead of snapping back immediately. The proximity to the band supports the view that the move is mature but not yet invalidated.
ATR (H1)
- ATR14 (hourly): $0.07
An hourly ATR of $0.07 signals contained but tradable intraday volatility. Moreover, moves of 7–10 cents per hour are normal here, so breaks of nearby levels ($8.96, $9.17) can happen quickly without any unusual news.
Hourly Pivot Levels
- Pivot point (PP): $9.08
- R1: $9.10
- S1: $9.05
Current price at $9.07 is fractionally below the hourly pivot. The very tight bands between $9.05 and $9.10 show a market coiling at the lower end of the range. If price can not reclaim the $9.08–9.10 pocket, intraday flows are likely to keep leaning short. A move back above R1 would be the first sign that the oversold RSI is starting to matter.
Hourly takeaway: The H1 chart reinforces the short-term bearish pressure but also flags that the current push lower is getting tired. Bears are winning, but they are pressing an already stretched move.
15-Minute Timeframe (M15): Execution Context, Selling but Stalling
The 15-minute view is where entries and exits are typically refined. It broadly agrees with H1 but with even more pronounced exhaustion signs.
Trend & EMAs (M15)
- Price: $9.07
- EMA20: $9.14
- EMA50: $9.22
- EMA200: $9.23
Price is below all key EMAs on M15, with the 20‑EMA acting as immediate dynamic resistance around $9.14. This is a clean short-term downtrend. The 50 and 200 compressed around $9.22–9.23 tell you this area is a heavier resistance zone. If price ever makes it back there, that is where intraday bias really gets tested.
RSI (M15)
- RSI14: 28.04
M15 RSI is under 30, confirming short-term oversold conditions. Together with the H1 RSI, this says the current drop is late in its intraday cycle. It does not mean price can not go lower, but continuation shorts opened down here are taking on higher timing risk.
MACD (M15)
- MACD line: -0.06
- Signal: -0.06
- Histogram: 0.00
MACD on M15 has the line and signal basically on top of each other, with a flat histogram. That is often what you see when a short-term move is losing momentum and the market is pausing. Selling pressure is not accelerating anymore; bears are pushing, but they are not gaining additional traction in the last few candles.
Bollinger Bands (M15)
- Middle band: $9.14
- Upper band: $9.27
- Lower band: $9.01
Price is sitting closer to the lower band, but not breaking decisively through it. Combined with a flat MACD and oversold RSI, the 15-minute chart suggests a market that is leaning down but starting to stabilize in the short term.
ATR (M15)
- ATR14 (15m): $0.04
A 4-cent ATR on 15m bars means micro-swings are small but frequent. Scalpers can expect quick but contained noise, which matters when setting tight stops or short-term targets around the $9 handle.
15-Minute Pivot Levels
- Pivot point (PP): $9.07
- R1: $9.08
- S1: $9.06
Price is effectively on top of the 15m pivot. This reflects a brief equilibrium after selling, a pause, not yet a reversal. A sustained push above $9.08–9.10 would start to flip microstructure more neutral, while steady trading below $9.06 would keep the door open for a grind toward the lower daily band near $8.44 over time.
15m takeaway: Intraday execution context is bearish but late. New shorts here carry poor reward-to-risk unless they are very tactical, while countertrend longs would be fighting the higher timeframe trend.
Bullish Scenario for Chainlink Crypto Today
For bulls, the path is narrower but not closed. The bullish case is about turning this oversold intraday pressure into a proper daily reclaim.
What Bulls Need to See
On the daily, the first job for buyers is to regain and hold the 20‑day EMA and the daily pivot:
- A sustained move back above $9.17 (daily PP) and into the $9.20–9.25 zone, flipping the short-term EMAs on H1 and M15 from resistance to support.
- Follow-through toward $9.29 (daily R1), which would show that the bounce is more than just short covering.
- Daily RSI pushing convincingly above 50 and MACD widening to the upside, confirming a shift from neutral to positive momentum.
Under that script, the next logical upside reference becomes the $9.50–9.80 band (around EMA50 and the upper third of the Bollinger channel). That is where a lot of trapped recent longs likely sit, so you would expect supply to kick in there.
What Would Invalidate the Bullish Scenario
The bullish scenario weakens or fails if:
- Price fails repeatedly at $9.20–9.30 and can not close a day above the 20‑day EMA.
- H1 RSI resets higher from oversold but price barely moves, then rolls back over, a sign of weak demand.
- The broader market remains in extreme fear with falling total market cap, keeping risk appetite too low to sustain an altcoin bounce.
A decisive daily close back under $8.96 after any bounce attempt would be a clear sign the bullish attempt has failed and sellers are back in control.
Bearish Scenario for Chainlink Crypto Today
The bearish side currently has the structural advantage: long-term downtrend, daily regime flagged as bearish, and intraday charts aligned with downside momentum.
What Bears Want to See
A clean bearish continuation would look like this:
- Price stays pinned below the H1 and M15 EMAs (especially under $9.14–9.24) on any short-lived bounces.
- H1 RSI moves out of oversold territory not by price bouncing hard, but by time correction (sideways consolidation), then rolls back down with fresh lows.
- MACD on H1 and M15 turns back down after a weak bounce, showing renewed selling pressure.
- The daily candle closes below $8.96 (S1) and starts targeting the lower Bollinger Band region toward $8.44.
Given the macro context (high BTC dominance, extreme fear, shrinking total market cap), the market is currently more willing to punish altcoins than reward them. In that environment, LINK can easily underperform if sellers stay active.
What Would Invalidate the Bearish Scenario
The bearish setup is challenged if:
- Price reclaims and holds above the 20‑day EMA near $9.12–9.20 and then converts that zone into support.
- We see a strong intraday rally where H1 RSI moves from sub‑30 to 50+ with price breaking back above the 200‑hour EMA at $9.16 and holding it.
- Daily MACD starts to expand positively rather than hover flat, signaling a genuine momentum shift.
If LINK can close multiple sessions above $9.50, the current bearish narrative on the daily would be seriously weakened and the focus would shift toward a larger basing or reversal pattern.
Positioning, Risk and Uncertainty
Chainlink Crypto Today sits in a structurally bearish but tactically stretched spot. Higher timeframes point down, but lower timeframes are oversold and losing downside acceleration. That mix usually favors patience over aggression. Chasing fresh shorts late in the move carries poor timing risk, while countertrend longs are swimming against a downtrend and a fragile macro backdrop.
Volatility is moderate across timeframes (daily ATR around 5%, intraday ATRs in the low single digits), meaning levels can be tested quickly but the market is not in an outright capitulation regime. In this kind of tape, clarity often comes when either the daily 20‑EMA is convincingly reclaimed or the lower Bollinger Band is tagged and either defended or broken.
For now, LINK is neither breaking down nor breaking out; it is leaning lower inside an uncertain macro environment where extreme fear dominates sentiment and BTC is soaking up most of the attention. Any positioning around LINK should respect that uncertainty: define levels that would prove you wrong, assume more noise around $9, and do not expect the market to reward stubborn directional bets without clear confirmation on the daily chart.


 English (US) ·