
 3 weeks ago
52
3 weeks ago
52

Cleveland Cliffs Inc. stock surged on July 23, closing at $11.06 after hitting a session high of $11.46 on Q2 2026 earnings. The company beat estimates by +4.76% on EPS and +1.88% on revenue, yet still posted a net loss — creating a contested technical picture.
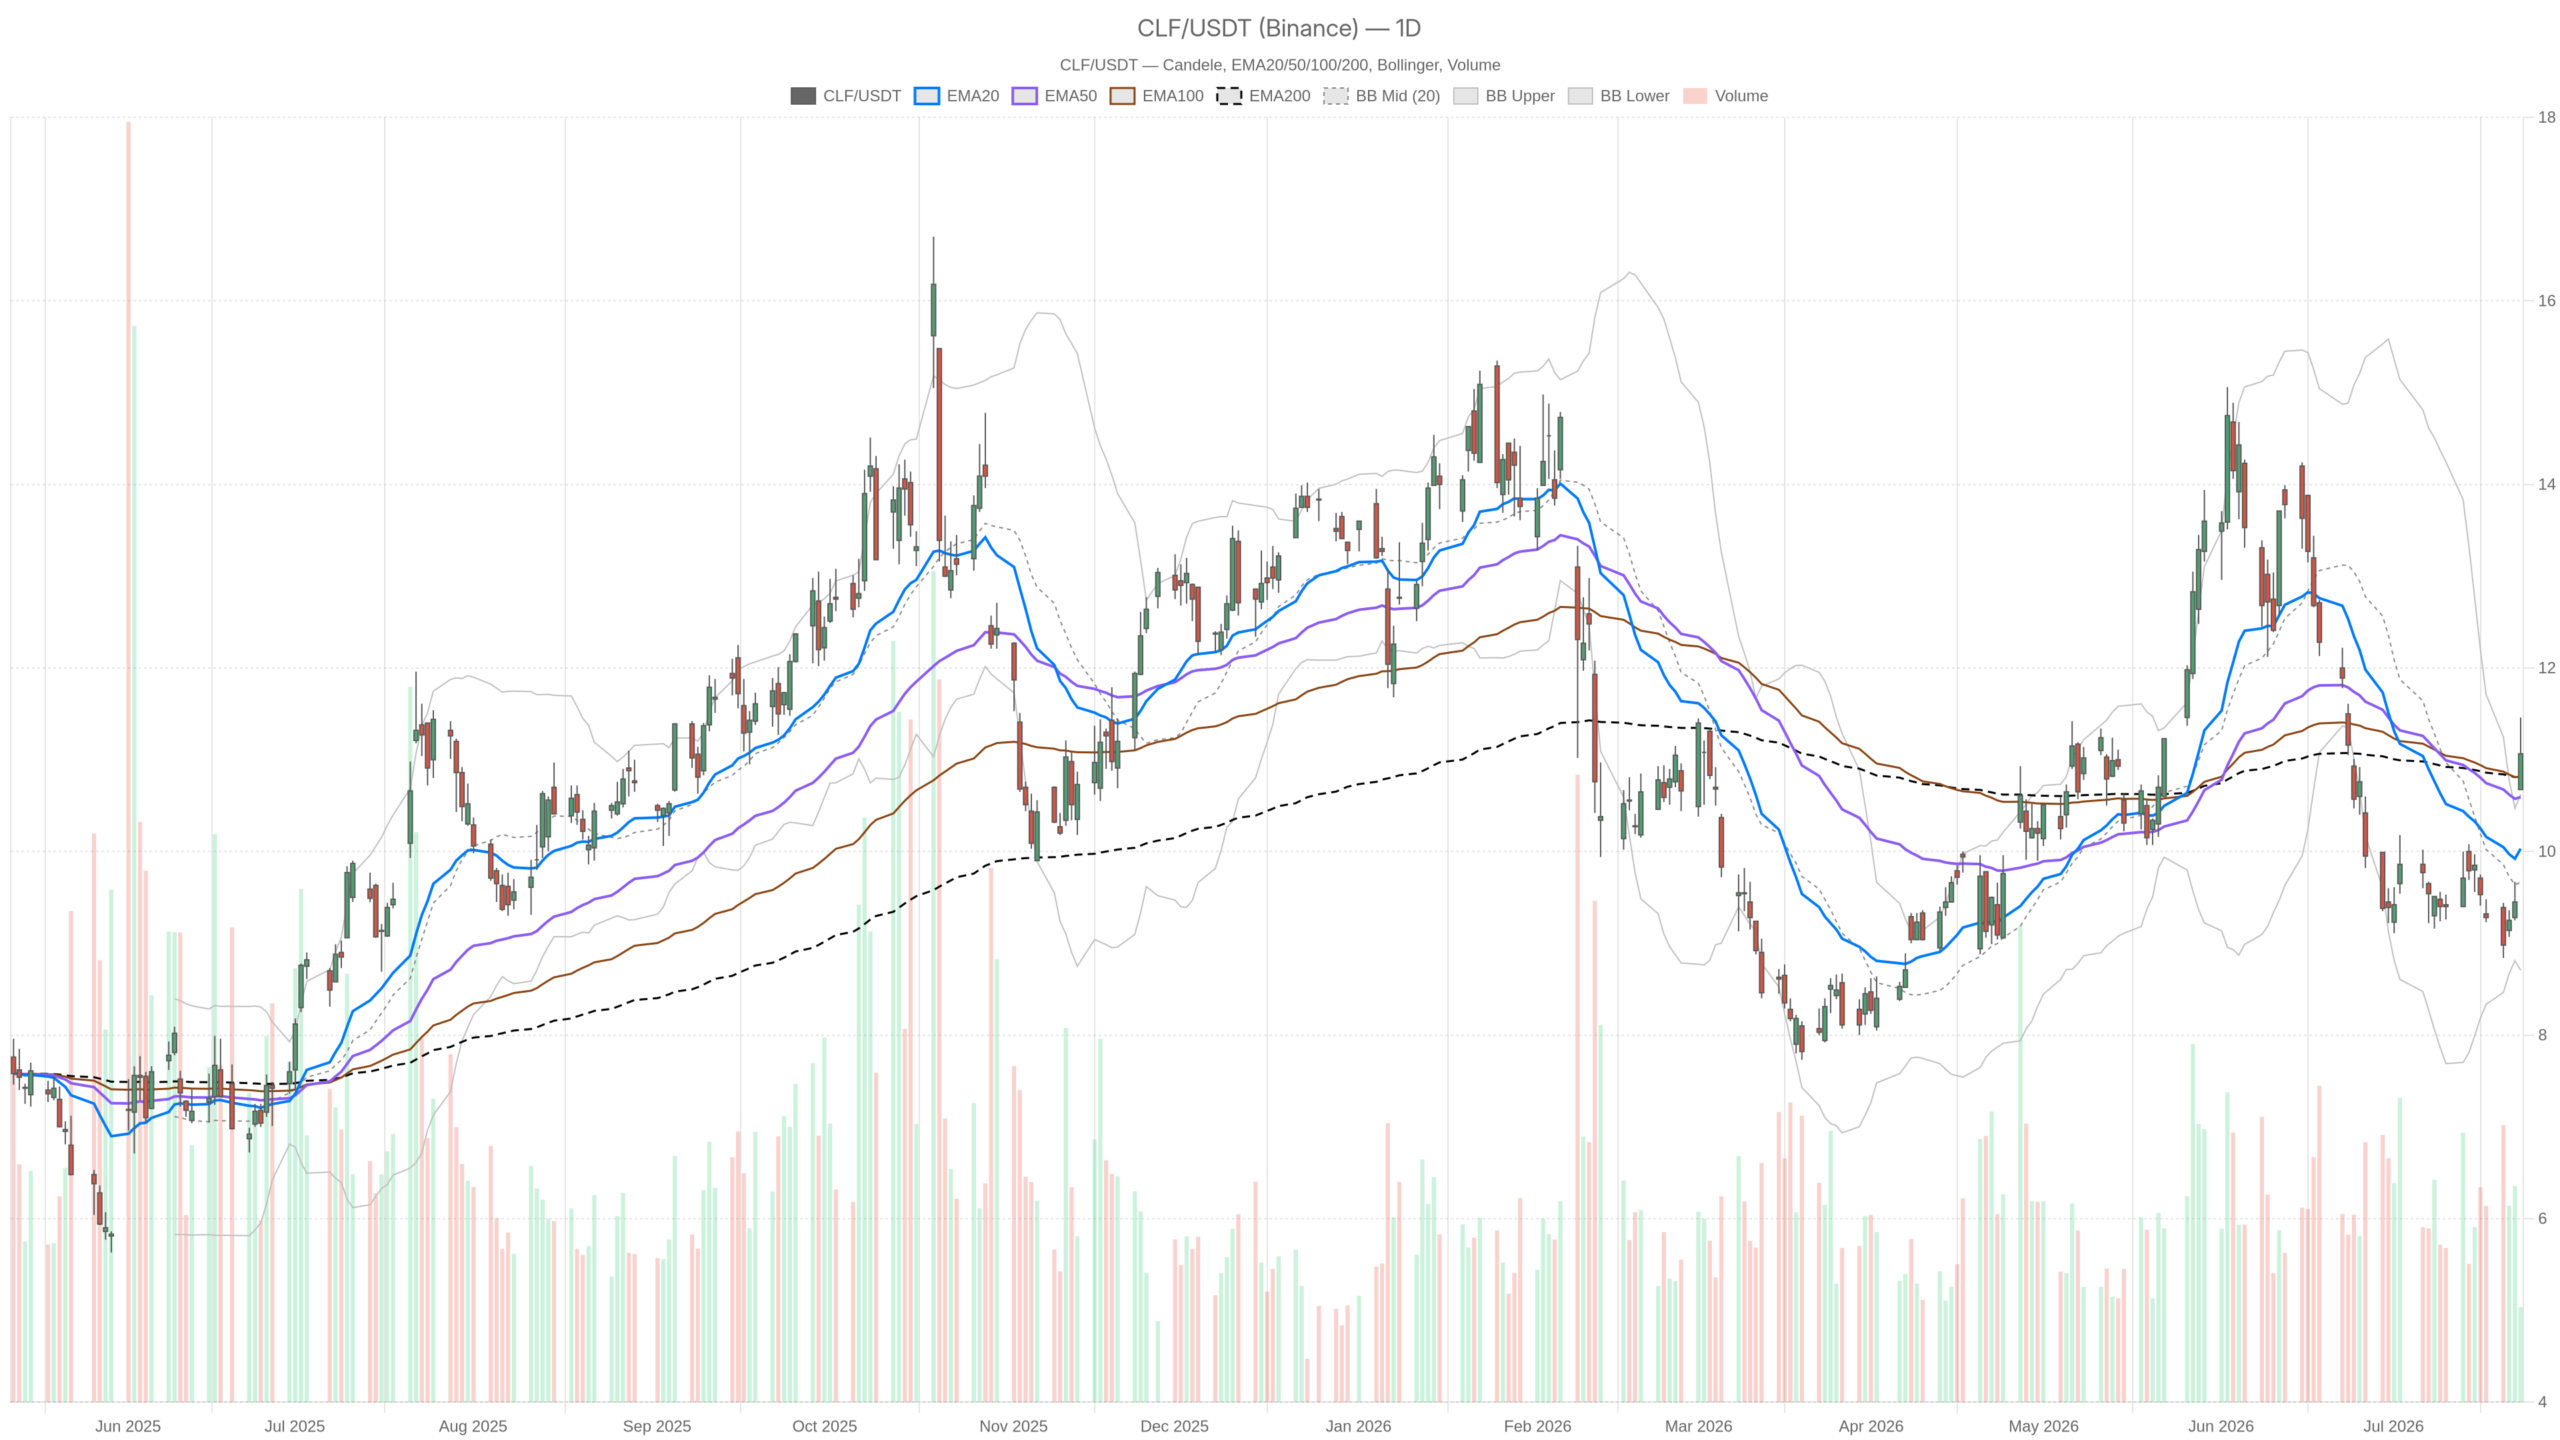 CLF — daily chart with candlesticks, EMA20/EMA50 and volume.
Key takeaways
- Cleveland Cliffs Inc. stock closed at $11.06, breaking above both the EMA50 ($10.59) and EMA200 ($10.81) for the first time in the recent range.
- Q2 earnings beat estimates by +4.76% on EPS and +1.88% on revenue, despite the company reporting a net loss.
- The daily MACD histogram flipped positive at +0.15, signaling decelerating bearish momentum — though the trend has not yet confirmed as bullish.
- Hourly RSI hit 71.05, entering overbought territory and suggesting near-term consolidation is likely before further upside.
- The $10.67–$10.81 zone forms the critical support band; a breakdown below it would invalidate the bullish thesis.
Daily Timeframe: Cleveland Cliffs Inc. Stock Breaks Above Key Resistance
Cleveland Cliffs Inc. stock has broken above both its 50-day and 200-day exponential moving averages on the daily chart. This marks the first concurrent clearance of these levels in the recent range — a structural shift.
Moving Average Structure
CLF closed at $11.06, above the EMA50 at $10.59 and the EMA200 at $10.81. The EMA20 sits well below at $10.03, reflecting how depressed the stock had been heading into earnings. This stacking of price above the medium-term moving averages is a constructive sign.
Momentum Indicators in Transition
However, the daily RSI at 58.44 is firm but not overbought. There is room to push higher before momentum becomes stretched. Meanwhile, the MACD remains in negative territory with the line at -0.42 and the signal at -0.57. Crucially, the MACD histogram has turned positive at +0.15. That flip signals decelerating bearish momentum — not a confirmed bull trend. The daily MACD needs more time to cross into positive territory.
Volatility and Key Price Levels
The daily Bollinger Bands tell a clear story. The upper band sits at $10.62, and CLF’s close of $11.06 has punched through it convincingly. This kind of breakout often reflects genuine momentum rather than a false pop. Still, it warrants watching for a potential mean reversion toward the $9.66 midline if sentiment cools.
Meanwhile, the daily ATR of $0.53 implies moderate volatility, giving traders a realistic framework for near-term swings. The daily pivot sits at $11.07 — almost exactly where CLF closed. R1 resistance is at $11.46, matching the intraday high. S1 support is at $10.67. Holding above the pivot and S1 on any pullback would keep the bullish thesis intact.
Overall, the daily regime is classified as neutral, not yet bullish. That nuance matters. The price action is improving, but the trend has not formally shifted. The earnings-driven candle is a strong signal, not a verdict.
Hourly Momentum: Strong, But Approaching Exhaustion
The hourly chart confirms strong bullish direction, but the RSI has pushed above 70 — signaling the move may be running hot and due for a short-term pause.
Notably, the H1 RSI has reached 71.05, just above the conventional overbought threshold. After a sharp single-day rally, that reading suggests near-term consolidation or a pullback would be the normal consequence.
At the same time, the hourly MACD is constructive: the line at +0.46 sits well above the signal at +0.24, with the histogram at +0.22. This confirms bullish momentum is active on the intraday timeframe. The H1 EMA structure also reinforces the move. The EMA20 at $10.07, EMA50 at $9.73, and EMA200 at $10.28 are all well below current price. CLF has broken free from significant near-term compression.
Still, on the H1 Bollinger Bands, price at $11.10 is close to the upper band at $11.40. That proximity, combined with an RSI above 70, creates a scenario where the stock could stall or retrace modestly before attempting a higher leg. The H1 pivot sits at $11.16, with R1 at $11.33 and S1 at $10.93. A pullback that holds above $10.93 would be technically healthy, keeping the intraday structure intact.
In contrast to the daily’s measured neutrality, the hourly picture is unambiguously bullish in direction. However, the overbought RSI complicates near-term entry timing.
15-Minute View: Execution Context and Short-Term Positioning
The 15-minute chart is the only timeframe carrying an explicit bullish regime label, with price cleanly above all three short-term moving averages.
Price at $11.10 sits above the EMA20 at $10.94, EMA50 at $10.36, and EMA200 at $9.71. The structure is cleanly bullish across all three averages. RSI at 60.77 is elevated but not extreme, leaving room for continuation.
Notably, the 15m MACD histogram has turned slightly negative at -0.07, even as the line remains positive at +0.32. This minor divergence hints at a brief cooling of momentum at the micro level. It is consistent with the late-session pullback from the $11.46 high toward the $11.10 close. The 15m pivot at $11.07 and R1 at $11.12 form a tight near-term cluster. Price needs to break and hold above $11.12 to keep intraday buyers engaged heading into the next session.
The Bullish Case: Earnings Beat as a Catalyst for Re-Rating
The earnings beat gives Cleveland Cliffs Inc. stock a credible catalyst for re-rating, especially given how depressed the stock was heading into the event.
Cleveland-Cliffs beat both earnings and revenue estimates for Q2. Reports indicate that strong quarterly guidance accompanied the release. That combination can trigger a re-rating, particularly when the stock has been depressed — as CLF clearly was, with the EMA20 sitting a full dollar below the post-earnings close.
If CLF consolidates above the $10.81 EMA200 and the daily MACD moves toward a bullish crossover, the next natural target is the $11.46 intraday high. A sustained close above $11.46 would represent a technical breakout with fundamental backing — a scenario that could attract fresh institutional interest.
Therefore, the bullish scenario hinges on three conditions: holding above daily S1 at $10.67 on any pullback, continued improvement in the daily MACD histogram, and a follow-through session confirming the move was not purely a gap-and-fade reaction.
The Bearish Scenario: Loss on the Bottom Line Cannot Be Ignored
Despite beating estimates, Cleveland Cliffs reported a Q2 net loss — a fact that could attract selling pressure once the initial earnings euphoria fades.
However, the risk is straightforward. Earnings beats that still result in negative net income can trigger a classic post-earnings fade pattern. If sentiment shifts, the stock could retreat toward the $10.62 daily Bollinger upper band, which now becomes near-term support. It could then potentially retest the $10.59 EMA50.
Consequently, a daily close back below the $10.81 EMA200 would significantly weaken the bullish thesis. Below that level, the pivot support at $10.67 becomes the last meaningful defense before the stock risks returning to its pre-earnings range. Meanwhile, the daily regime remaining neutral is a reminder that the technical trend has not yet confirmed what the price action implies.
Positioning, Volatility, and the Road Ahead
Cleveland Cliffs Inc. stock enters the post-earnings phase with improved technical posture but without full structural confirmation of a trend change.
The daily chart has broken above key moving averages. The hourly momentum is strong but short-term overbought. The 15-minute picture is bullish on structure, with a minor momentum hesitation. Altogether, this is a market that needs one more constructive session to convert an earnings-day rally into a credible trend.
Volatility, as measured by the daily ATR of $0.53, remains moderate. This means the swings are tradeable but not extreme. Traders watching CLF should treat the $10.67–$10.81 zone as the critical support band. As long as that zone holds on any post-earnings consolidation, the path of least resistance remains upward. A break below it, however, would signal that the market has chosen to focus on the loss rather than the beat — and the rally would need to be reassessed entirely.
FAQ
Will Cleveland Cliffs Inc. stock continue to rise after the Q2 earnings beat?
The technical picture is improving but not yet confirmed. The daily chart shows price above key moving averages and the MACD histogram has flipped positive. However, the daily regime remains neutral, and the stock needs a follow-through session above $11.46 to confirm a sustained uptrend. The hourly RSI at 71.05 also suggests a short-term pullback is likely first.
What is the key support level for CLF stock right now?
The critical support zone is $10.67 to $10.81. This band includes the daily EMA200 at $10.81 and the S1 pivot support at $10.67. As long as this zone holds on any post-earnings consolidation, the bullish thesis remains intact. A close below it would signal the rally has failed.
Is Cleveland Cliffs Inc. stock overbought after the Q2 earnings rally?
On the hourly timeframe, yes — the RSI reached 71.05, which is above the conventional overbought threshold of 70. This suggests the near-term move may be running hot and a consolidation or pullback would be normal. However, the daily RSI at 58.44 remains firm but not overbought, leaving room for further upside after any near-term cooling.
What were Cleveland Cliffs’ Q2 2026 earnings results?
Cleveland Cliffs beat analyst estimates on both earnings and revenue for Q2 2026. The company delivered an earnings surprise of +4.76% and a revenue surprise of +1.88%, despite reporting a net loss for the quarter. Strong quarterly guidance reportedly accompanied the release.
Disclaimer: This article is for informational purposes only and does not constitute financial advice, an investment recommendation, or a solicitation to buy or sell any financial instrument or cryptocurrency. The analysis provided is not indicative of future results. Investing in crypto assets and financial markets carries a high risk of capital loss. Always do your own research (DYOR) and consult a qualified financial advisor before making any decision.
Article produced with the assistance of artificial intelligence and reviewed by the editorial team.






 English (US) ·