
 4 weeks ago
40
4 weeks ago
40

Coca Cola Company (The) stock closed at $84.92 on July 16, pressing against the upper Bollinger Band near $85.49. KO trades above all major daily EMAs, reflecting a mature bullish trend. However, a Fairlife ransomware disruption and Q2 earnings on July 28 inject significant uncertainty into the setup.
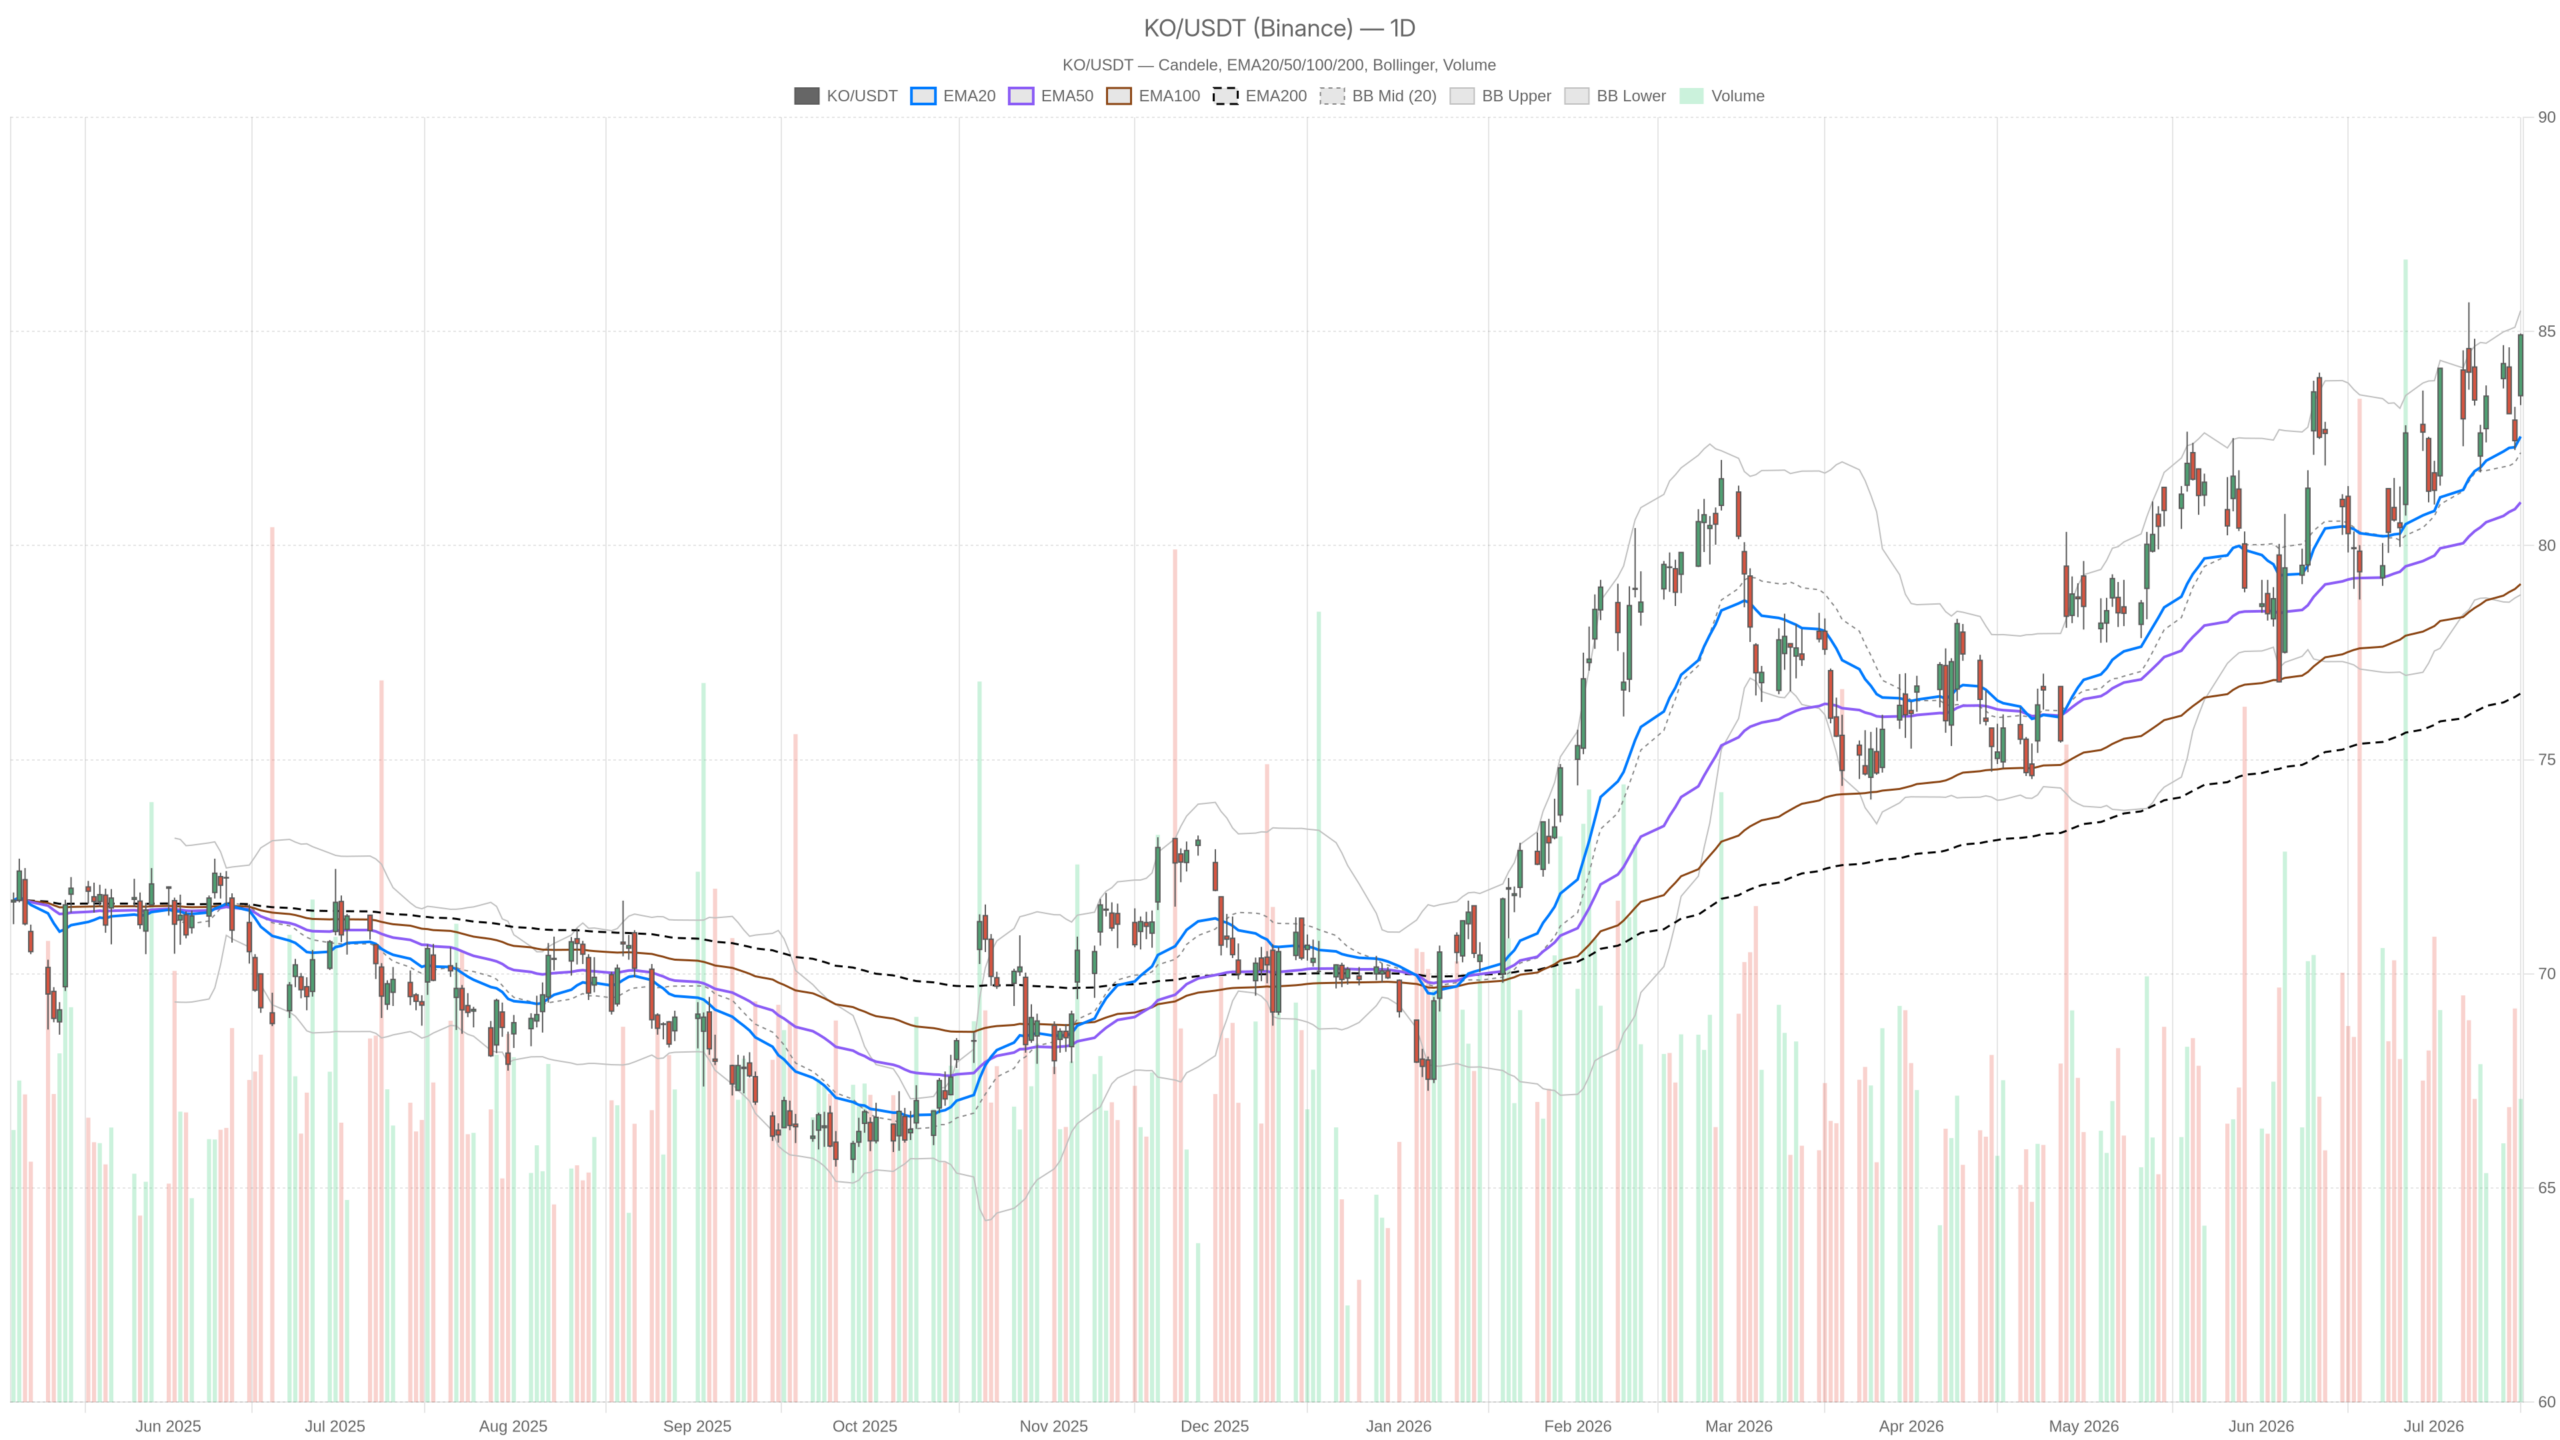 KO — daily chart with candlesticks, EMA20/EMA50 and volume.
Key takeaways
- KO stock trades in a bullish regime above its 20-day, 50-day, and 200-day EMAs across all timeframes.
- The daily RSI at 60.6 and positive MACD confirm constructive momentum with room for further upside.
- Near-term resistance sits at $85.49, reinforced by converging upper Bollinger Band and daily R1 levels.
- A Fairlife ransomware production halt introduces fundamental risk just days before Q2 earnings on July 28.
- The ATR of $1.79 signals meaningful daily swings, making entry timing a critical consideration.
Is Coca Cola Company (The) Stock in a Bullish Trend?
Coca Cola Company (The) stock is in a clearly bullish trend across all three timeframes as of July 16. KO closed at $84.92, printing a session high of $84.95. The stock now approaches the upper end of its daily Bollinger Band at $85.49.
The technical structure is clean and the trend is mature. Price action aligns with a broader bullish regime. Still, the immediate question is whether momentum can extend further. Stretched valuations and a significant operational disruption may cap the advance ahead of earnings.
What Does the Daily Chart Reveal About KO Stock?
The daily chart reveals a solid bullish structure built on a stacked EMA configuration. KO trades above its 20-day EMA at $82.55, its 50-day EMA at $81.01, and its 200-day EMA at $76.55. This alignment reflects a trend that has been building for months, not days.
The daily RSI at 60.6 is constructive without being dangerously overbought. It leaves room for further upside before reaching levels that historically invite profit-taking. Meanwhile, the MACD confirms the momentum. The MACD line at 0.93 sits above the signal at 0.84, with a positive histogram of 0.09. The crossover is positive but the narrow histogram suggests modest rather than explosive momentum.
Bollinger Bands show price approaching the upper band at $85.49. This does not automatically imply a reversal. However, it defines a near-term resistance zone that deserves respect. The daily ATR of $1.79 sets expectations for meaningful intraday swings.
Notably, the daily pivot structure adds further texture. The pivot point sits at $84.38, with R1 at $85.49. This aligns almost exactly with the upper Bollinger Band. The confluence strengthens the case for treating $85.49 as a genuine near-term ceiling. Support at S1 at $83.82 provides the first meaningful floor below current price.
Does the Hourly Chart Confirm the Bullish Bias?
Yes, the 1-hour chart reinforces the daily bullish bias without contradiction. Price at $84.93 sits comfortably above the 1H EMA20 at $83.84, EMA50 at $83.50, and EMA200 at $82.21. All three are stacked in bullish order.
The 1H RSI at 65.93 is elevated and approaching levels where short-term exhaustion can emerge. However, it has not yet crossed into overbought territory above 70. The 1H MACD is notably stronger than the daily. The histogram at 0.20 shows clear positive momentum on the intraday frame.
This is a meaningful confirmation. When the shorter timeframe shows more energy than the longer one, it typically indicates the trend is accelerating rather than fading. On the other hand, the 1H Bollinger upper band at $85.09 sits just above current price. Combined with the 1H R1 at $85.08, the ceiling is well-defined and close. This does not negate the bullish structure. But it does suggest the next $0.20 of upside is where genuine short-term resistance will emerge.
What Does the 15-Minute Chart Signal for Entry Timing?
The 15-minute chart confirms the broader trend but signals a short-term stall. Price closed at $84.93, above all three EMAs. The 15m EMA20 sits at $84.48, the EMA50 at $84.03, and the EMA200 at $83.53.
The 15m RSI at 66.86 mirrors the hourly reading. It is elevated but not yet extreme. However, the 15m MACD histogram turned slightly negative at -0.02. This is a minor signal, not a structural concern. It simply indicates very short-term momentum may be stalling at current levels.
For traders managing entry timing, the 15m structure argues for patience. The stock is pressing against the top of its 15m Bollinger Band at $84.96 right at the close. A minor pullback toward $84.76 or the 15m EMA20 at $84.48 would provide a better-defined risk entry. Chasing price at resistance is rarely the optimal approach.
What Supports the Bullish Case for Coca Cola Company (The) Stock?
The bullish case is supported by institutional confidence and a strong earnings track record. Piper Sandler reiterated an Overweight rating on KO stock this week, citing momentum. This vote of confidence from institutional coverage validates the technical picture.
Motley Fool noted that KO recently hit an all-time high. The company also has a track record of exceeding earnings expectations. With Q2 results due on July 28, that context matters. Historically, companies with strong momentum and a credible beat record tend to attract pre-event positioning.
In this scenario, a clean break above the $85.49 resistance zone would open a path toward new price discovery. The daily regime is firmly bullish. All EMAs are aligned. Momentum indicators are positive across all three timeframes. That trifecta reflects genuine underlying demand, not coincidence.
What Is the Primary Bearish Risk for KO Stock?
The primary bearish risk is the Fairlife ransomware attack that halted US production. Coca-Cola’s Fairlife division stopped operations following the cyber incident. The disruption comes directly ahead of Q2 earnings. This forces investors to assess recovery timelines, cyber liability exposure, and potential financial impact.
This is not an abstract risk. It is an operational disruption with real revenue implications if the production halt extends. The technical ceiling at $85.49 is now reinforced by this fundamental uncertainty. If the market begins pricing in a Fairlife earnings headwind, the daily S1 at $83.82 becomes the first key downside reference. The 20-day EMA at $82.55 follows as the next support.
A break below the 20 EMA would structurally weaken the daily thesis. It would signal the start of a more meaningful consolidation. The ATR of $1.79 suggests such a move could develop quickly within one or two sessions. Therefore, the ransomware news is the single most important wildcard in this setup.
Overall, the technicals remain bullish but the fundamental disruption is unresolved. Markets tend to hold bullish structure until catalysts force repricing. A production halt at a key growth brand, revealed days before earnings, has the potential to do exactly that.
How Should Traders Position in KO Stock Ahead of Q2 Earnings?
Coca Cola Company (The) stock enters this critical stretch with a clear technical advantage. The bullish daily regime remains intact. The EMA stack is aligned. Momentum is positive across timeframes. However, the setup is not without complexity.
Resistance is tight. The $85.49 zone is the definitive short-term ceiling. At the same time, the Fairlife ransomware disruption injects fundamental uncertainty that the price has not yet fully digested. With Q2 earnings on July 28, implied volatility is likely to rise. This compresses risk/reward for late entries.
The most disciplined approach is to respect both the bullish structure and the emerging headwinds. The trend is real and the analyst community remains constructive. Pre-earnings momentum in KO stock has historically been supportive. Still, chasing a stock pressing against its upper Bollinger Band is risky. An unresolved ransomware incident and earnings ten days away make volatility the operative variable through July 28.
FAQ
Is Coca-Cola stock a buy right now?
Coca Cola Company (The) stock holds a bullish technical structure across all timeframes. However, the stock is pressing against resistance at $85.49. The unresolved Fairlife ransomware disruption adds further uncertainty. Entry timing near resistance carries elevated risk. A pullback toward the 20-day EMA at $82.55 would offer a more favorable risk/reward setup.
What is the key resistance level for KO stock?
The key resistance for KO stock is $85.49. This level represents the convergence of the daily upper Bollinger Band and the daily R1 pivot. A clean break above this zone would open a path toward new highs.
How does the Fairlife ransomware attack affect Coca-Cola stock?
The Fairlife ransomware attack has halted US production at a key growth brand. The disruption creates earnings uncertainty just days before Q2 results on July 28. If the production halt extends, it could impact revenues. A pullback toward the daily S1 at $83.82 or the 20-day EMA at $82.55 would be possible.
When are Coca-Cola’s Q2 earnings?
Coca-Cola’s Q2 earnings are scheduled for July 28. The company has a track record of exceeding earnings expectations. This historically supports pre-event positioning in KO stock.
Disclaimer: This article is for informational purposes only and does not constitute financial advice, an investment recommendation, or a solicitation to buy or sell any financial instrument or cryptocurrency. The analysis provided is not indicative of future results. Investing in crypto assets and financial markets carries a high risk of capital loss. Always do your own research (DYOR) and consult a qualified financial advisor before making any decision.
Article produced with the assistance of artificial intelligence and reviewed by the editorial team.






 English (US) ·