
 3 hours ago
22
3 hours ago
22

Coherent Corp. stock enters a critical week at 367.12, stretched far above all major moving averages. Friday’s sharp intraday rejection from 386.75 warns of tactical exhaustion ahead of earnings. The trend remains powerful, but the tape now demands caution.
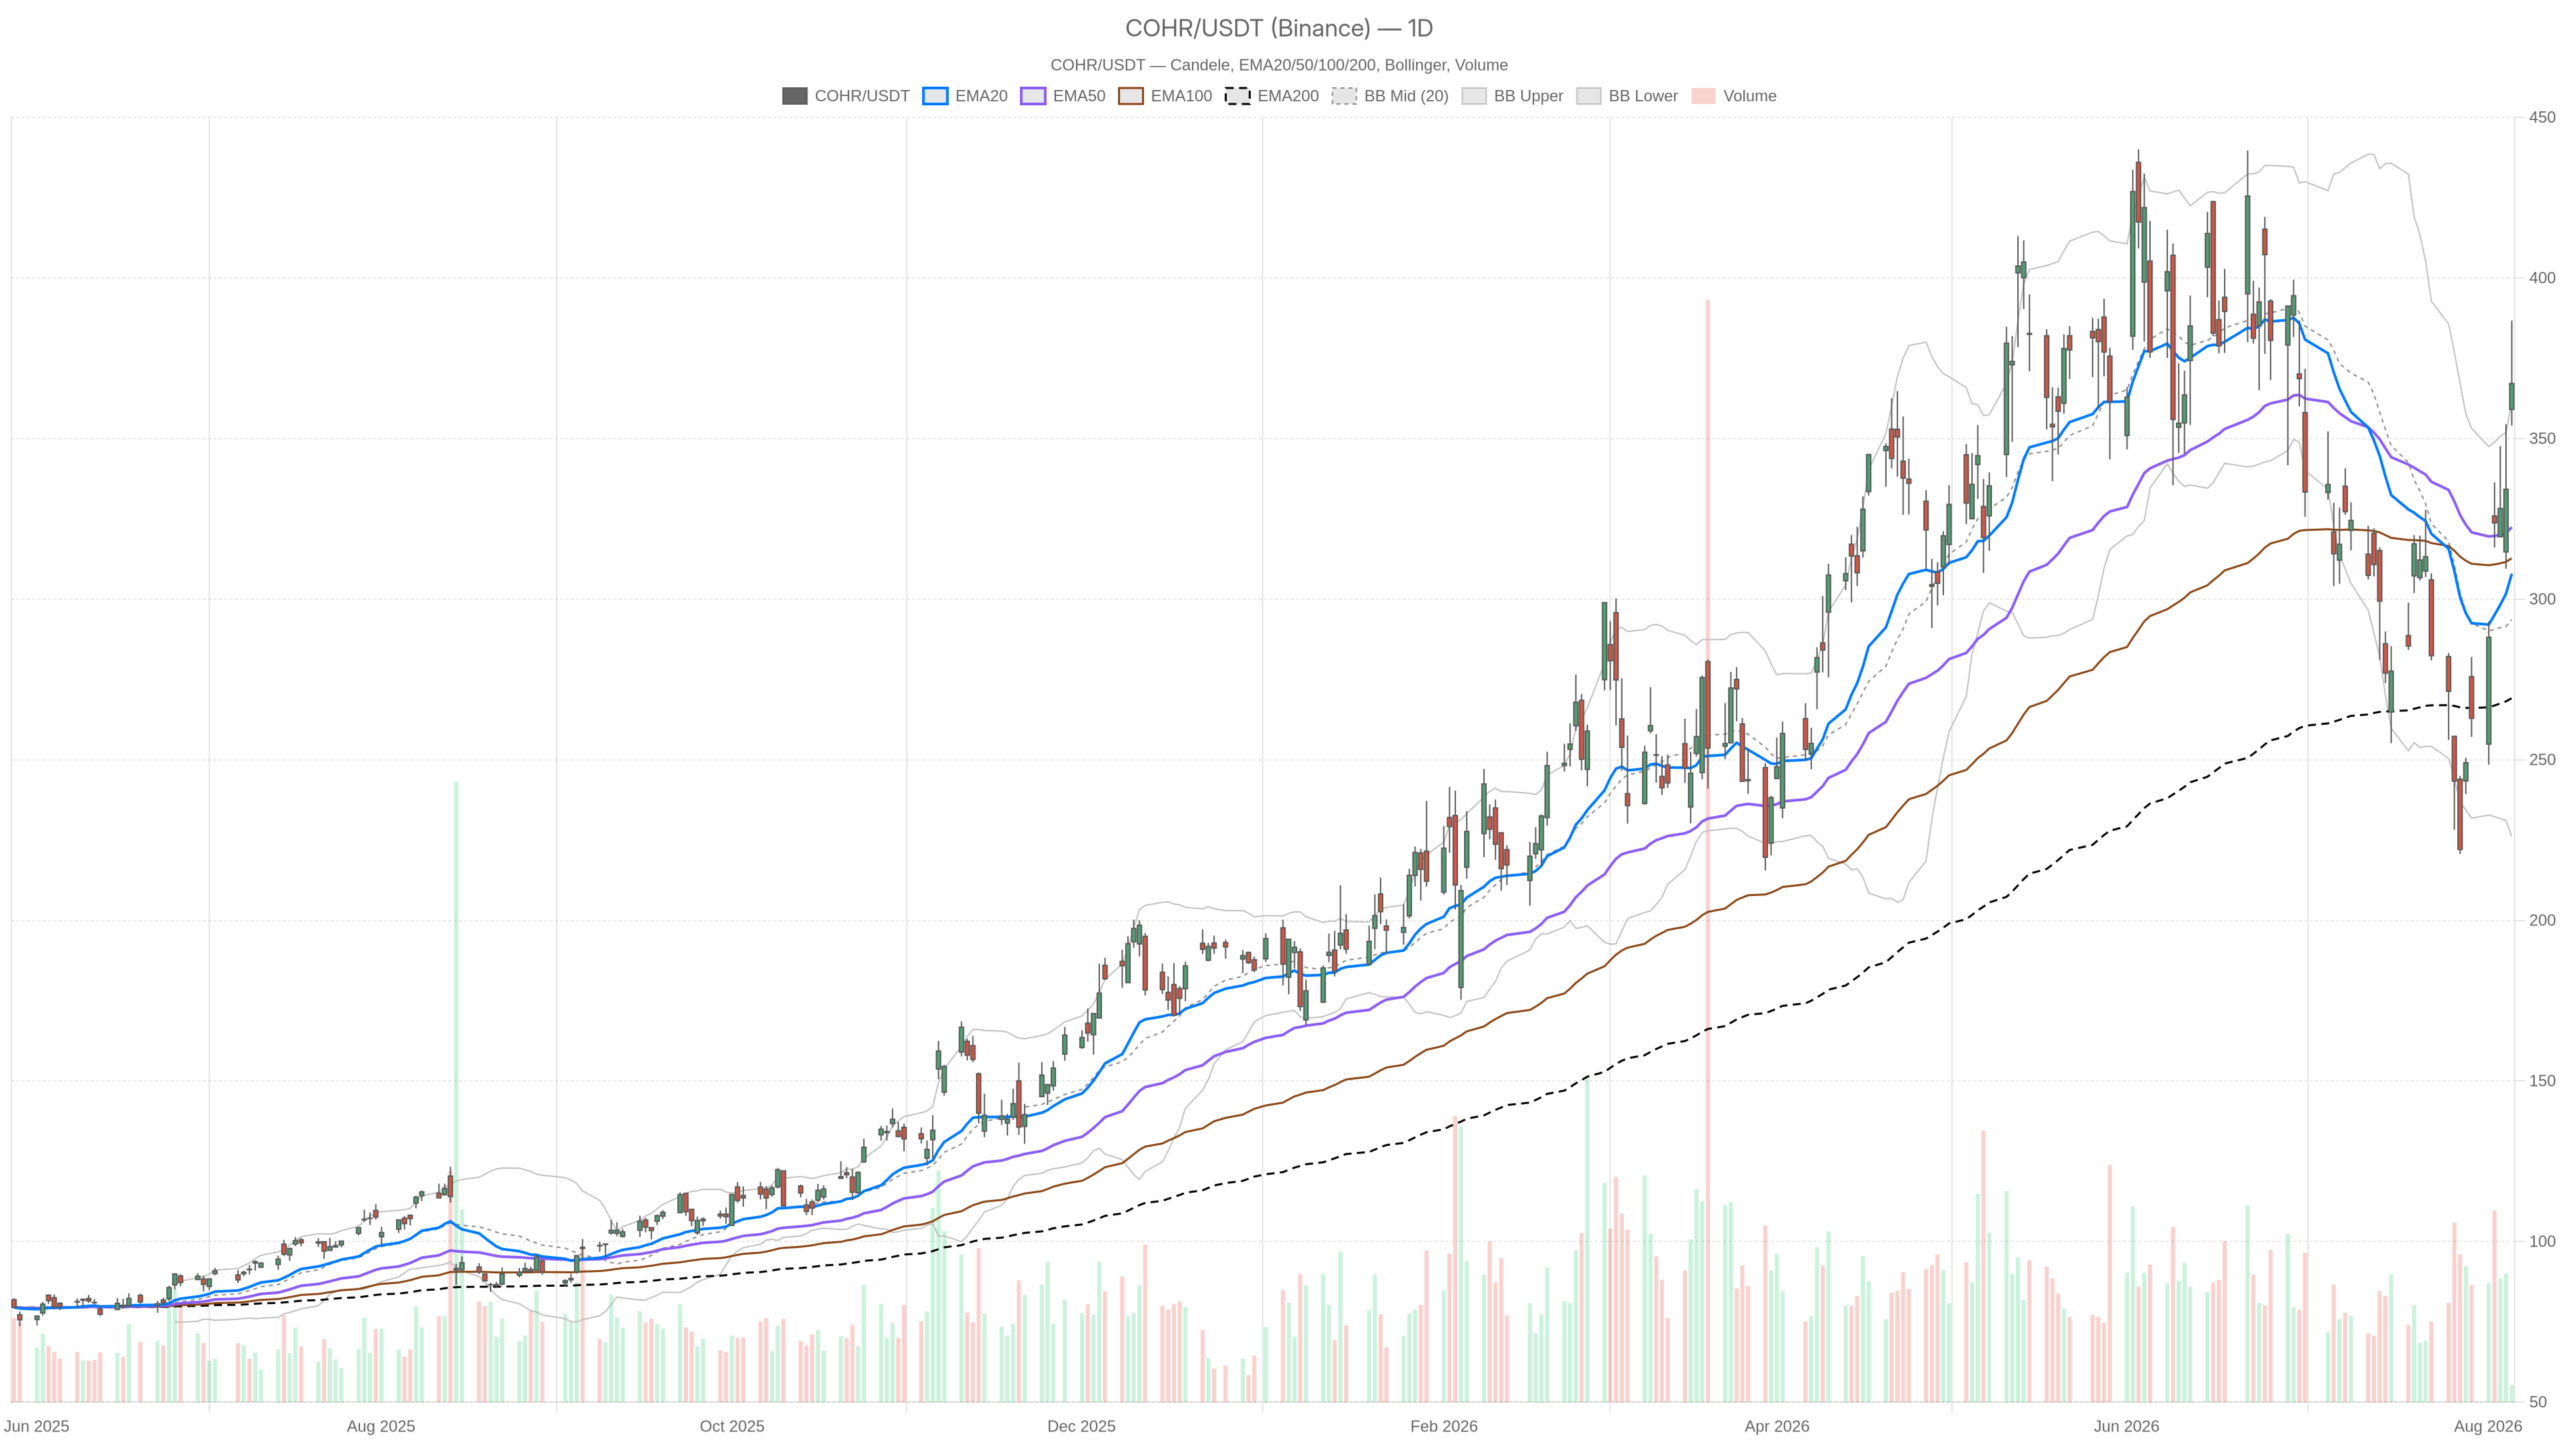 COHR — daily chart with candlesticks, EMA20/EMA50 and volume.
Key takeaways
- Daily close at 367.12 sits far above the 20-day EMA at 307.91, the 50-day at 322.40, and the 200-day at 269.16.
- Friday’s session produced a long upper wick after hitting 386.75, with sellers emerging above the daily R1 pivot at 384.58.
- Daily ATR of 34.01 represents roughly 9% of the stock price, making level-based reasoning fragile.
- Hourly MACD histogram has collapsed to just 0.75, signaling momentum thrust fading while price remains elevated.
- Earnings and unresolved China export-policy headlines could reset the range in a single session.
Daily Structure: Trend Intact, Extension Extreme
The daily trend remains unequivocally bullish, but price has reached an extreme extension that historically favors consolidation over continuation. The daily Bollinger picture explains most of the tension. The mid-band sits at 293.63, the upper band at 361.15. Price closed above that upper band. Closing outside the band is not a sell signal by itself. Yet it does mark a market moving faster than its own volatility envelope. Distance from the mid-band is now more than 70 points.
However, daily RSI at 61.86 adds a useful nuance. Momentum is firmly positive but not extreme. The indicator has not yet priced in the full aggression of the recent expansion. That mismatch between a stretched price and a moderate RSI usually resolves through consolidation rather than immediate collapse.
MACD tells the story of a trend that turned late. The daily line is still negative at -3.38. The signal line sits much lower at -15.92, producing a histogram of +12.54. Momentum has flipped hard from below zero. Notably, the line has not crossed into positive territory yet. This is typical of an early-stage recovery rather than a mature advance.
Therefore, volatility is the real risk factor here. Daily ATR at 34.01 is roughly nine percent of the current price. A single normal session can swallow entire support zones. The daily pivot structure — pp 369.29, R1 384.58, S1 351.83 — spans a range narrower than one average daily move. Traders working tight stops on Coherent Corp. stock are effectively fighting the instrument’s own volatility.
The 1H Chart: Coherent Corp. Stock’s Intraday Warnings
The hourly chart confirms the bullish direction but reveals weakening momentum that complicates immediate entry timing. Price sits above the 20-hour EMA at 336.24, the 50-hour at 311.40 and the 200-hour at 313.01. The 50 and 200 hourly averages are almost identical. This shows how compressed the base was before this expansion.
Meanwhile, hourly RSI at 68.35 is knocking on overbought territory. The hourly MACD line at 16.24 barely leads its signal at 15.50. That leaves a histogram of just 0.75. The reading shows momentum losing thrust while price is still elevated. Divergence of intent, not yet divergence of price.
Notably, the last hourly candle is the clearest warning in the dataset. It opened at 379.75, which was also its high. It then dropped to 366.31 and closed at 367.12. A full-body rejection from the highs, on 97,296 shares. Price closed just above the hourly upper Bollinger band at 364.32. This underlines how unusually extended the hourly channel has become.
Hourly pivots frame the immediate battleground: pp 371.06, R1 375.81, S1 362.37. With hourly ATR at 12.85, that entire zone can be crossed in a couple of bars. Therefore, intraday positioning around these levels demands wider tolerance than the numbers suggest at first glance.
15m Execution Context
The 15-minute chart retains a bullish structure, but short-term buyers have stopped pressing higher. This creates an execution map defined by clear intraday markers. The 15-minute regime is still classified as bullish. EMA20 at 351.67 sits above EMA50 at 341.22. EMA200 remains far below at 308.49. RSI at 60.61 is neutral-to-constructive, and the MACD histogram at 3.64 remains positive.
At the same time, the 15-minute close at 366.92 stands well below the upper band at 378.81. It sits clearly above the mid-band at 346.91. Short-term buyers have not lost control, but they have stopped pressing. The relevant intraday markers are S1 at 362.04 and R1 at 375.77, with ATR at 9.70. For execution purposes, that is the map: reclaim 371–376 to re-engage, lose 362 to open air below.
Bullish Scenario for Coherent Corp. Stock
Buyers must defend the 362–366 pocket and reclaim 369.29 to revive the bullish case, with 386.75 as the next upside target. The constructive path is straightforward. Buyers need to hold that pocket and then reclaim the daily pivot at 369.29. From there, a push through the hourly R1 at 375.81 would put the prior high at 386.75 back in play. The daily R1 at 384.58 would also come into focus. A daily MACD line crossing above zero would strengthen that case considerably.
The news backdrop offers a plausible catalyst. Reports of potential U.S. restrictions on data center components sold to China have been read as a demand shift toward U.S.-made optical transceivers. This is the exact segment where Coherent operates. Earnings are also approaching, with commentary pointing to conditions consistent with a beat. Meanwhile, the longer structural argument — a move from cyclical component vendor toward integrated photonics and AI optics — keeps attracting buyers on dips.
Bearish Scenario and What Would Break the Bull Case
The bearish path is already visible on the chart. It starts with the 386.75 rejection, and failure to recover 369.29 would confirm it as a short-term exhaustion high. In contrast, the bearish scenario begins with that same rejection. A daily close back below the upper Bollinger band at 361.15 would add weight to the reversal. A subsequent break of daily S1 at 351.83 would mark the start of a genuine unwind. Below that, the gap toward the 20-day EMA at 307.91 is wide and largely unsupported.
On the other hand, the same headlines cut both ways. The initial market reaction to the China data center curbs was negative for Coherent shares. The narrative then shifted to a demand-reallocation story. That ambiguity is unresolved. Valuation adds another layer of fragility: after a 424.1% three-year return, cash-flow models suggest upside while earnings multiples screen expensive. A crowded, richly valued name entering an earnings print is vulnerable to disappointment.
Positioning and Uncertainty
The signals are aligned in direction and conflicted in timing, with volatility standing as the dominant variable ahead of the print. Overall, daily and hourly trend structures are clearly bullish. Hourly momentum is flattening, and the last candle was a rejection. The 15-minute chart is the only frame still reading as outright bullish. It is also the least meaningful for bias.
Ultimately, volatility is the dominant variable. A daily ATR of 34.01 against a pivot band of roughly 33 points means level-based reasoning is fragile until the range recompresses. Coherent Corp. stock therefore sits in a high-conviction trend with low-conviction short-term timing. An earnings release and unresolved export-policy headlines are both capable of resetting the range in a single session.
FAQ
Is Coherent Corp. stock still in a bull trend?
Yes. Coherent Corp. stock closed at 367.12, far above its 20-day EMA at 307.91, 50-day at 322.40, and 200-day at 269.16. The daily trend structure remains unequivocally bullish, though short-term momentum shows signs of exhaustion after Friday’s rejection from 386.75.
What are the key support levels for Coherent Corp. stock?
The immediate support pocket sits at 362–366, anchored by the daily S1 at 351.83 and the hourly S1 at 362.37. Below that, the 20-day EMA at 307.91 represents the next significant support, though the gap is wide and largely unsupported.
How does the upcoming earnings report affect Coherent Corp. stock?
Commentary points to conditions consistent with an earnings beat. However, after a 424.1% three-year return and stretched positioning, the stock enters the print vulnerable to disappointment. Combined with unresolved China export-policy headlines, earnings could reset the range in a single session.
What is the bearish case for Coherent Corp. stock?
The bearish case starts with Friday’s rejection at 386.75. Failure to recover the daily pivot at 369.29 would confirm this as a short-term exhaustion high. A close below the upper Bollinger band at 361.15, followed by a break of daily S1 at 351.83, would mark the start of a genuine unwind toward the 20-day EMA at 307.91.
Disclaimer: This article is for informational purposes only and does not constitute financial advice, an investment recommendation, or a solicitation to buy or sell any financial instrument or cryptocurrency. The analysis provided is not indicative of future results. Investing in crypto assets and financial markets carries a high risk of capital loss. Always do your own research (DYOR) and consult a qualified financial advisor before making any decision.
Article produced with the assistance of artificial intelligence and reviewed by the editorial team.








 English (US) ·