
 4 weeks ago
67
4 weeks ago
67
Corning Incorporated stock sits at $173.54 after a sharp decline, trading well below its key moving averages. Analysts are divided: buying opportunity or extended correction? The daily chart paints a cautious picture. Despite AI partnerships with NVIDIA and Amazon, deteriorating momentum demands respect before any recovery thesis takes hold.
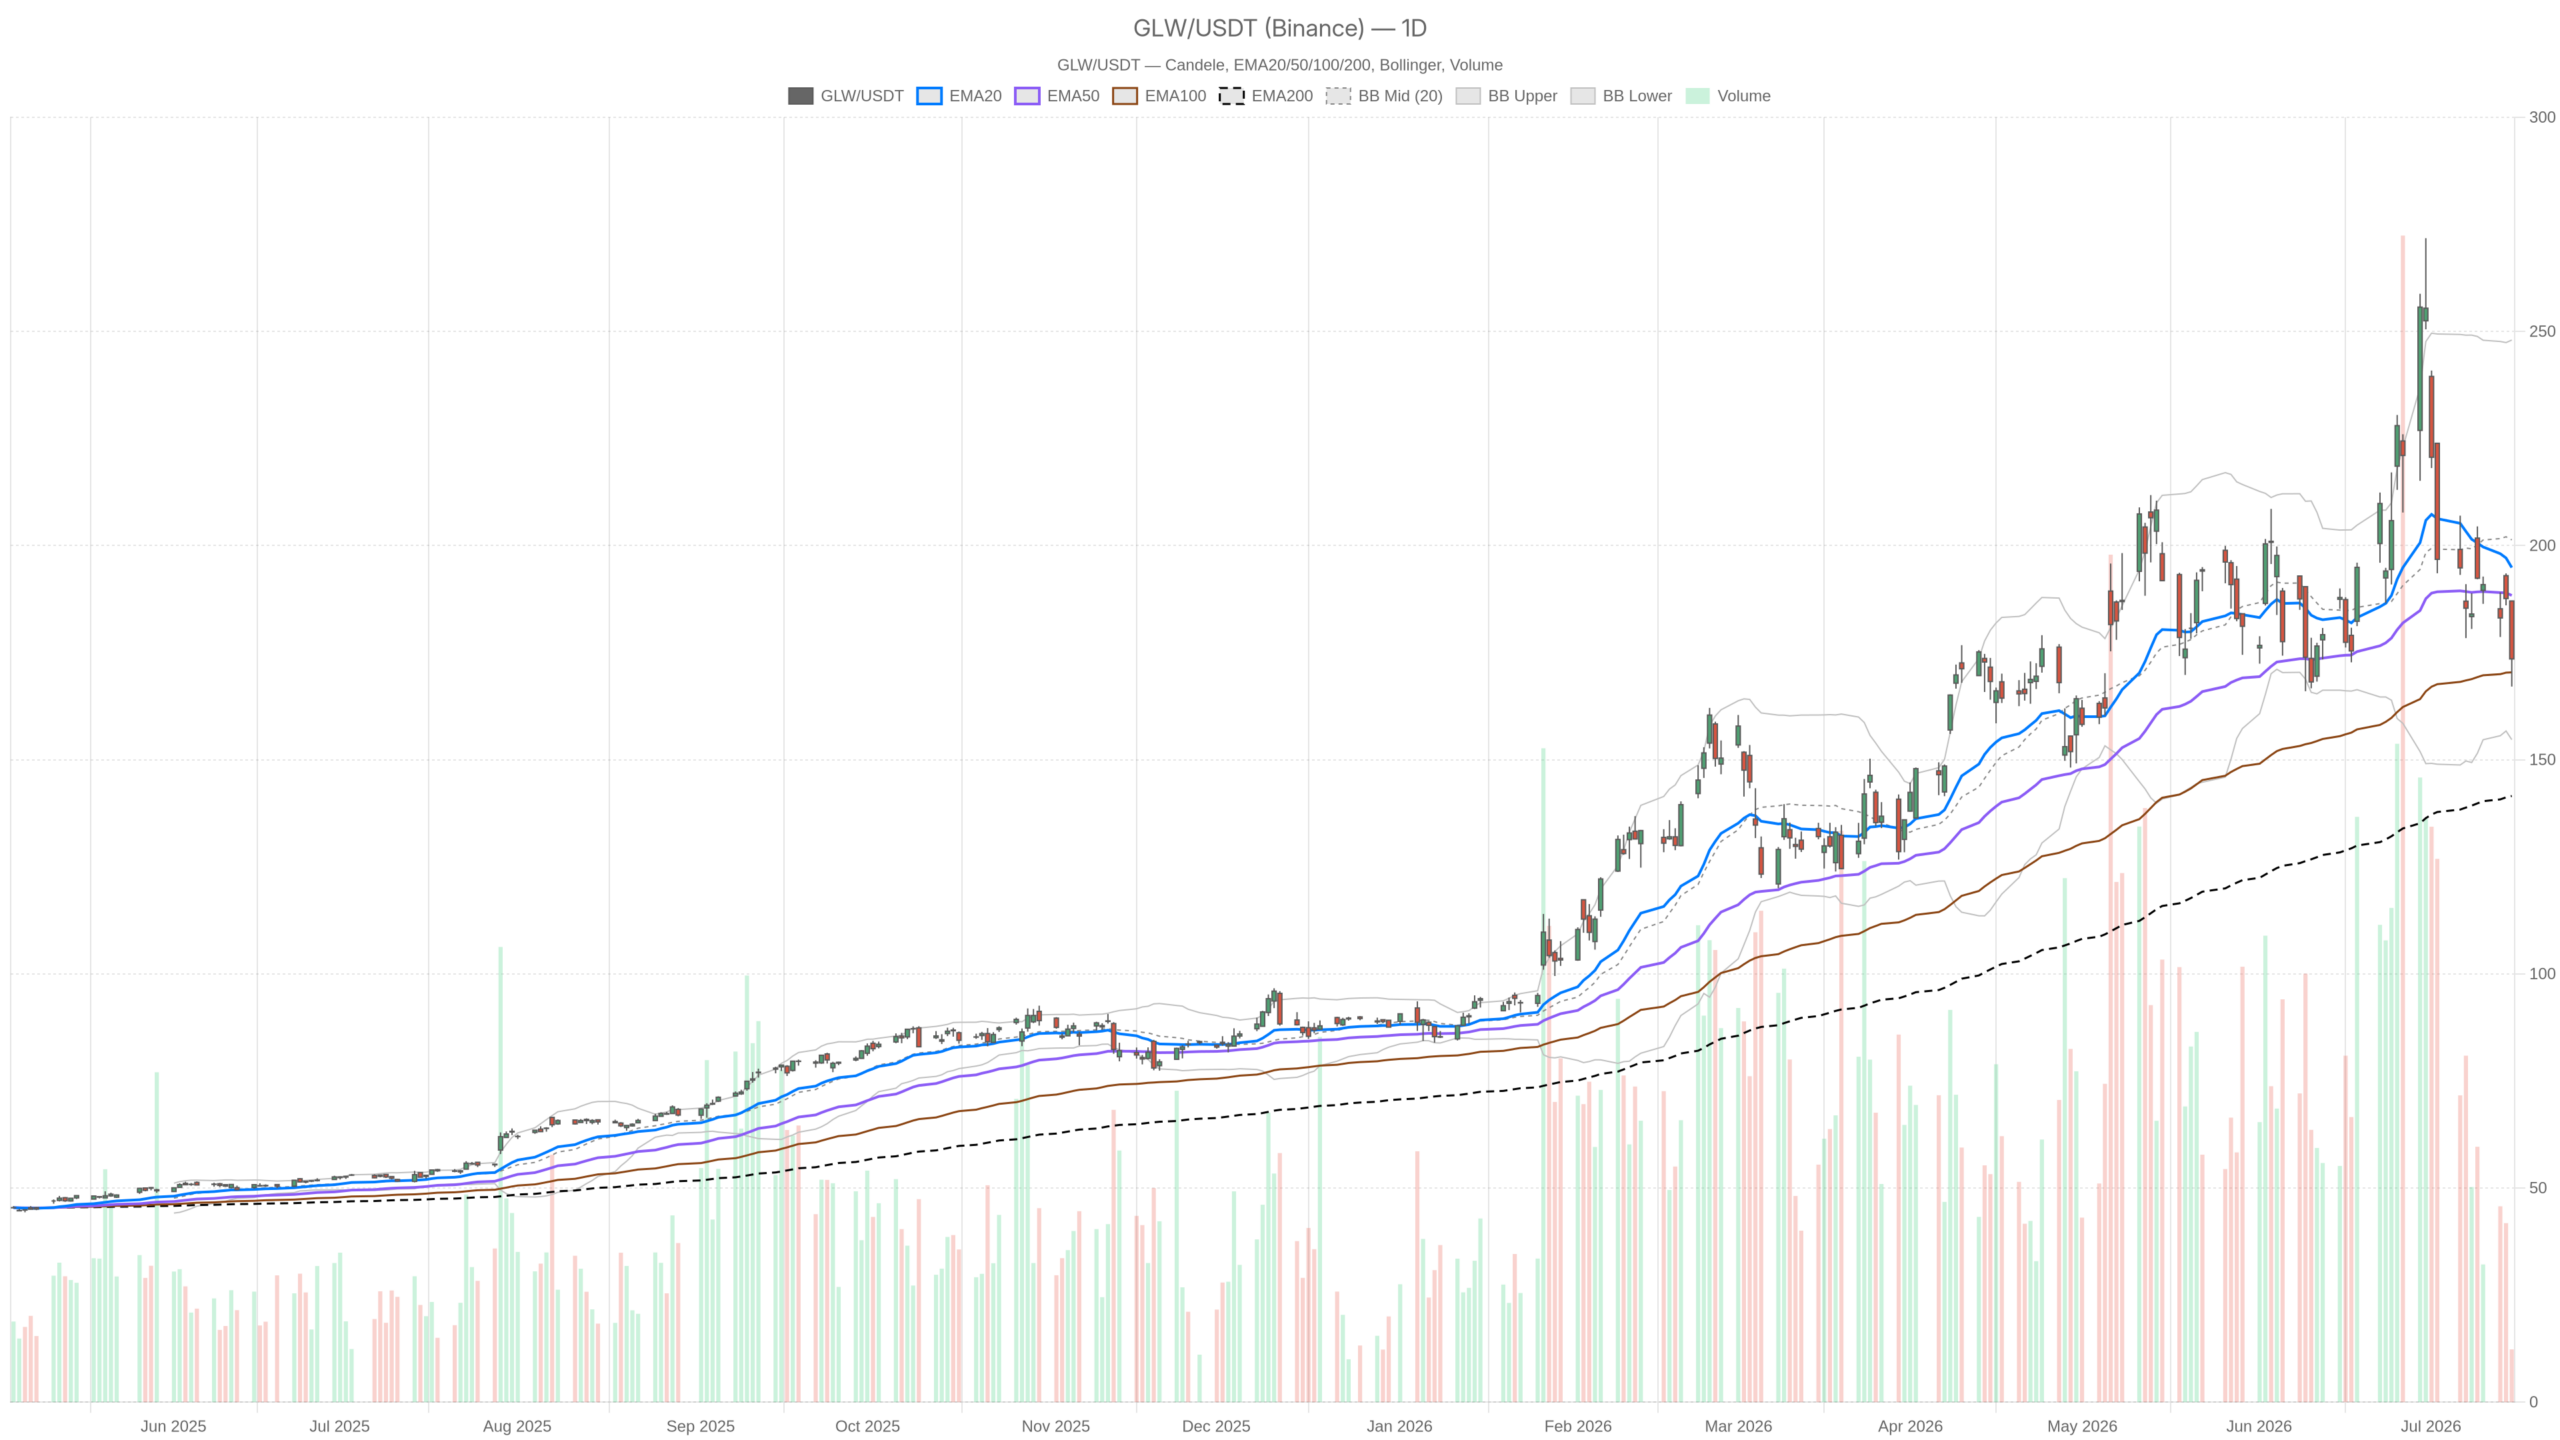 GLW — daily chart with candlesticks, EMA20/EMA50 and volume.
Key takeaways
- GLW closed at $173.54 on July 15, well below both the EMA20 ($194.86) and EMA50 ($188.36).
- Daily RSI14 at 42.25 signals selling momentum that is not yet exhausted.
- Daily MACD histogram at -4.75 confirms a bearish momentum breakdown with meaningful separation.
- Multi-billion dollar Amazon and NVIDIA AI partnerships provide long-term fundamental support.
- Next major support sits near $164.73 (S1); a daily close below would confirm the breakdown.
Daily Bias: Corning Incorporated Stock Under Bearish Pressure
The daily bias for Corning Incorporated stock leans decisively bearish. Price closed at $173.54 on July 15 after touching an intraday low of $167.09. The stock opened at $187.07 and closed sharply lower. That kind of gap-and-grind lower on meaningful volume is not noise.
Moving Average Structure Breakdown
GLW trades below both the EMA20 at $194.86 and the EMA50 at $188.36 on the daily chart. The only moving average providing structural support is the EMA200 at $141.53. However, that level sits so far from current price that it offers little near-term guidance. The EMA stack is in full bearish alignment from price upward, confirming the trend deterioration.
Momentum and Volatility Signals
Meanwhile, the daily RSI14 sits at 42.25. It is approaching oversold territory but has not reached it. The reading suggests selling momentum is real and not yet exhausted. Further downside remains possible before any technical bounce becomes compelling.
Momentum indicators reinforce this narrative. The MACD line at -2.13 sits well below the signal line at 2.62. This produces a histogram reading of -4.75 — a bearish cross with meaningful separation. Such a reading typically follows a momentum breakdown rather than precedes a recovery. The daily regime is flagged as neutral by the system. However, the indicator alignment is more candidly bearish than that label suggests.
Bollinger Bands place the midline at $201.34, far above current price. The lower band sits at $154.69 and the upper at $248. GLW trades in the lower half of the band, consistent with a stock losing trend momentum. Volatility, measured by the ATR14 at $20.45, is elevated — amplifying both risk and opportunity.
Overall, the daily pivot structure sets the pivot point at $175.90, with R1 at $184.71 and S1 at $164.73. Current price at $173.54 sits below the pivot. This keeps the technical tone negative for near-term sessions.
Hourly Confirmation: The 1H Frame Amplifies the Weakness
The 1H timeframe confirms and deepens the daily bearish case rather than offering any contrarian signal. Hourly close at $173.45 sits below all three EMAs. The EMA20 stands at $180.97, the EMA50 at $188.47, and the EMA200 at $196.02. This descending EMA stack signals that the intermediate trend has fully rolled over.
Notably, the hourly RSI14 at 34.67 is approaching the oversold threshold. However, in strongly trending down moves, RSI can remain in this zone for extended periods before producing a meaningful bounce. The reading alone is not a buy signal.
In contrast to the daily MACD, the hourly MACD offers a faint glimmer of divergence. The line is at -4.76 against a signal of -3.56, producing a histogram of -1.20. The negative histogram is narrowing slightly. This is a tentative sign that short-term selling pressure may be losing intensity. Still, this is not a reversal signal — it is merely worth monitoring.
Meanwhile, the hourly Bollinger midline at $182.26 and lower band at $168.55 confirm price compression toward the lower range. ATR14 on the 1H at $4.35 reflects a still-volatile intraday environment. The hourly pivot is clustered tightly: PP at $173.56, R1 at $174.13, S1 at $172.89. Price oscillates just below the pivot — a thin range that could break in either direction with minimal catalyst.
15-Minute Context: A Marginal Stabilization
The 15-minute chart shows marginal stabilization, but this does not alter the broader bearish picture. The 15m close at $173.54 sits fractionally below the EMA20 at $173.80. Yet the MACD histogram has turned positive at 0.88, with the line at -2.40 crossing above the signal at -3.29. That micro-divergence suggests the very short-term selling impulse is fading.
The 15m RSI at 43.91 is neutral — neither oversold nor showing recovery strength. Its regime is flagged bearish. Therefore, the stabilization here is tentative at best. It may support a short-term technical bounce into the $173.88 R1 level. However, it does not change the broader directional picture.
The Fundamental Divide: AI Optionality vs. Stretched Valuation
The fundamental picture for Corning is sharply divided between AI-driven optimism and valuation concerns. On one side, the company has secured a multi-billion dollar agreement with Amazon to expand US production of optical fiber products for AI data centers. It has also partnered with NVIDIA to grow domestic manufacturing capacity for advanced optical solutions. These are tangible long-term demand anchors in a structural AI infrastructure buildout.
On the other side, analysts have responded to the 30% price decline with contrasting conclusions. One Seeking Alpha analysis issued a double downgrade to Sell. It argued that AI growth and ties to Meta and NVIDIA cannot justify a rich valuation. Another piece noted that a 60x P/E looks stretched even after a 30% drop.
Notably, a third analyst took the opposing view — that mounting AI partnerships make the plunge buyable given robust EPS growth expectations. A fourth rated the stock Hold, citing uncertainty around long-duration earnings and the absence of clear contractual floors in the optical segment. This level of analytical disagreement is itself a signal. When credible voices sit on opposite sides of the same trade, the market is genuinely uncertain about fair value.
Bullish Scenario: What Would Need to Happen
A credible bullish case exists but requires specific technical conditions. First, GLW would need to reclaim the $175.90 daily pivot on a closing basis. That would shift the short-term structure from bearish to at least neutral. Second, a recovery above the EMA50 at $188.36 on the daily chart would signal meaningful trend rehabilitation.
The Amazon and NVIDIA deals provide a genuine fundamental floor. If upcoming earnings or guidance quantify contract revenues more clearly, the valuation debate could shift in bulls’ favor. Additionally, any broader market rotation into technology infrastructure plays would provide tailwind for Corning’s AI optical narrative.
Bearish Scenario: What Would Invalidate the Recovery Case
The bearish case is currently better supported by price structure. A daily close below S1 at $164.73 would confirm the breakdown. It would open downside toward the lower Bollinger Band at $154.69. The daily MACD histogram at -4.75 shows no sign of stabilization at the daily level.
Meanwhile, if earnings disappoint or management fails to provide clarity on the contractual nature of AI pipeline revenues, the valuation compression could accelerate. The hourly EMA200 at $196.02 now acts as a formidable ceiling. Any attempted recovery would face multiple resistance layers before reaching that level.
Corning Incorporated Stock: Positioning and Volatility Outlook
Overall, Corning Incorporated stock is in a high-uncertainty zone. The daily structure is broken, hourly momentum is bearish, and the 15-minute frame offers only tentative stabilization. The ATR14 at $20.45 daily means single-session swings of significant magnitude are the norm, not the exception. Traders and investors need to respect that volatility context.
The fundamental story — AI optical infrastructure, Amazon and NVIDIA partnerships — remains intact as a long-term thesis. However, the chart is not confirming that thesis yet. Until GLW reclaims its daily pivot and shows EMA recovery on the 1H frame, the path of least resistance remains lower. The next major test sits near the $164.73 support level.
FAQ
Is Corning Incorporated stock a buy right now?
The current technical structure does not support a buy signal. GLW trades below both the EMA20 and EMA50 on the daily chart, with RSI14 at 42.25 and a bearish MACD cross. The hourly frame confirms the weakness. A recovery above the $175.90 daily pivot and the EMA50 at $188.36 would be needed before the technical picture improves.
What is the next support level for GLW?
The next major support sits at $164.73 (S1). A daily close below this level would confirm the technical breakdown and open downside toward the lower Bollinger Band at $154.69.
What AI partnerships does Corning have?
Corning has secured a multi-billion dollar agreement with Amazon to expand US production of optical fiber products for AI data centers. It has also partnered with NVIDIA to grow domestic manufacturing capacity for advanced optical solutions.
Why are analysts divided on Corning Incorporated stock?
Analysts disagree because the valuation remains stretched — a 60x P/E even after a 30% price decline — while the AI infrastructure partnerships represent genuine long-term demand catalysts. Some see a buying opportunity; others argue the rich valuation is not justified despite AI tailwinds.
Disclaimer: This article is for informational purposes only and does not constitute financial advice, an investment recommendation, or a solicitation to buy or sell any financial instrument or cryptocurrency. The analysis provided is not indicative of future results. Investing in crypto assets and financial markets carries a high risk of capital loss. Always do your own research (DYOR) and consult a qualified financial advisor before making any decision.
Article produced with the assistance of artificial intelligence and reviewed by the editorial team.






 English (US) ·