
 7 hours ago
15
7 hours ago
15
As of August 15, 2026, CoW Protocol crypto is trading at 0.16 on the COW/USDT pair, right where a fast rally begins to test its own limits. The daily chart flashes an overbought signal while DeFi fee activity fades across major exchanges.
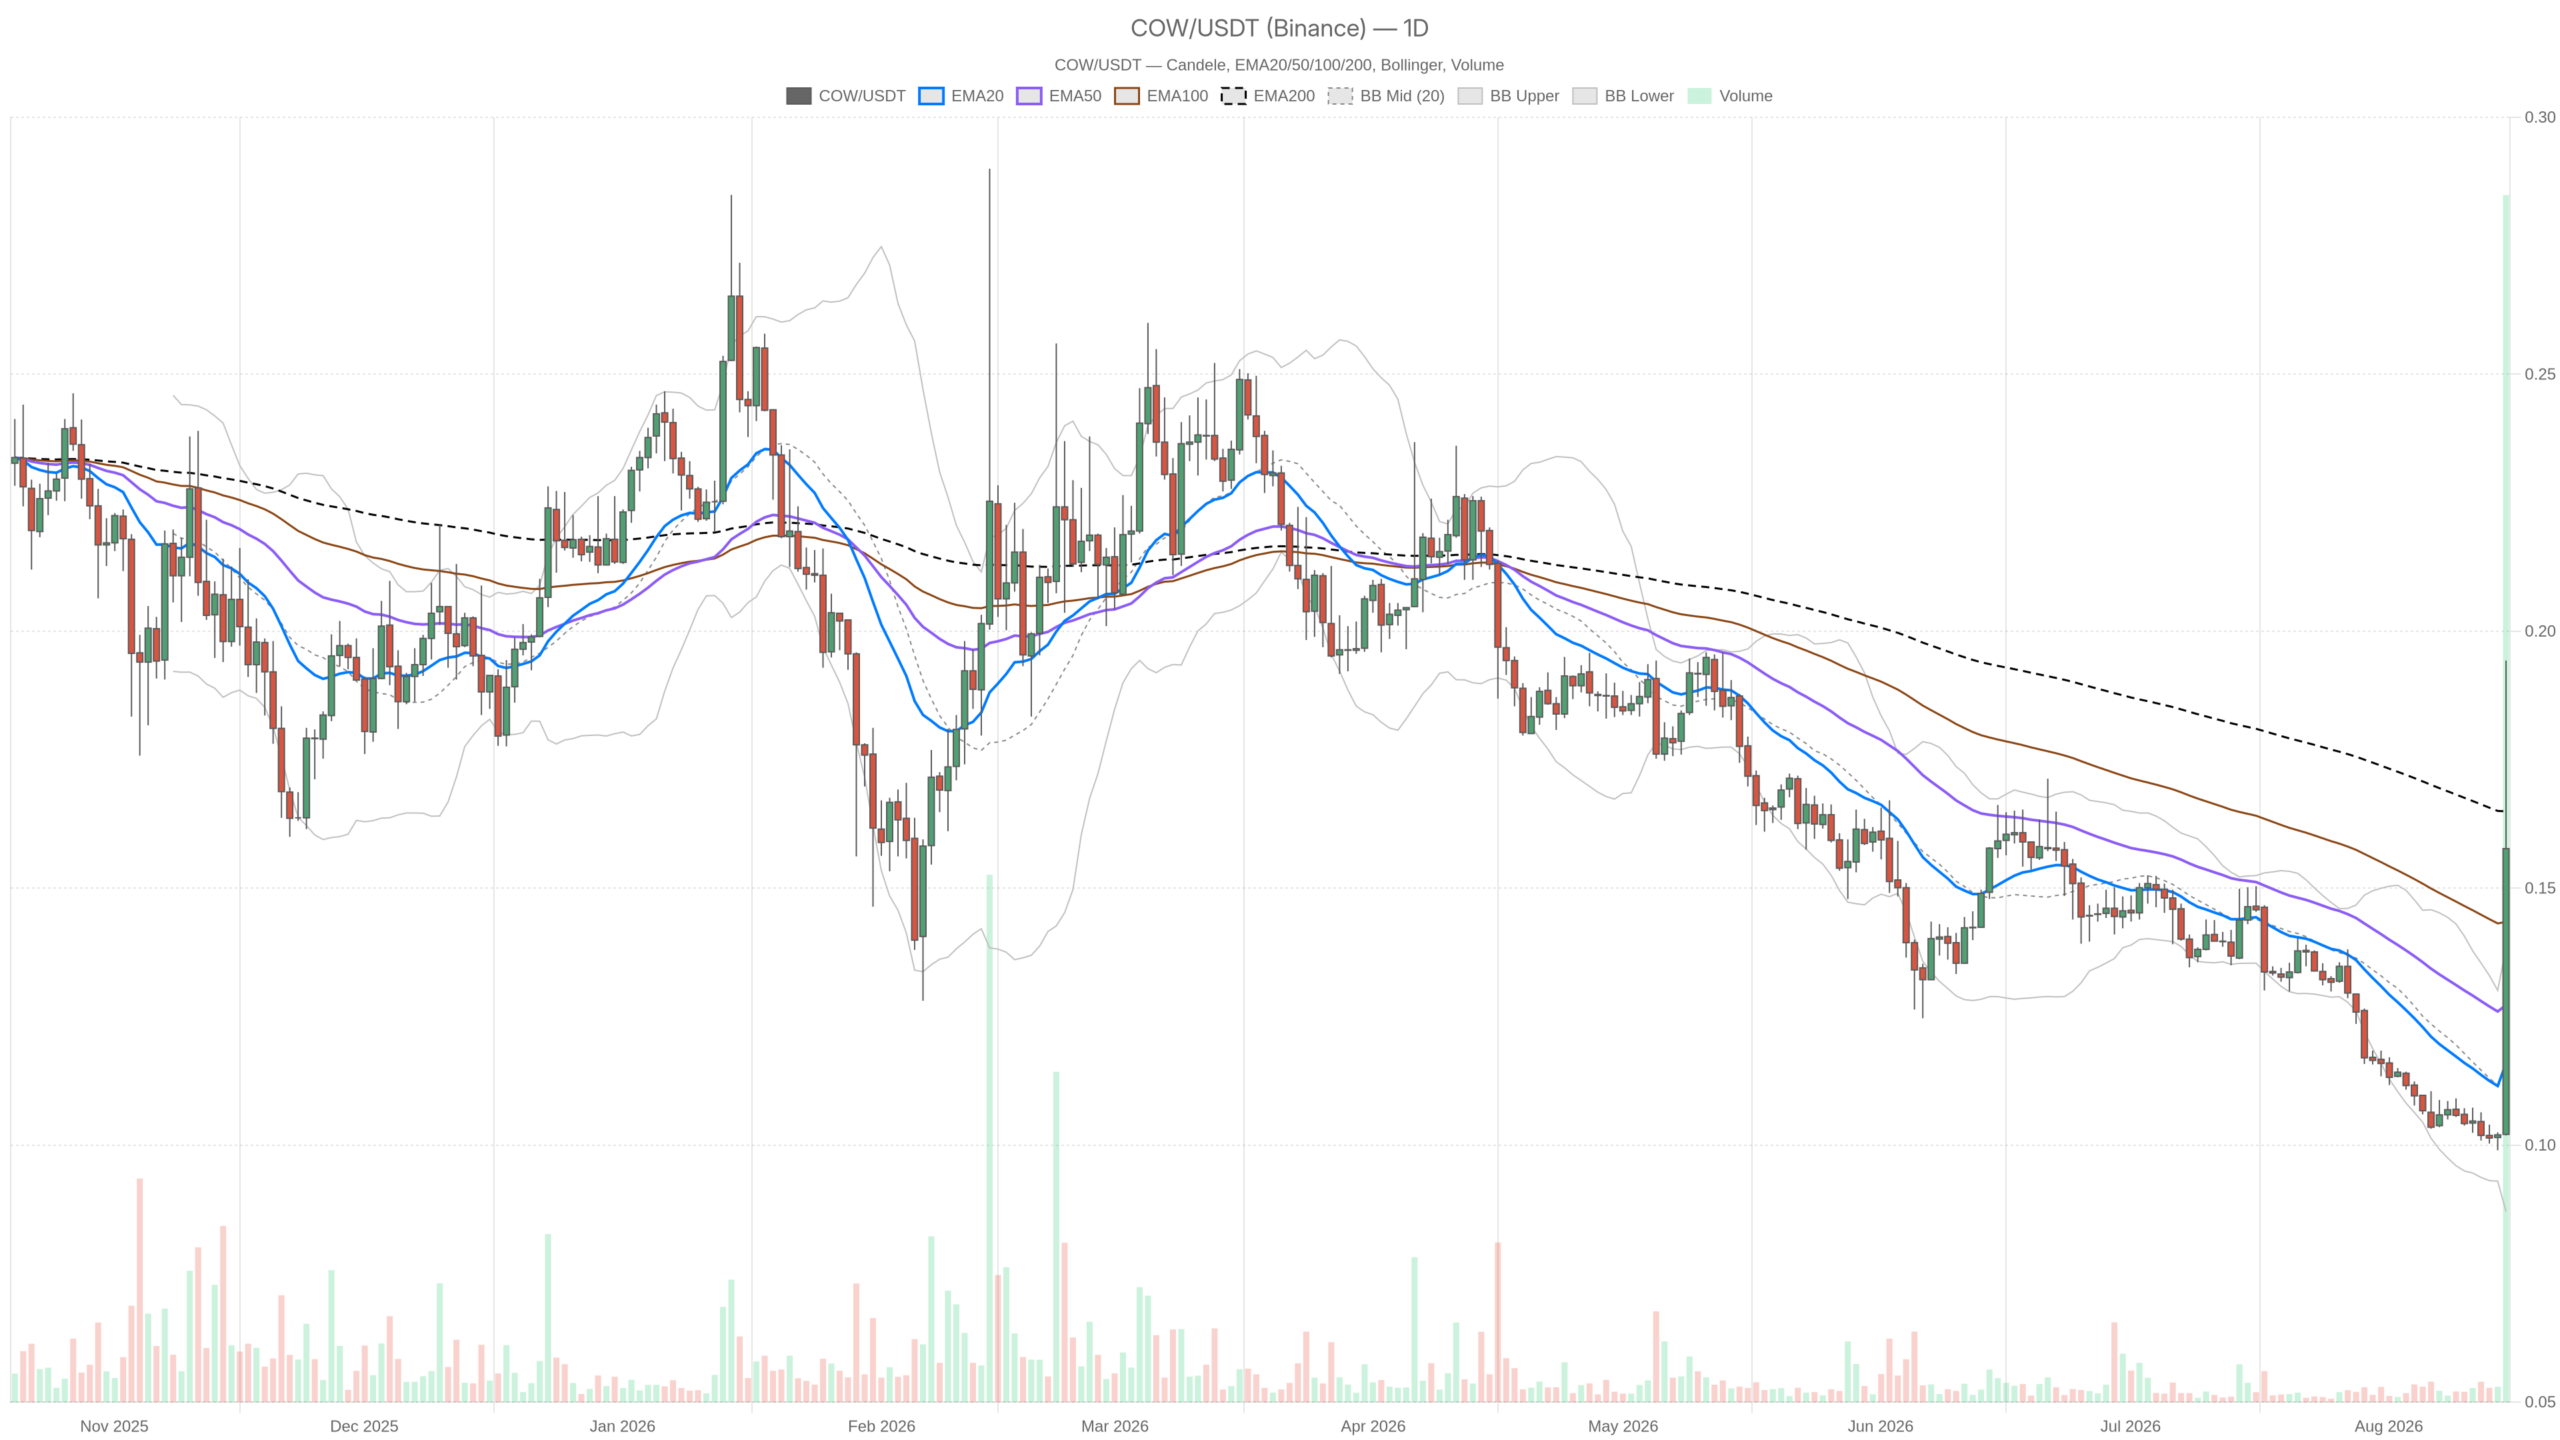 COW/USDT — daily chart with candlesticks, EMA20/EMA50 and volume.
Key takeaways
- CoW Protocol trades at 0.16 as of August 15, 2026.
- Daily RSI sits at 75.59, deep in overbought territory above the upper Bollinger Band.
- The 1-hour chart keeps a bullish EMA stack, but 15-minute momentum is cooling.
- DEX fee data shows broad declines, including Curve DEX fees down 64.86% in one day.
- Key levels include the daily pivot at 0.15, resistance at 0.20, and support at 0.11.
Daily chart: overbought extension meets a neutral regime
The daily chart shows a neutral regime even though price trades above its shorter averages. COW closed at 0.16, above the 20-period EMA at 0.12 and the 50-period EMA at 0.13. It sits right on the 200-period EMA at 0.16. The rally is real, but it has not yet proven itself against the bigger trend.
The daily RSI at 75.59 is deep into overbought territory. Price also trades above the upper Bollinger Band at 0.14, with the mid-band at 0.11 and the lower band at 0.09. A daily close above the top band is usually a warning that the move has outrun itself in the short term. It is not necessarily a reversal signal, but it flags a possible pullback toward the band’s mid-line.
The daily MACD also backs up that caution. The line sits at 0 with the signal at -0.01, essentially flat. There is no strong bullish thrust behind this move on the higher timeframe. Daily pivots put the pivot point at 0.15, resistance R1 at 0.20, and support S1 at 0.11. Price trades above the pivot. The 0.20 level is the next logical target if buyers stay in control, and 0.11 is where the bullish case would start to look shaky.
1H structure confirms the uptrend, 15m shows momentum losing steam
The 1-hour chart confirms a more constructive uptrend. The EMA stack is bullish. The 20 EMA sits at 0.13, the 50 EMA at 0.11, and the 200 EMA at 0.11, all below the 0.16 close. RSI is also stretched at 74.96. Unlike the daily, the 1H MACD confirms momentum: the line at 0.02 sits above the signal at 0.01 with a positive histogram of 0.01.
That is the tension in this CoW Protocol crypto setup. The daily is overbought and unconfirmed, while the 1H is overbought but momentum-positive. Both timeframes agree price is stretched, yet they disagree on how much fuel remains.
Drop down to the 15-minute chart and the picture cools further. RSI has pulled back to 54.76, a neutral reading that suggests the aggressive push has stalled without breaking structure. The MACD is essentially flat, with the line and signal both at 0.01 and the histogram at 0. Price sits almost exactly on its 20 EMA at 0.16, while the 15m pivot, R1, and S1 cluster around the same level. In practical terms, the market is pausing at a decision point with no clear breakout or rejection.
Market backdrop: fear persists even as total market cap ticks higher
The broader crypto market remains cautious even as total capitalization ticks higher. Total crypto market capitalization sits at roughly $2.252 trillion, up a modest 0.55% over 24 hours. Bitcoin dominance remains elevated at 56.10%. The Fear & Greed Index prints 34, firmly in Fear territory. This combination usually means altcoins need their own catalyst to outperform rather than riding a broad risk-on wave.
Meanwhile, the DeFi side adds another layer of nuance. Fee data across major decentralized exchanges shows broad-based weakness. Uniswap V3 fees are down 5.78% over one day, 24.89% over seven days, and 48.74% over 30 days. Uniswap V4 shows a similar pattern, down 19.35% daily and over 50% on the monthly comparison. Curve DEX fees have collapsed 64.86% in a single day and 74.56% over the week. Fluid DEX and Ekubo also post steep monthly declines.
Since CoW Protocol operates as a trading and settlement layer within this same DEX ecosystem, the sector-wide fee contraction is worth flagging. The technical chart is stretched to the upside even as underlying DeFi trading activity appears to be cooling. It does not invalidate the price action, but it reminds us the rally is not obviously backed by a broader surge in on-chain volume.
Bullish and bearish scenarios
The bullish case rests on the 1-hour structure holding. If COW defends the daily pivot at 0.15 and keeps the 1H EMA stack intact, a continuation toward the R1 resistance at 0.20 becomes realistic. The key zone is 0.11, where the 50 and 200 EMAs converge. The 1H MACD histogram is still positive, which helps. Buyers would need to absorb the overbought reading without a sharp daily close below the upper Bollinger Band at 0.14. The 15m RSI would ideally stabilize above the 50 line.
The bearish case is built on what is flagging caution right now: an RSI of 75.59 on the daily and a close above the upper Bollinger Band. Historically, that kind of overextension tends to resolve with at least a partial pullback toward the band’s mid-point at 0.11 or the daily EMA50 at 0.13. A break below the daily S1 support at 0.11 would signal the push has run out of steam. The same applies to a loss of the 1H EMA50/200 cluster near that level.
Positioning and risk
Right now, COW/USDT is a market where timeframes tell slightly different stories. The daily is stretched and unconfirmed. The 1H is bullish but also overbought, and the 15m is simply pausing. That is not a setup that rewards conviction in either direction without confirmation. The next few candles on the hourly and daily charts will likely decide the outcome. Either this turns into a breakout toward 0.20 or a reversion toward the 0.11 to 0.13 zone.
Volatility, based on the ATR readings around 0.01 across timeframes, is not extreme in absolute terms. Relative to a 0.16 price, it is enough to produce meaningful swings quickly. Given the cautious Fear & Greed reading and the softening DEX fee trend, this is a moment to watch price react at key levels. There is no reason to assume the move extends in a straight line.
FAQ
What is the current price of CoW Protocol?
As of August 15, 2026, CoW Protocol trades at 0.16.
Is CoW Protocol overbought right now?
Yes. The daily RSI sits at 75.59, deep in overbought territory, and price trades above the upper Bollinger Band at 0.14.
What are the key levels to watch for COW?
The daily pivot is at 0.15, resistance R1 is at 0.20, and support S1 is at 0.11. The 0.11 to 0.13 zone is the main downside area.
Disclaimer: This article is for informational purposes only and does not constitute financial advice, an investment recommendation, or a solicitation to buy or sell any financial instrument or cryptocurrency. The analysis provided is not indicative of future results. Investing in crypto assets and financial markets carries a high risk of capital loss. Always do your own research (DYOR) and consult a qualified financial advisor before making any decision.
Article produced with the assistance of artificial intelligence and reviewed by the editorial team.




 English (US) ·