The post DOGE Price Eyes Triangle Breakout: Can It Surpass $0.50? appeared first on Coinpedia Fintech News
Amid the growing bullish market, Dogecoin is sustaining its bullish trend and preparing for a new breakout rally. With buyers keeping the market price floating above the $0.40 mark, the chances of a bullish trend have significantly increased.
With the broader market bounce back, the DOGE coin could witness a surge beyond the $0.50 psychological mark. So, will the biggest meme coin surpass this psychological barrier? Let’s find out in our latest DOGE coin price analysis.
Dogecoin Price Analysis
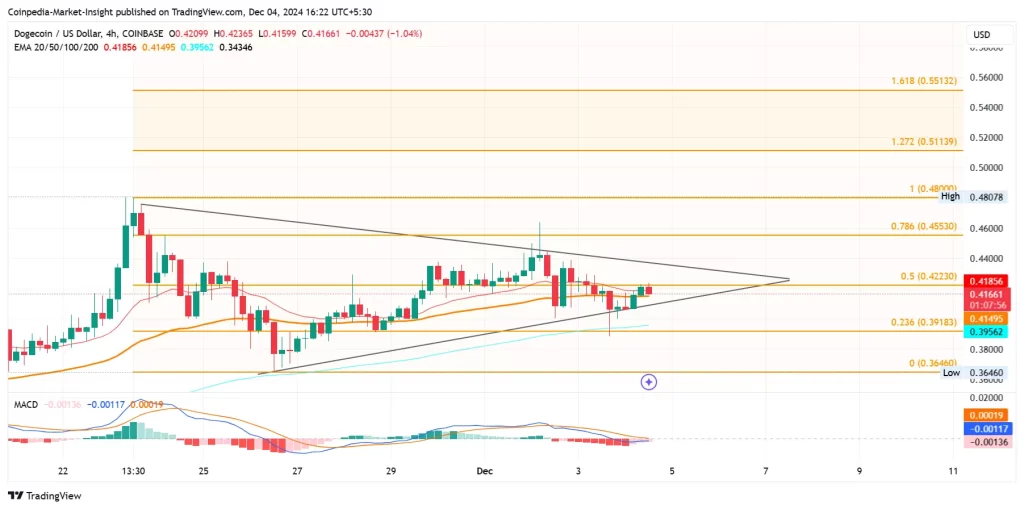
In the 4-hour chart, the DOGE price action showcases a triangle pattern formation. This consolidation within the two converging trend lines comes after a massive overrun.
Over the past 30 days, the DOGE price action has given substantial returns, driving the memecoin rally. The bullish rally now accounts for a price surge of nearly 175% over the last 30 days.

Currently, the DOGE price action showcases a bounce back from the support trend line, creating two consecutive bullish candles. However, the DOGE price struggles to surpass the 50% Fibonacci level at $0.423.
With a pullback of 1.04% over the last 4 hours, the supply pressure and the crucial Fibonacci resistance keep the bullish growth under check. However, the short-lived recovery rally resulted in a merger of the MACD and signal lines.
With this, the indicator prepares for a bullish crossover if the uptrend survives. The 50% Fibonacci level breakout will challenge the overhead resistance trendline, attempting to break the triangle pattern.
Dogecoin Targets $0.50 Breakout.
Based on the Fibonacci levels, the triangle breakout rally will challenge the 78.60% Fibonacci level at $0.4553.
The 52-week high is currently registered at $0.48078, and the breakout rally could surge to 1.272 Fibonacci level at $0.5113. This will result in a new 52-week high in DOGE coin prices and mark a significant milestone of surpassing the $0.50 psychological mark.
Conversely, a breakdown below the local support trend line will test the 23.60% Fibonacci level at $0.39183. The rising 50 and 100 EMA lines in the 4-hour chart act as dynamic support levels.
Read More: Dogecoin Price Prediction 2024, 2025-2030.
FAQs
Dogecoin consolidates within a triangle pattern and bounces off the support trend line. The price struggles to surpass the 50% Fibonacci level at $0.423.
Resistance lies at the 50% Fibonacci level ($0.423), with targets at $0.4553 and $0.5113. Key support levels are at $0.39183 and the rising 50 and 100 EMA lines.
A triangle breakout supported by bullish technical indicators and rising EMA lines could push DOGE beyond the psychological level of $0.50, with the potential to hit $0.5113.

 12 hours ago
12


 English (US) ·