
 3 months ago
79
3 months ago
79
- Analysts believe Dogecoin’s current chart structure closely resembles the setup that preceded the 2020-2021 rally.
- The $0.08 to $0.11 zone continues acting as a major accumulation and support area for DOGE.
- A breakout above the long-term descending channel could strengthen bullish projections targeting the $2 region.
Dogecoin is once again finding itself at the center of market discussions, not because of celebrity endorsements or viral social media trends, but because of a technical setup that some analysts believe looks remarkably familiar. After spending months consolidating near long-term support levels, DOGE appears to be entering a phase that could determine the direction of its next major move.
According to crypto analyst Crypto Patel, investor behavior around Dogecoin has followed a fairly predictable pattern over the years. Interest tends to disappear when prices fall and excitement returns only after the market begins moving higher. It’s a cycle that has repeated itself multiple times, and some traders believe the current environment may be setting the stage for another chapter.
What’s particularly interesting is that Dogecoin has managed to remain above a historically important support zone despite extended market weakness. That resilience has kept longer-term bullish scenarios alive, even while short-term momentum remains uncertain.
Analysts Compare Current Structure to the 2020-2021 Setup
A closer look at the charts reveals why some market watchers are becoming increasingly optimistic.
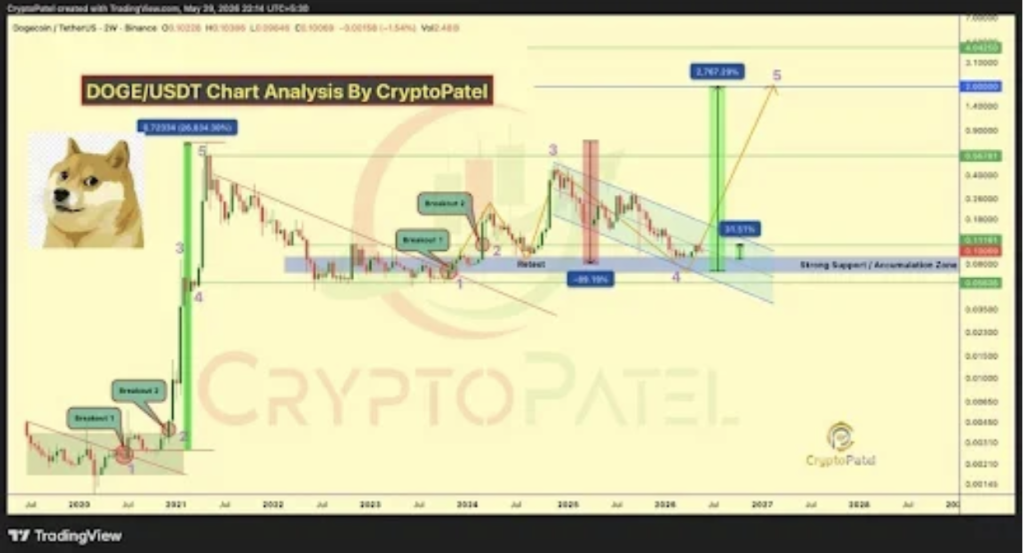
Crypto Patel points to similarities between the current market structure and the pattern that developed before Dogecoin’s explosive rally during the 2020-2021 cycle. Following its previous peak, DOGE entered a lengthy corrective phase that stretched through 2022, 2023, and much of 2024. During that period, the asset traded inside a downward-sloping channel while forming what appears to be a corrective Elliott Wave structure.
Throughout that decline, one region consistently attracted buyers. The range between $0.08 and $0.11 repeatedly acted as a demand zone where accumulation appeared to take place. Every time price drifted into that area, market participants stepped in to absorb selling pressure.
Those repeated reactions have turned the zone into one of the most important support areas on Dogecoin’s long-term chart.
Could DOGE Be Preparing for a Wave Five Rally?
From a technical perspective, some analysts believe the lengthy correction may be nearing its conclusion.
Based on Elliott Wave analysis, Dogecoin could be approaching the end of its fourth-wave correction. If that interpretation proves accurate, the next major move would be a fifth-wave advance, potentially marking the final leg of a larger bullish cycle.
The first step toward validating that scenario would be a decisive breakout above the descending channel that has contained price action for years. Such a move would signal that buyers are regaining control and that the broader trend may be shifting.
Looking further ahead, Patel’s analysis combines historical cycle behavior with Fibonacci projections to estimate possible upside targets. Under a strong bullish scenario, Dogecoin could potentially rise toward the $2.00 to $2.20 range. That would represent a gain of more than 2,700% from current levels and place DOGE well above its previous all-time high near $0.74.
Of course, those projections remain speculative and depend on multiple factors aligning. Still, the combination of long-term support, historical cycle similarities, and accumulation signals has attracted attention.
Rising Trendline Continues Supporting Price Action
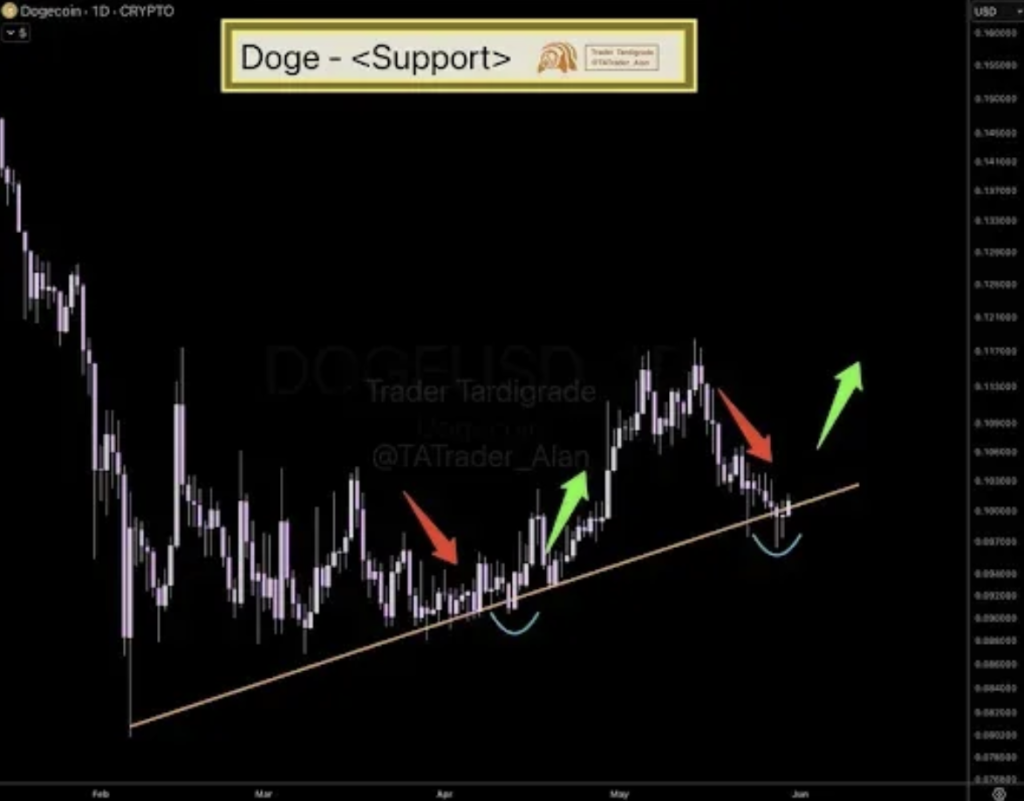
While longer-term forecasts focus on multi-year targets, shorter-term traders are paying close attention to a rising support trendline that has guided Dogecoin’s movement since February.
Analyst Trader Tardigrade recently highlighted this ascending trendline, noting that it connects several higher lows formed throughout the year. The line has already been tested successfully on multiple occasions, including a significant bounce in April that reinforced its importance.
Now, after a recent pullback, Dogecoin has once again returned to that same support area.
The fact that buyers continue defending higher lows is generally considered a constructive sign. Rising lows often indicate growing demand, even during periods when broader market sentiment remains cautious.
Key Levels Could Determine Dogecoin’s Next Move
For now, the technical outlook remains balanced but increasingly interesting.
As long as Dogecoin stays above its ascending support trendline, bulls retain a reasonable argument that the broader recovery structure remains intact. In that scenario, a move toward the $0.11 to $0.12 range becomes increasingly plausible.
However, support levels only matter until they fail. If sellers manage to push DOGE below the trendline and maintain control, a deeper correction could follow before the market attempts another recovery.
The coming weeks may therefore prove important. Dogecoin has spent years building this larger structure, and price now sits near levels that could influence its next major cycle.
Whether the market ultimately follows the path outlined by bullish analysts remains uncertain. What is clear, though, is that Dogecoin continues holding a critical support region while historical chart patterns begin drawing comparisons to one of the most explosive rallies in crypto history.
Disclaimer: BlockNews provides independent reporting on crypto, blockchain, and digital finance. All content is for informational purposes only and does not constitute financial advice. Readers should do their own research before making investment decisions. Some articles may use AI tools to assist in drafting, but every piece is reviewed and edited by our editorial team of experienced crypto writers and analysts before publication.








 English (US) ·