Dogecoin (DOGE) price has risen 7% in the last 24 hours, as it tries to regain its $50 billion market cap. Trading volume has surged to $3 billion during this period.
Key technical indicators, such as the Ichimoku Cloud, signal strong upward momentum. If the current trend continues, DOGE could break through key resistance levels and achieve significant short-term gains.
DOGE Ichimoku Cloud Shows a Bullish Setup
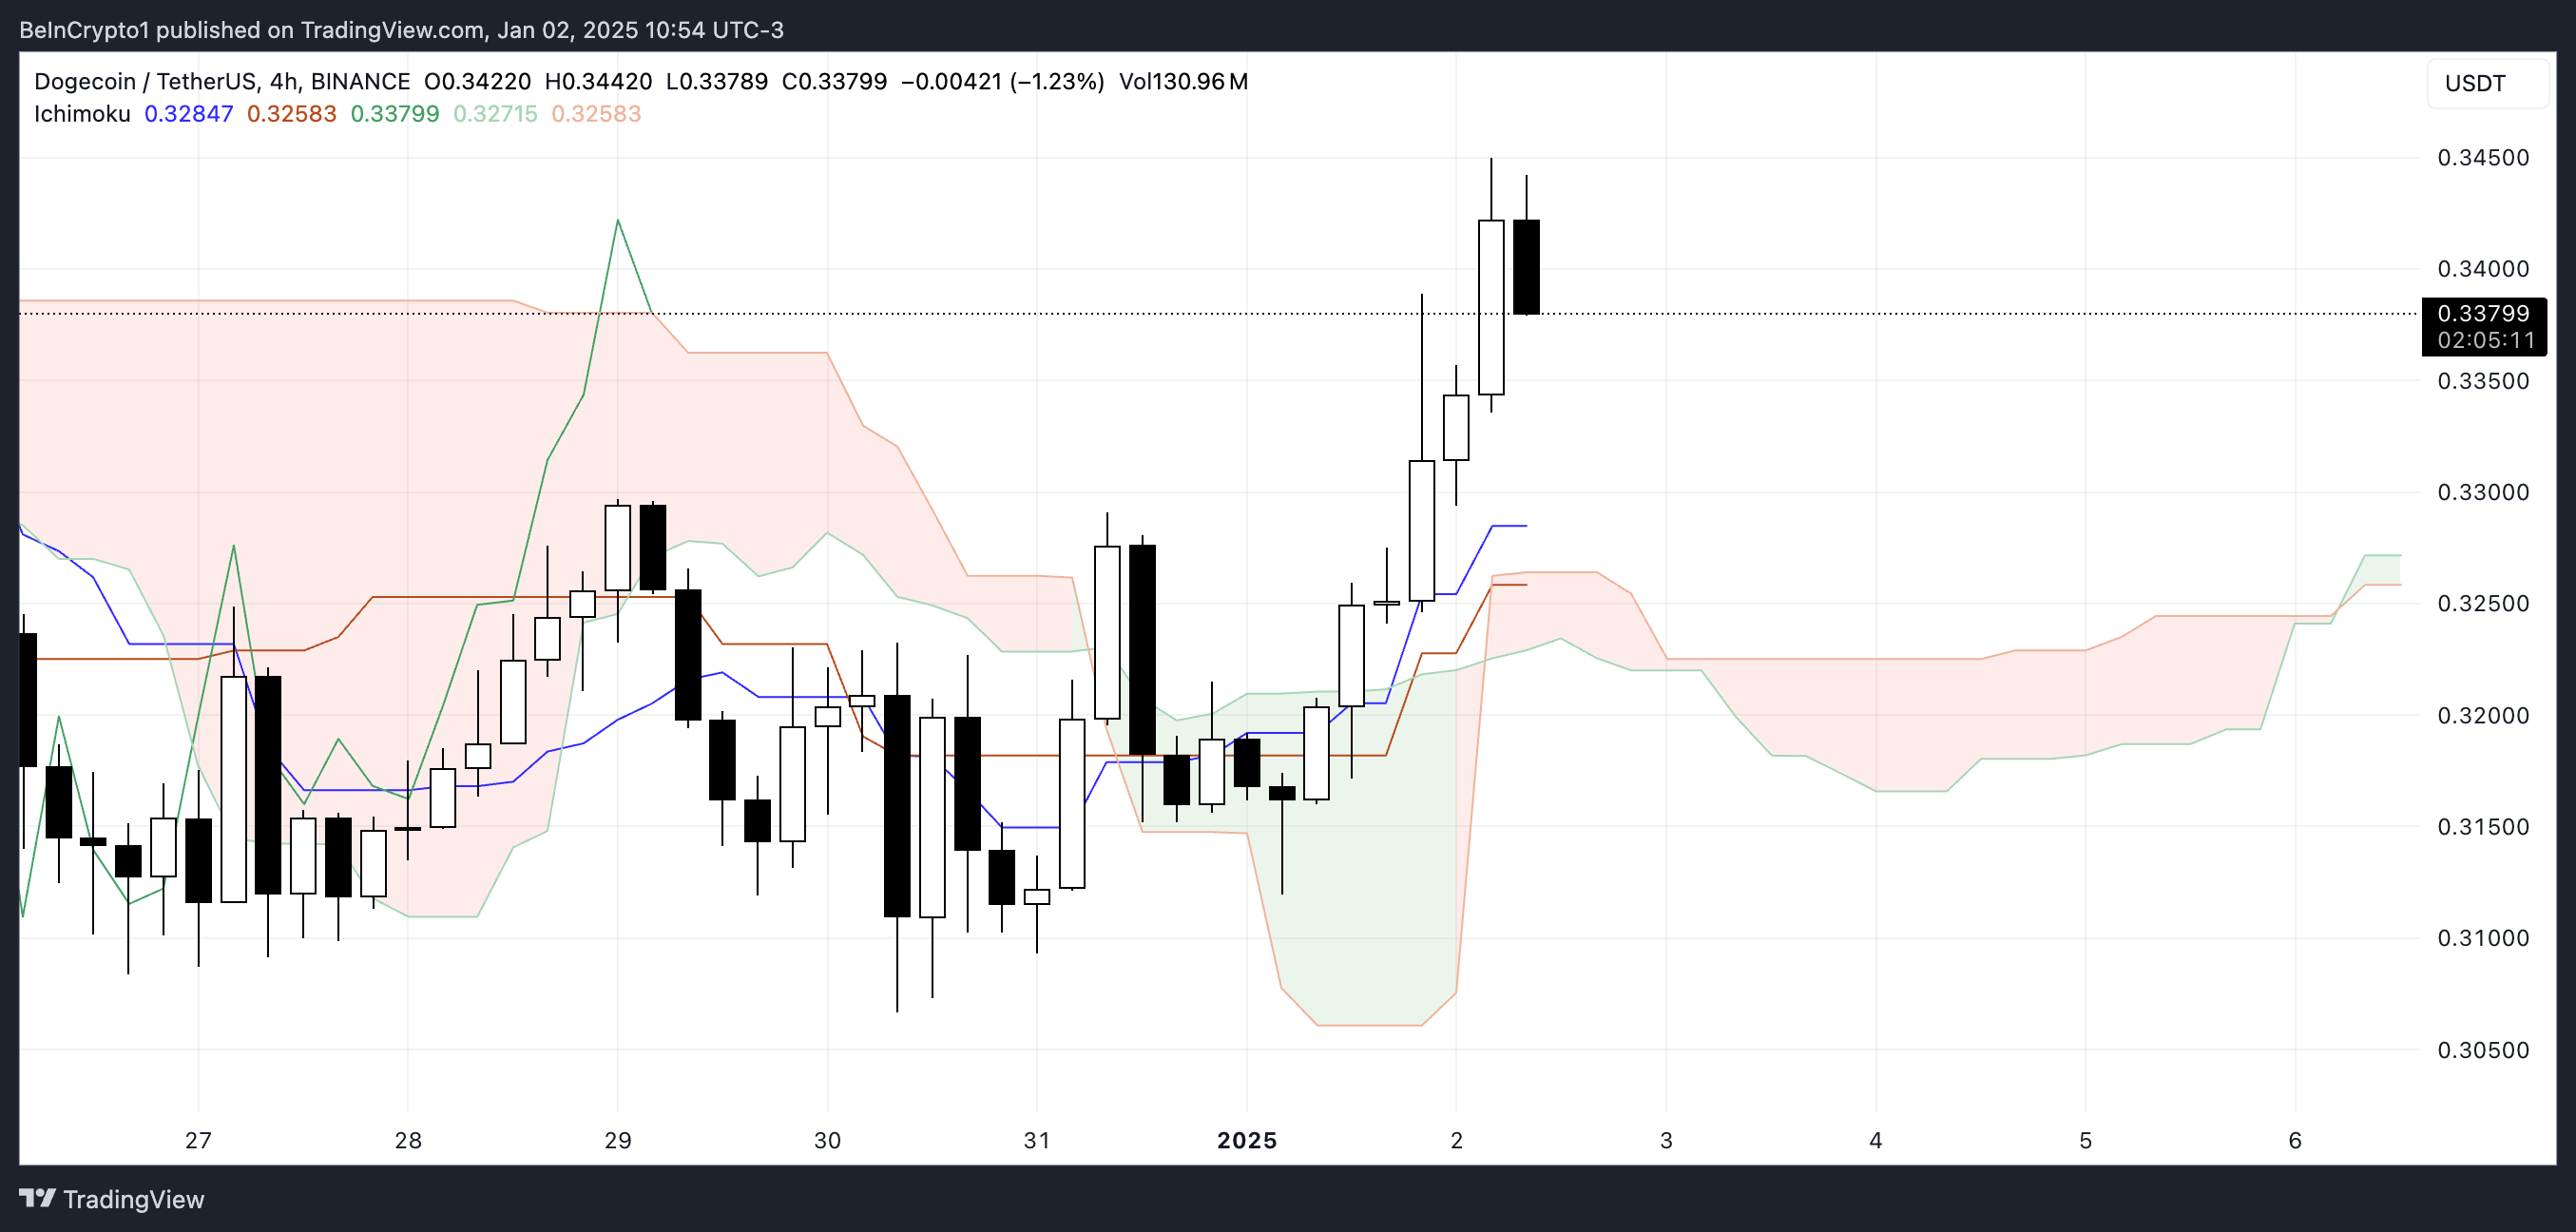
The Ichimoku Cloud chart for Dogecoin reveals a bullish setup. The price broke above the red cloud, indicating a shift in momentum, as buyers have gained control, pushing the price higher.
The red cloud, formed by Senkou Span A and Senkou Span B, previously reflected bearish sentiment, but DOGE move above it suggests a change in sentiment. The current green cloud ahead further supports this bullish outlook, as it signals potential continuation of upward momentum.
 DOGE Ichimoku Cloud. Source: TradingView
Additionally, the blue Tenkan-sen (conversion line) has crossed above the orange Kijun-sen (baseline), further confirming the bullish trend. This crossover highlights short-term price strength exceeding the longer-term baseline. The green lagging span (Chikou Span) is also positioned above the price and the cloud, signaling that the current bullish trend is consistent with prior price movements.
For DOGE price to maintain its upward trajectory, it must hold above the cloud and build on this momentum. However, any failure to sustain these levels could lead to consolidation or a retracement back into the cloud.
Dogecoin DMI Indicates Potential for a Stronger Uptrend
Dogecoin DMI chart shows its ADX currently at 21.5, which is up significantly from 11.9 just yesterday, indicating a strengthening trend. The rise in ADX suggests that the uptrend is gaining momentum, reflecting growing market confidence and increased buying activity.
The +DI (Directional Indicator) has surged to 34.6 from 15 over the past two days, signaling strong buying pressure, while the -DI has dropped to 11.1 from 20, reflecting a significant reduction in selling pressure. This divergence between the +DI and -DI reinforces the dominance of bullish momentum in the market.
 DOGE DMI. Source: TradingView
The Average Directional Index (ADX) measures trend strength on a scale from 0 to 100, with values above 25 indicating a strong trend and readings below 20 suggesting weak or absent trend strength. DOGE’s ADX at 21.5 shows that the trend is on the verge of becoming firmly established, especially given the sharp rise in +DI and the decline in -DI.
In the short term, this setup suggests that DOGE price is likely to continue its upward trajectory as buyers are in control. However, for the trend to sustain, the ADX must continue rising and hold above 25 to confirm a strong uptrend.
DOGE Price Prediction: Will It Rise 22% Soon?
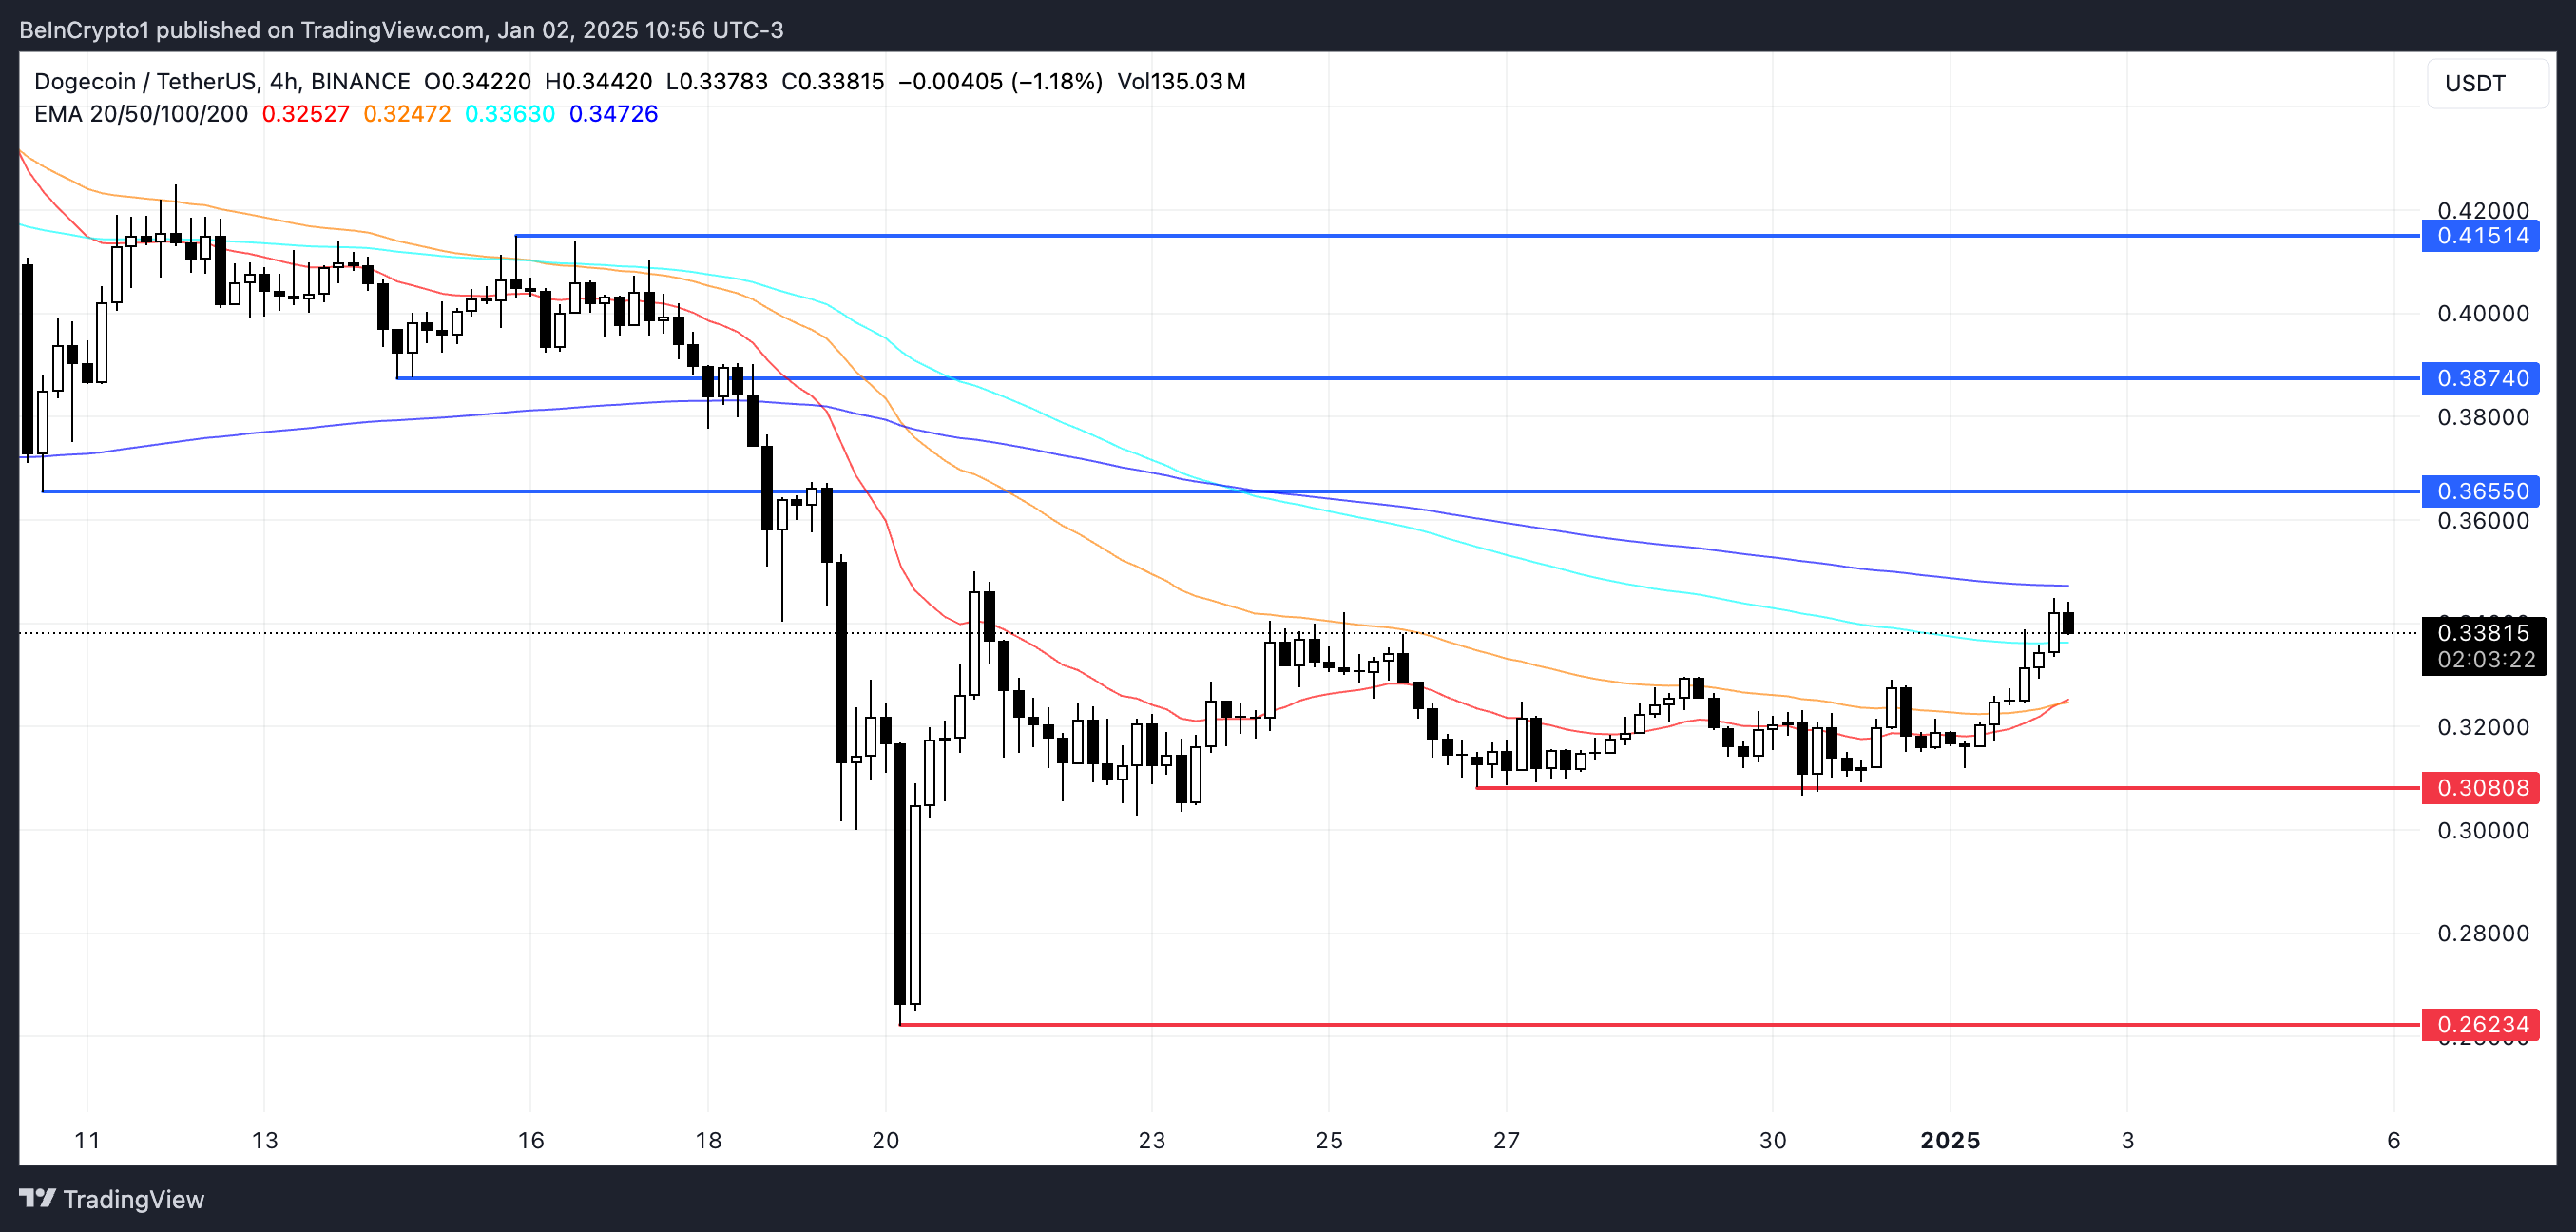
Dogecoin price EMA lines suggest that a Golden Cross may form soon, a bullish indicator where the short-term EMA crosses above the long-term EMA. This potential crossover could signal a continuation of the uptrend, allowing DOGE to test the resistance at $0.36.
If this level is broken, DOGE price could aim for higher resistance levels at $0.387 and $0.415, representing a potential 22.7% price increase.
 DOGE Price Analysis. Source: TradingView
On the other hand, if the uptrend loses momentum and the market reverses, DOGE price could test its immediate support at $0.30. A failure to hold this level may lead to a sharper decline, with the next strong support at $0.26 coming into play.
For DOGE to maintain its upward trajectory, the Golden Cross would need to materialize, and buyers would need to drive the price through critical resistance levels.
The post Dogecoin (DOGE) Price Jumps 7% With Volume Hitting $3 Billion appeared first on BeInCrypto.

 2 days ago
20


 English (US) ·