
 8 months ago
51
8 months ago
51
- Dogwifhat ($WIF) is approaching a key resistance at $0.75, with a potential breakout that could push it toward $1.00 if buyers step in.
- The TD Sequential indicator has flashed a “9 Buy” signal, suggesting a possible bottom formation, but confirmation through price action is still needed.
- Analysts predict a long-term rally to $2.17 by 2025, but short-term risks remain, with the Fear & Greed Index at 44 and high volatility (24.22%) keeping the market on edge.
Dogwifhat ($WIF) has been in the spotlight lately, and for good reason. The memecoin, once soaring at all-time highs, has been battling a steep downtrend. But now, something interesting is brewing—technical indicators are flashing signs of a potential reversal.
With WIF hovering around $0.691, all eyes are on a critical resistance at $0.75. If it breaks through, $1.00 might not be far off. But can the momentum hold, or will another rejection send it spiraling lower?
Double Bottom Pattern: A Bullish Signal?
A glance at the 4-hour chart shows something intriguing—a double bottom pattern. If confirmed, this classic reversal structure could mark the end of WIF’s extended downtrend.
- From $5.50 to $0.691—WIF has been in freefall since its highs.
- The neckline sits at $0.75, acting as a make-or-break level for a potential recovery.
- A breakout past this mark could send WIF toward $1.00, according to chart projections.
For this bullish setup to play out, buyers need to step in aggressively and push past resistance. If they hesitate, bears might take control again.
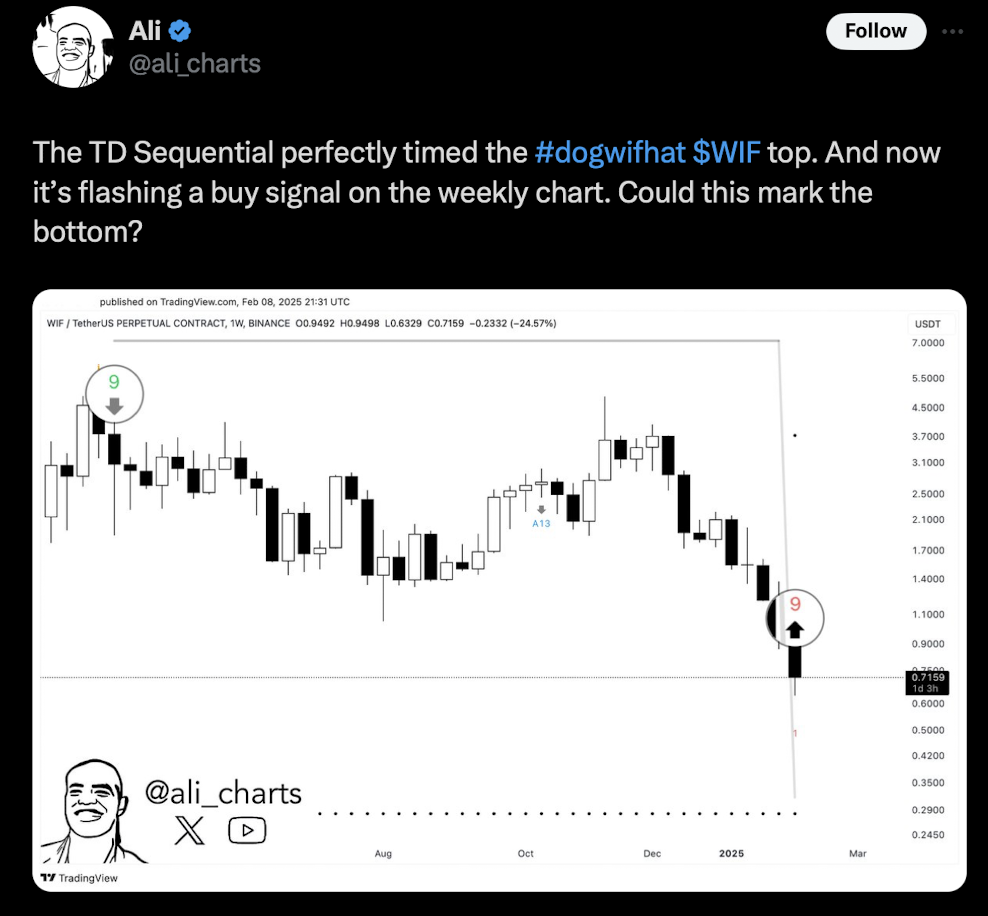
TD Sequential Flashes “9 Buy” Signal—A Bottom in Sight?
Market analyst Ali pointed out an interesting development—the TD Sequential indicator has printed a “9 Buy” signal on WIF’s weekly chart.
This technical setup often appears when an asset is oversold and due for a reversal. But, as always, a confirmation through volume and price action is needed before calling it a definitive bottom.
- From an 85% crash to a fresh low at $0.63, WIF has been in rough waters.
- The TD Sequential suggests sellers may be exhausted, but will buyers step in?
- Without strong follow-through, the signal may not hold, leaving WIF vulnerable.
A bounce from here could be big, but if momentum fades, expect further downside.
Technical Indicators Show Mixed Signals
- RSI at 37.75: Nearing oversold territory, hinting that selling pressure could be easing.
- MACD bullish crossover: The histogram flipped positive, and MACD lines are converging—a signal that bullish momentum may be building.
- Support at $0.68: WIF has seen multiple bounces from this level. Holding here is crucial for an upside move.
- Resistance at $0.75: This is the real test. If WIF fails to break through, another pullback could be on the cards.
Market Outlook: Can WIF Hit $2.17 by 2025?
Analysts are optimistic about WIF’s long-term potential, predicting a 225.76% gain by March 2025, which would send it to $2.17.
But in the short term, risks remain:
- Fear & Greed Index at 44 (Fear)—sentiment is still shaky.
- 27 out of the last 30 days were green, but volatility remains high at 24.22%.
- If WIF clears $1.00, analysts see $1.50 as the next target.
For now, all eyes are on $0.75. Break it, and we could see fireworks. Fail, and it’s back to the drawing board.


 English (US) ·