
 2 months ago
59
2 months ago
59
Over the last several days, the ENJ token has printed three explosive daily candles. So far, Enjin is up more than 300% in April, becoming one of the most explosive altcoins in the current market. But will this rally last?
Launched in 2017 by Enjin Pte. Ltd., Enjin Coin was one of the earliest blockchain projects to bridge gaming and blockchain technology, giving developers the tools to create and manage NFT-based in-game assets on Ethereum.
After enduring one of its most devastating bear markets ever — losing virtually all of its value and bottoming near $0.00042 by October 2025 — ENJ is now staging a breathtaking comeback.
ENJ Price Analysis: The Golden Pocket Showdown
On the daily timeframe, the macro Fibonacci retracement is drawn from the April 2025 high of $0.11839 down to the October 2025 low of $0.00042 — a near-total wipeout that erased years of gains.
From that catastrophic low, ENJ has now clawed its way back to test the 0.618 Fibonacci retracement level at $0.07332. This is the golden pocket, and the single most decisive resistance level on the entire macro chart.
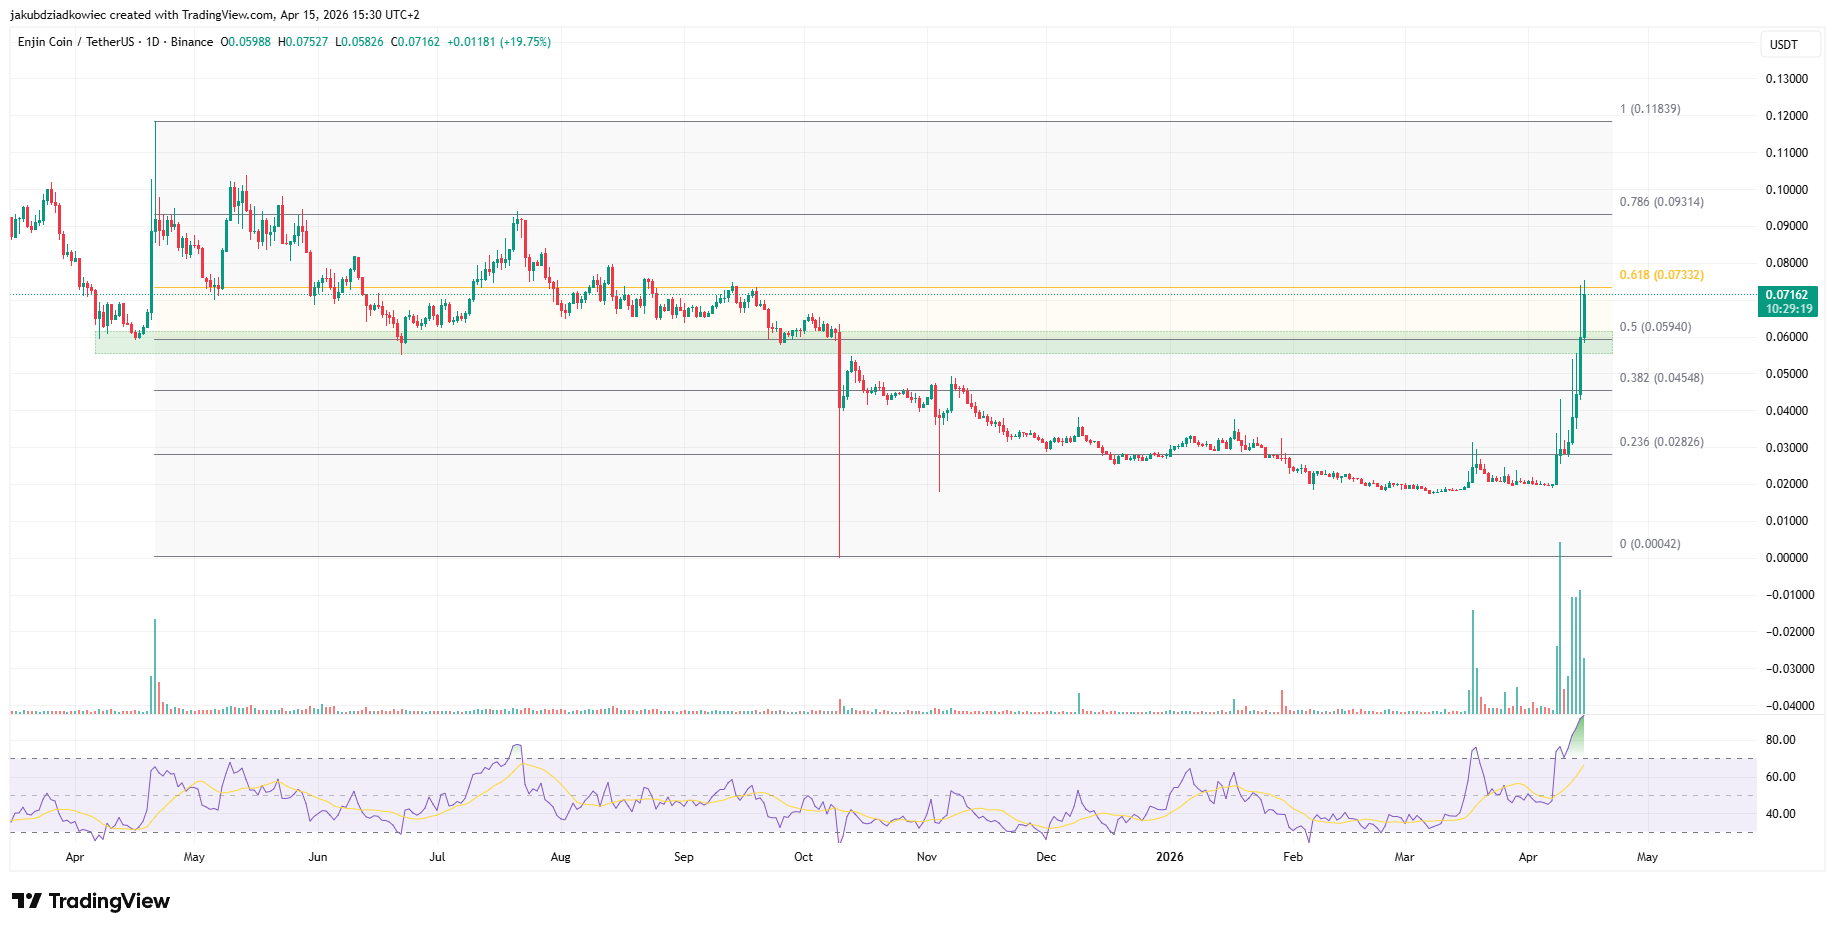 ENJ/USDT daily chart / Source: Tradingview
The rally is visually spectacular, but also volume-confirmed. Daily volume has grown consistently with each successive candle, reaching its highest levels in over a year.
The RSI has simultaneously rocketed to an extreme reading of 93.3. This is one of the most overbought readings this token has ever registered.
While extreme RSI can signal exhaustion, in the early stages of a genuine trend reversal, it often reflects momentum ignition rather than a tired top.
The critical test is whether ENJ can close daily above $0.07332 and flip the golden pocket from resistance to support.
Healthy Structure, But Warnings Flicker
Dropping to the one-hour timeframe reveals a textbook uptrend structure. Three clear higher highs (blue circles) — at approximately $0.043, $0.054, and $0.073 — have formed progressively. Each broken resistance subsequently confirmed as new support (green boxes).
This classic flip pattern is one of the most reliable hallmarks of a sustained uptrend rather than a chaotic pump-and-dump.
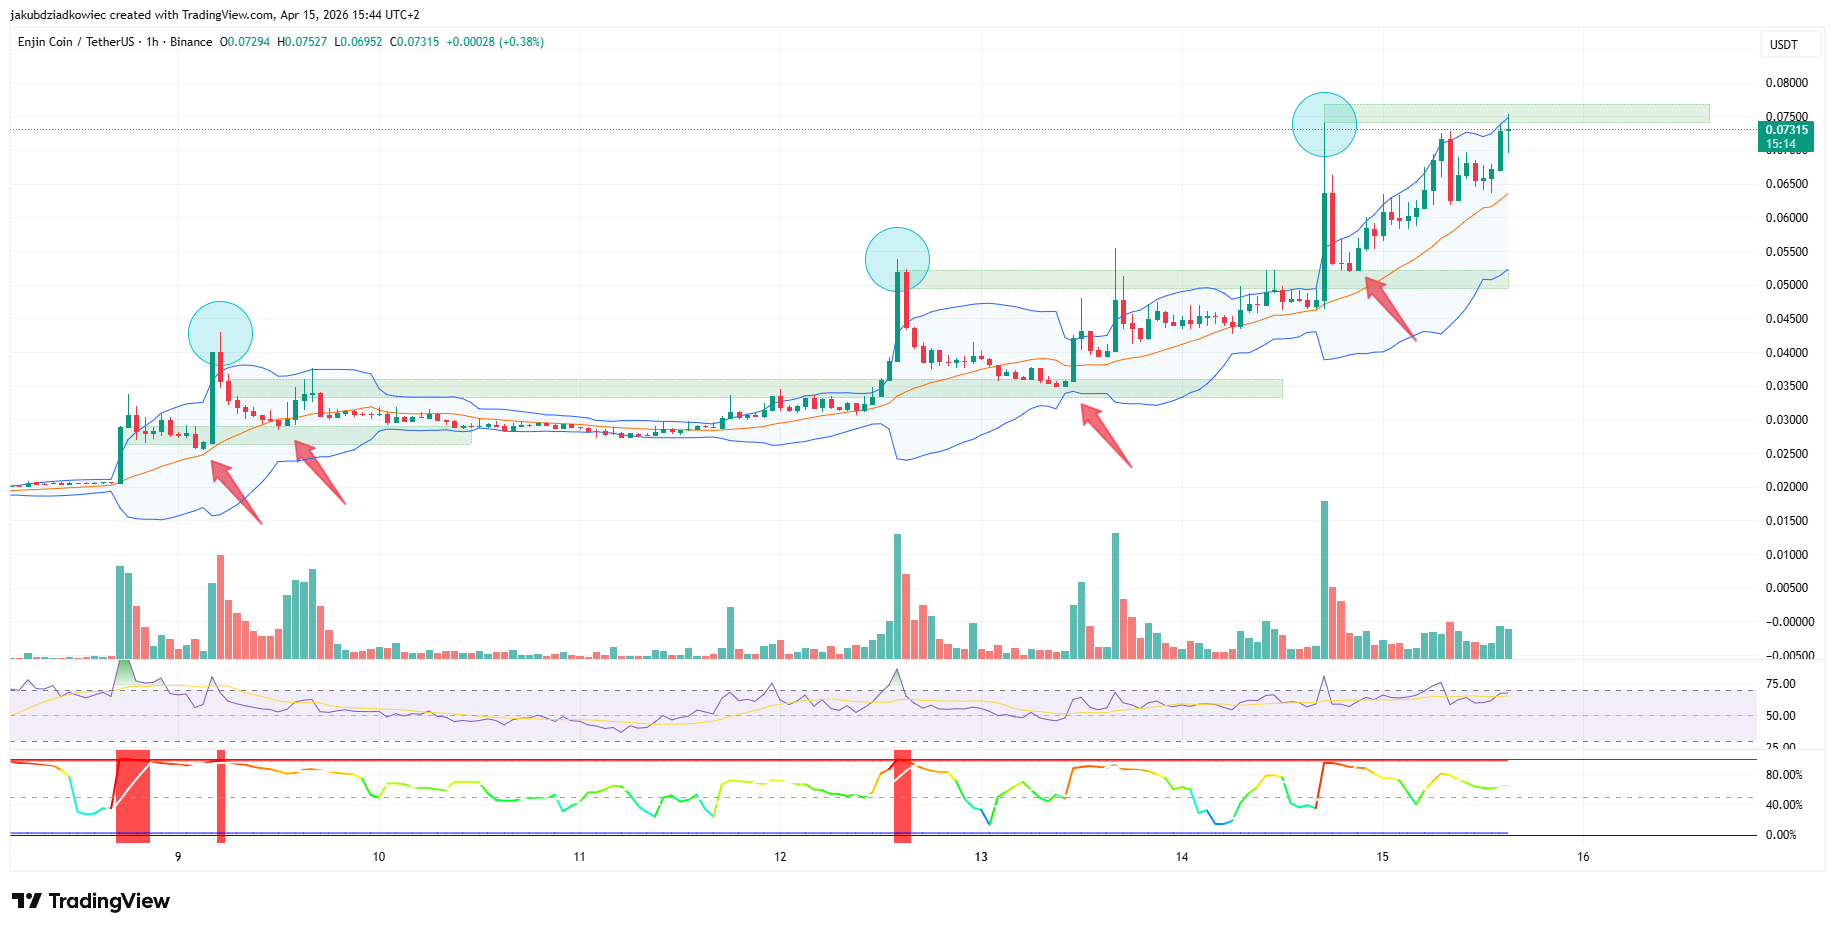 ENJ/USDT hourly chart / Source: Tradingview
Bollinger Bands (blue lines) tell a compelling story of their own. After weeks of tight compression, the bands began to aggressively expand from April 14 onwards, with the price riding the upper band in a sustained momentum burst.
However, two warning signals deserve attention. The RSI on the 1H is showing early signs of bearish divergence — price printing higher highs while RSI registers slightly lower highs.
Meanwhile, the BBWP indicator is flashing extreme volatility readings, suggesting the current explosive leg may be entering climax territory. Neither signal is a sell trigger in isolation, but together they demand respect.
On-Chain Data: The Bull Case Gets Stronger
The on-chain picture from Santiment may be the most compelling element of this entire analysis. Despite ENJ’s price nearly doubling over the past few days, exchange inflows have remained near zero, at just 19,600 tokens at the time of writing.
This is striking. During the February 2026 corrections, exchange inflow spiked aggressively as panicked holders rushed to sell. The silence now, at the peak of a historic rally, signals that current holders have absolutely no intention of distributing.
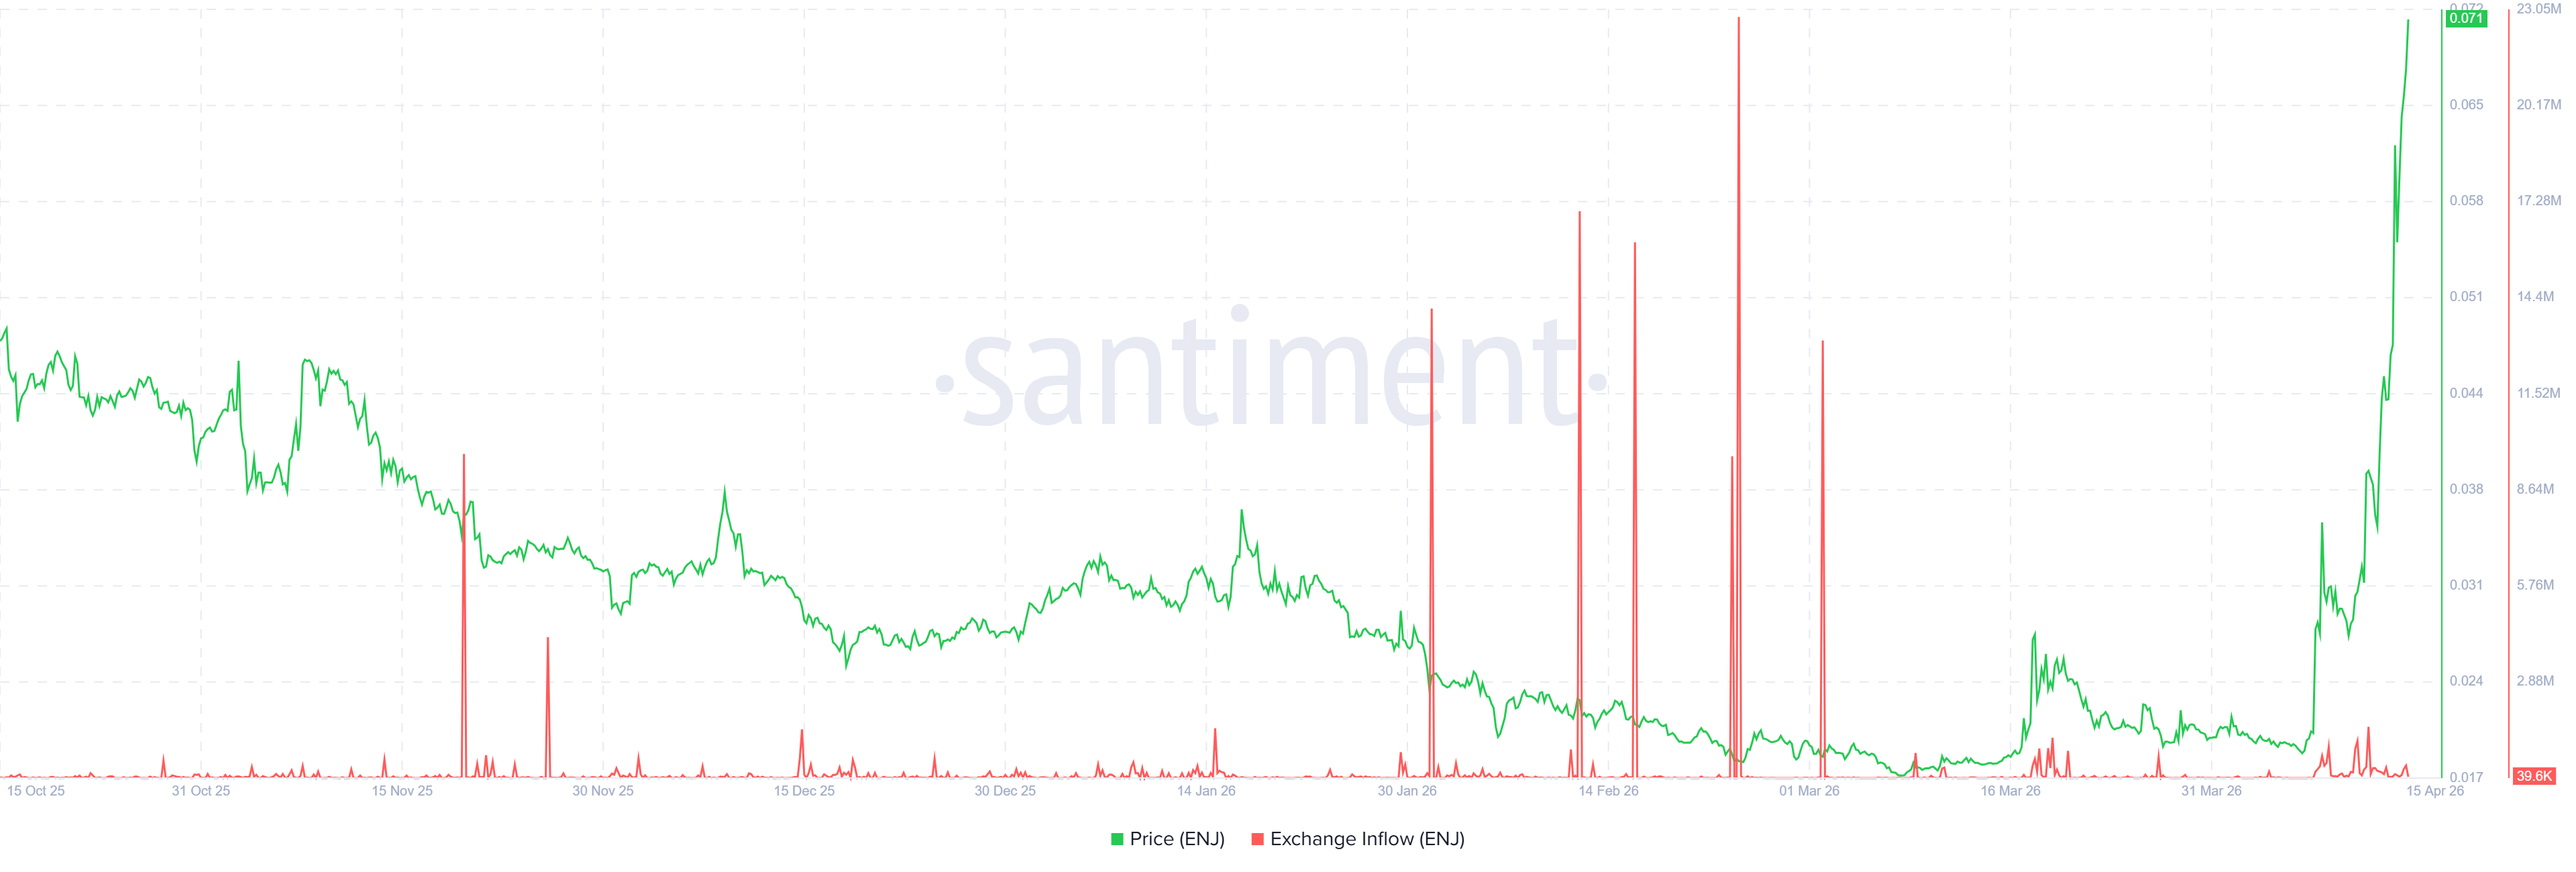 EnjinCoin Exchange Inflow / Source: Santiment
Active addresses paint an equally powerful picture. After months of subdued activity averaging just 50–150 daily addresses, ENJ’s active address count has exploded to 920 — the second highest reading in the entire six-month dataset.
Critically, this is not a one-day anomaly but a sustained multi-day surge, confirming that genuine new participants are flooding into the Enjin ecosystem.
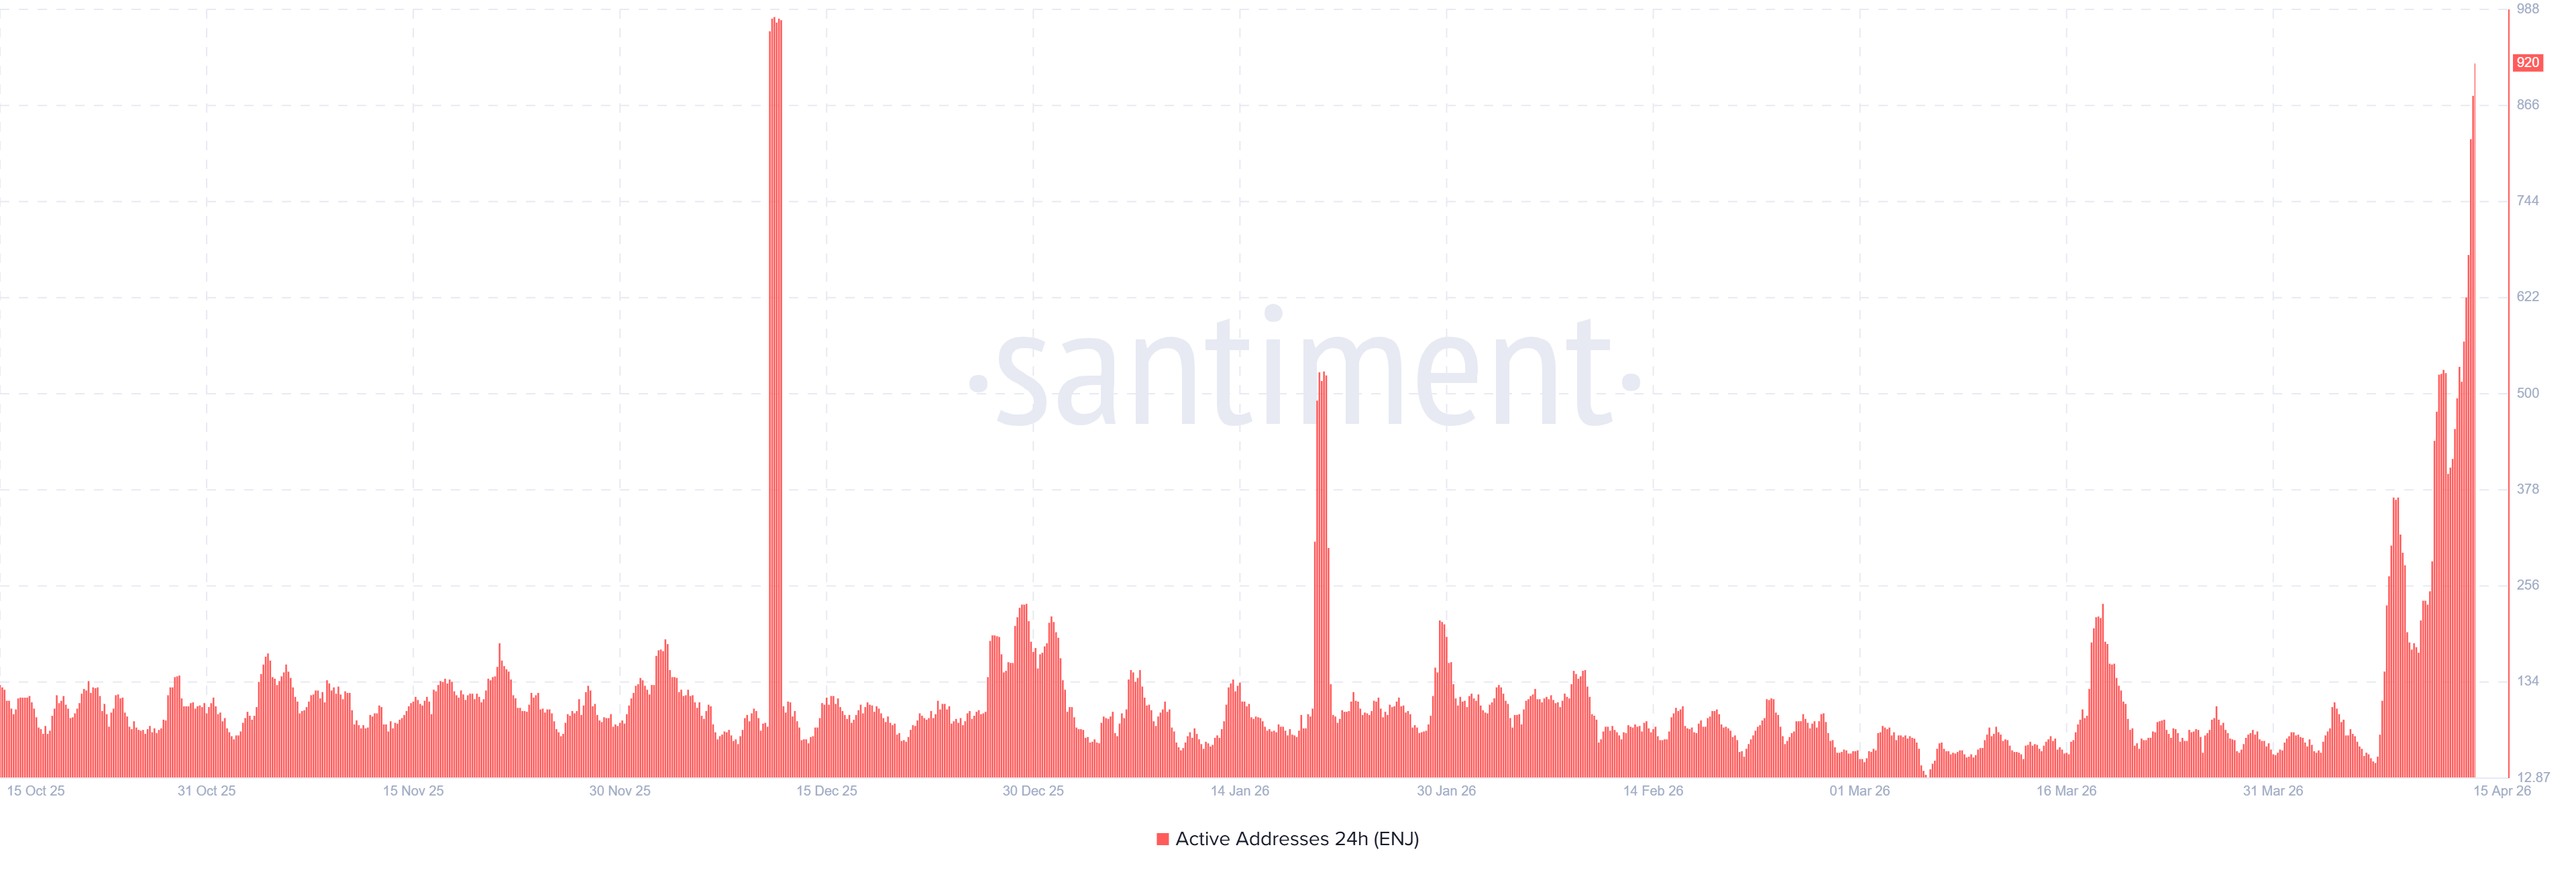 EnjinCoin Active Addresses / Source: Santiment
EnjinCoin Price Prediction: Two Scenarios
A daily close above the 0.618 Fibonacci level at $0.07332 would confirm golden pocket conquest and validate the macro trend reversal. The next logical target becomes the 0.786 Fibonacci level at $0.09314, a further ~30% move from current levels.
Rising volume, surging active addresses, near-zero exchange inflow, and a clean higher-high structure on the 1H all support this outcome. This scenario is invalidated by a daily close back below $0.05940 — the 0.5 Fibonacci level.
However, failure to maintain above $0.07332 with an RSI at 93.3, 1H bearish divergence, and extreme BBWP readings creates a dangerous cocktail for a sharp reversal.
Initial downside targets sit at $0.05940 (0.5 Fib), with deeper support at $0.04548 (0.382 Fib) if selling accelerates. This bearish scenario for EnjinCoin is invalidated by a clean daily close and sustained hold above $0.07500.
The post Enjin Coin Explodes 300% From Near Zero — Here’s Why appeared first on BeInCrypto.


 English (US) ·