
 2 months ago
41
2 months ago
41
- Ethereum saw $466M in liquidations as longs absorbed most of the damage during a 15% drop
- ETH broke below key demand zones near $2,500 and $2,100, confirming bearish momentum
- Liquidation heatmaps suggest $2,100–$2,400 may act as sell zones, while $1,500 remains a downside target
On February 5, Ethereum saw a brutal liquidation event, with roughly $466.4 million wiped out in a single day. Most of that pain landed on the long side, with around $382 million in long liquidations, which tells you exactly who was leaning the wrong way. ETH price dropped nearly 15% during the session, sliding from about $2,148 down to $1,826, and the move wasn’t gentle.
This kind of flush doesn’t happen in a calm market. Crypto sentiment was already deep in panic mode, with the Fear and Greed Index falling to 11, a level not seen since 2023. Historically, sub-20 readings signal heightened stress, forced selling, and broad de-risking across the board. When that kind of fear takes over, technical levels don’t always hold the way they’re “supposed” to.
At the same time, ETH/BTC hit a three-year low, reflecting Ethereum’s severe underperformance against Bitcoin. The $2,000 level was already flagged as a key psychological zone at risk, and Ethereum has now slipped below it, turning what was once support into a new problem overhead.
ETH breaks major demand zones as bears stay in control
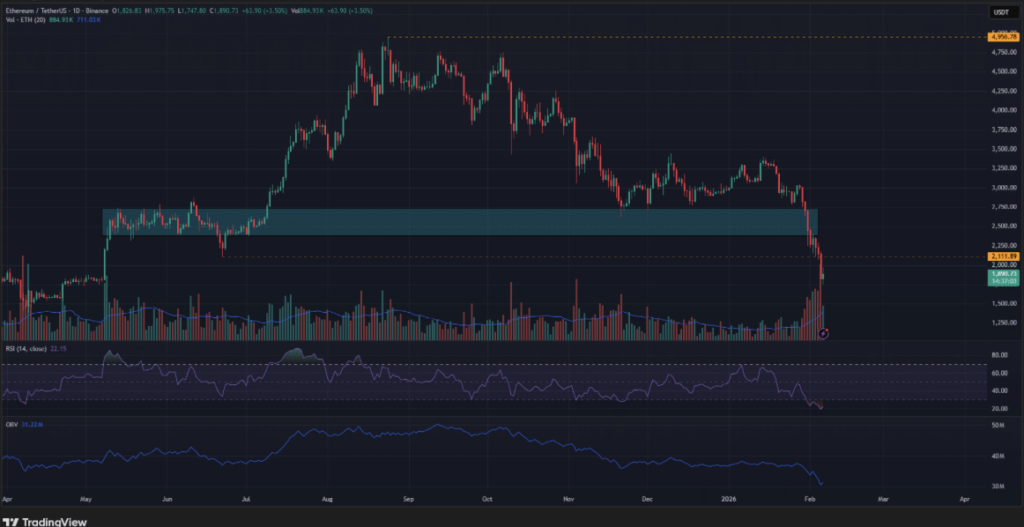
On the daily chart, the strength of the bears has been obvious. Back in May and June last year, Ethereum spent weeks consolidating around $2,500 before exploding higher in July. That same zone was tested again in November, held as support, and produced a bounce, giving bulls a reason to stay confident.
This time, there was no such reaction. The most recent retest over the past week saw ETH bulls barely show up. Price pushed straight through the $2,500 demand zone and continued lower, slicing through the weekly swing point around $2,100 as well. When a market bulldozes through levels that previously mattered, it usually means one thing: the trend has shifted, and buyers are stepping back.
Momentum indicators confirmed the damage. RSI was deep in oversold territory, with the daily RSI printing around 18.68 on February 5, the lowest reading since August 2024. OBV also dropped to a fresh low, reflecting heavy sell volume rather than a controlled pullback. This wasn’t a slow correction, it was an unwind.
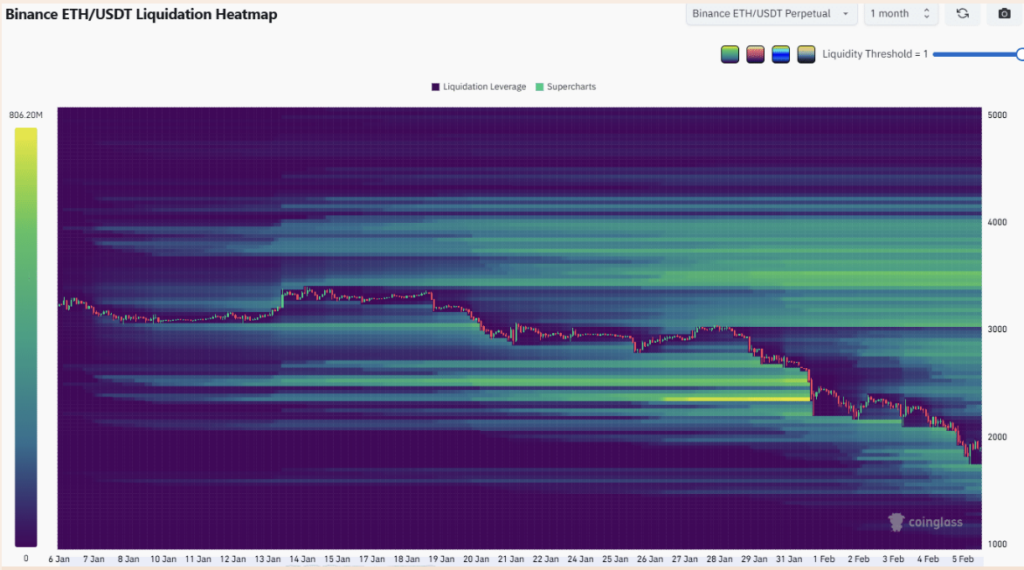
Liquidation heatmap shows downside liquidity has been cleared
Liquidation data adds another layer to what’s happening. The one-month liquidation heatmap shows that liquidity to the downside has been largely wiped out, meaning a big chunk of forced selling has already played out. Zooming out to the one-year heatmap shows the same thing, with a massive liquidation pocket around $2,000 getting cleared during the recent drop.
That matters because liquidation zones often act like magnets. Once a major cluster gets taken out, price frequently searches for the next big pool. According to the heatmap, the next major magnetic zones sit further south, around $1,500 and below, which is not exactly what bulls want to hear.
On the upside, there are still notable liquidation zones around $2,400 and the $2,700 to $2,900 range. These areas could attract price if ETH manages a recovery bounce, but the market would need to stabilize first. Right now, it’s still in damage-control mode.
Why traders may want to sell the bounce
The lack of reaction at the $2,400 demand zone is a clear sign of bearish dominance. When a market fails to defend a level that previously mattered, it often turns into resistance on the way back up. That’s why swing traders looking to catch an ETH bounce should be cautious. A bounce can happen, sure, but that doesn’t mean the trend has flipped.
A further drop toward $1,500 remains possible, especially if broader market conditions stay risk-off. In the coming weeks, the $2,100 and $2,400 zones are likely to be revisited, and traders should be prepared for bearish reactions around those levels. In a market like this, selling rallies tends to be the higher-probability play until price proves otherwise.
Disclaimer: BlockNews provides independent reporting on crypto, blockchain, and digital finance. All content is for informational purposes only and does not constitute financial advice. Readers should do their own research before making investment decisions. Some articles may use AI tools to assist in drafting, but every piece is reviewed and edited by our editorial team of experienced crypto writers and analysts before publication.


 English (US) ·