
 7 months ago
55
7 months ago
55
Since the beginning of this year, Ethereum has underperformed compared to major digital assets in the market. ETH’s underperformance has sparked concerns within the community, with traders finding it difficult to determine whether the altcoin is gearing up for a major rally or further downside pressure. However, current price action shows that ETH might be set for a price rebound in the short term.
Chart Pattern Hints At A Recovery For Ethereum
In an X (formerly Twitter) post, Ali Martinez, a seasoned technical expert and trader, highlighted a bullish development in the Ethereum chart. The expert has pointed out the formation of a key chart pattern, which could reignite upside momentum and push ETH toward key resistance levels.
Delving into Ethereum‘s recent price action, a Parallel Channel pattern has emerged in the 1-day time frame. Specifically, a parallel channel is a technical chart pattern created by connecting highs and lows with two parallel trendlines. This chart formation helps investors and traders determine the potential entry and exit points in a cryptocurrency’s price.
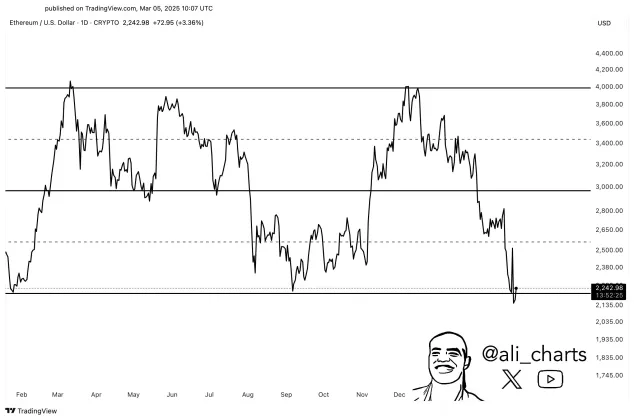
Presently, Ali Martinez noted that the altcoin is testing the lower boundary of the key pattern, where it may secure enough strength to transition to the upside. In the event that the pattern triggers a bounce for ETH to reclaim the $2,350 level, it will fuel a strong recovery toward $3,000 and $4,000.
As the asset tests the pattern’s lower boundary, it shows that ETH is at a pivotal junction as it gears up for its next move. With ETH hovering near key resistance levels, bullish momentum continues to build, raising the possibility of a rebound for a crucial breakout.
Investors Cut Back Their Exposure To ETH
Amid the bearish movements, on-chain data is showing a decrease in ETH exposure among investors. A recent report from on-chain data and financial platform Glassnode reveals that Ethereum investors actively managed their exposure during this turbulent period.
Ethereum retraced to the $2,050 area following a surge to about $2,500, levels last seen in November 2023, probably contributing to the current shift in investors’ behavior. Looking at Glassnode’s chart in the 3-month view, there is robust engagement from investors with an initial cost basis at the $3,500 mark.
Data shows that these holders diligently reduced their exposure throughout February as they stepped in at the local top at $2,500 and the bottom at $2,050. Furthermore, these holders have reduced their initial cost basis by about 10% and currently hold over 1.75 million ETH at $3,200.
Even as Ethereum’s price declines, this trend has continued. On March 1, Glassnode noted that 500,000 ETH were purchased at $2,200 but were promptly redistributed at the $2,500 local top.
Meanwhile, the $2,800 mark is the first major resistance barrier, where 800,000 ETH has been accumulated. Glassnode expresses much importance to this level as a price recovery is likely to occur in this area.


 English (US) ·